
Non-uniform hybrid strategy for architecting and modeling flight vehicle focused system-of-systems operations
2016-11-21 09:24TianYifengLiuHuLuoMingqiangHuangJun
CHINESE JOURNAL OF AERONAUTICS 2016年1期
Tian Yifeng,Liu Hu,Luo Mingqiang,Huang Jun
School of Aeronautic Science and Engineering,Beihang University,Beijing 100083,China
1.Introduction
Since the concept of system-of-systems(SoS)1–5was introduced into the area of military by Owens1in 1996,the impact of SoS on design and application of new flight vehicle has received an increasing attention.And the in fluence has extended from military vehicles to airliner,6–9maritime applications10and other civilian fields.Actually,SoS has penetrated into every major phase of the vehicle life-cycle.For example,the design requirements in conceptual design phase are obviously determined according to the operations to be performed.In addition,the effectiveness of these operations should also be considered in the process of design parameter selection and design evaluation.These operations are usually complex and have the characteristics of SoS,2so they are called SoS operations for short in this research.Moreover,to make an optimal decision in the process of application,users,especially commanders,must take into account both performances of a flight vehicle and situation of current operation.Although crucial factors are related to a wide range of SoS operations,the attention of designers or users is basically focused on flight vehicle itself,so this type of operations can be called ‘ flight vehicle focused SoS operations”.
Modeling and simulation(M&S)has been applied as an effective way for designers and users(hereinafter generally referred to as decision-makers)to grasp the rules of SoS and then make a reasonable and optimal decision through plenty of ‘what-if”studies.Extensive researches on this subject have been carried out,among which the typical works include a series of researches on technology assessment and stochastic SoS modeling by Georgia Institute of Technology10,11and the SoS design of airliner and unmanned aerial vehicle by Purdue University.12–15All of these works targeted at flight vehicle focused SoS operations and show some common features,such as involving the uncertainty and discontinuities,simplifying the calculation procedure by surrogate models and applying various modeling methods such as agent,10,14mixed integer nonlinear programming,12network theory,14,15etc.
However,the scale of most SoS operations in available literatures is relatively limited for the reason that many intricate‘stories” behind an SoS operation are simpli fied.For example,the emergence of hostile time-sensitive targets may be driven by ground combat,and marine perils might be the impact of atrocious weather on a fleet.Obviously,unfolding these stories will make decision-makers get a more complete SoS operation picture and more accurate information,leading to more reasonable decisions.However,this will also increase complexity of SoS and raise the cost of M&S.
Balancing the contradiction between comprehensiveness of SoS description and cost of M&S is the major objective of this research,and two basic points provide the research idea:(1)as for flight vehicle focused SoS operations,there is no need to put equal attention on every factor involved;(2)different modeling methods differ in abstract level and computational complexity.Based on these points,a method named non-uniform hybrid strategy(NUHYS)was proposed,which provides a new approach to architect and model flight vehicle focused SoS operations through three major steps,i.e.,grouping,categorizing and matching,which will be described in detail in the following sections.In order to illustrate the detailed procedure and validity of NUHYS,a helicopter rescue in the case of earthquake relief is discussed and analyzed profoundly.
2.Concept and methodology of NUHYS
2.1.System community based grouping
Architecting is the basis of modeling an SoS operation.One of the common forms of architecting SoS is a top-down or bottom-up hierarchy in aerospace related researches.For instance,de Laurentis et al.16,17established a taxonomy with a hierarchy which consists of α,β,γ and δ levels to guide analysis and decision;Biltgen11introduced an architecture that comprises SoS level,system level and subsystem level;Talley and Mavris18proposed a robust conceptual design method and divided SoS problem into top operational environment and scenario(OES),base level and intermediate levels.
Hierarchical architecture can help classify various problems encountered in an SoS operation into corresponding levels and clearly show the connection between each level.However,when an SoS operation is extremely complex,it is dif ficult to perfectly present the relationship between each factor by hierarchical architecture.Therefore,de Laurentis and Callaway17conducted subsystem division at every level from different aspects such as resources,operations,policy and economics,and the Department of Defense Architecture Framework(DoDAF)19describes SoS problem through different views.However,modeling individual units in base level,which is usually in large amount,is also an immense project.
Another signi ficant fact is that most systems in an SoS operation do not always interact with other systems independently.In other words,some systems often behave as a group and connect with other groups or systems from the perspective of the whole group.Actually,it is a common phenomenon in human society.For instance,according to the concept of SoS,a single person could be regarded as a basic element at the base level.But it will be a dif ficult task to build every person as an individual model if a whole city is investigated.However,a single person usually belongs to a group,like a company,a school or a government department,and it is reasonable to use one model to describe several persons belonging to one group when a whole city is considered as an SoS.The similar properties also occur in nature,like the division of labor among leafcutter ants.20In this paper,the group with similar systems is de fined as system community(SC).
The first step of NUHYS is grouping systems and building SC according to their similarities.For a complicated SoS,the following criteria should be met to build an SC:
(1)Independence of members of SC.Each member of an SC is an independent system that can operate on its own.Independence of systems in an SoS is an essential characteristic,so independent system is the basic unit of an SC.Although many systems could be broken down into subsystems or performance parameters,they cannot operate independently,thus they are not quali fied to be de fined as members of an SC.
(2)DiversityofSCscale.DuetothedifferentgroupcharacteristicsamongSCs,anSCcouldeitherbeasmallcommunity which contains a few systems with simple links or a large one with complicated links among many systems,or even theSCitselfisanSoSwhichconformstothe fivecharacteristics proposed by Maier.2There is one noteworthy point that one single system cannot constitute an SC.
(3)Incomplete coverage of SC.A complex SoS may contain
a number of SCs,and could be covered by as many SCs as possible.However,it is unnecessary to incorporate all systems in SC due to the existence of relatively independent system(RIS).The term ‘relatively” is used in RIS because if a system is totally isolated and has no connection with others,it should be ruled out of SC or even SoS.
(4)Common interests of members of an SC.The members of an SC could interact with other SCs or systems,but the more important fact is that they share collective connections and interactions with the outside,which is also the most signi ficant principle to determine SCs.
(5)Dynamic of SCs.The members of a complex SC are not fixed,implying that they could change over time,such as increasing in number,moving to another SC or vanishing from the SC.
(6)Non-uniqueness of SC division.Non-uniqueness results from multipleattributesofmembersystems.For instance,a person is an employee of Company A and also belongs to University B as an alumnus at the same time.The grouping of SC should not be affected by a speci fic member system,which means an SC is feasible as long as it conforms to the five rules above.
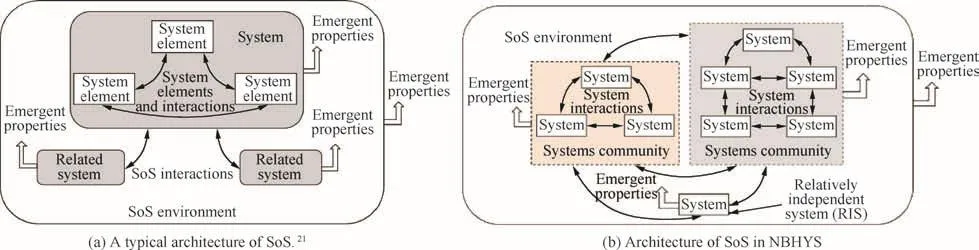
Fig.1 Comparison of architectures of system-of-systems(SoS).
In contrast with the architecture in Ref.21(see Fig.1(a)),a new architecture of SoS can be obtained through grouping(Fig.1(b)).It is not hard to tell from the comparison that focus has been transferred from basic component systems to SCs and RISs,which will reduce the workload of modeling effectively.In addition,the new architecture does not violate the hierarchical architecture since any system belonging to SC,including its subsystems and performance parameters,can also be classi fied into other kinds of levels.
2.2.Categorizing SCs and RISs
The second step of NUHYS is to categorize SCs and RISs,which are collectively referred to as ‘Contributors” since both of them make contributions to an SoS operation.In NUHYS,two parameters,contributors complexity(CC)and focus relationship(FR),are introduced as the criteria of categorization.CC is determined comprehensively by scale of contributor members,connection of members,intelligence of members and the frequency of variation of member systems.The expression is shown as

whereSmdenotes scale of members,Cmconnection of members,Imintelligence of members andFmfrequency of variation.FR is de fined as the correlation between contributors and the focus of SoS.The expression of FR is given here.

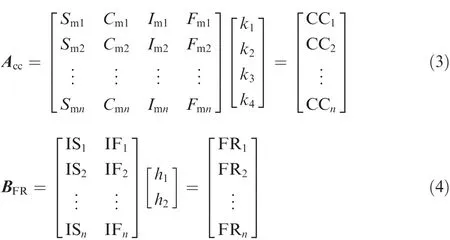
where IS is the interaction scale between contributors and the focus,and IF is the interaction frequency.If a contributor has an impact on the focus directly,FR will be higher.With the two parameters,each contributor could be expressed as coordinates,such as SC(CC,FR).The speci fic quantitative process of coordinates is shown in Fig.2 and Eqs.(3)and(4).Accand
BFRare the matrice of CC and FR.CC and FR should be scored through evaluating the level of each attribute.If the number of contributors is small,three-level evaluation may be enough.If the number is large, five-level evaluation is more suitable to distinguish them.Taking three-level evaluation as an example,each attribute of CC and FR is evaluated as low,middle or high level based on their characteristics.Each level which is represented as a symbol in Fig.2 has a score.For instance,low level is 1 point,middle level is 2 points and high level is 3 points.Meanwhile,each attribute has a weighting factor,which is expressed askorh.The weighted sum of attributes’scores represents CC or FR.Based on the coordinates,SCs and RISs could be categorized into the four quadrants of the contributors categorizing graph(CCG,see the bottom of Fig.2).The quadrants are divided by the midvalues of CC and FR.
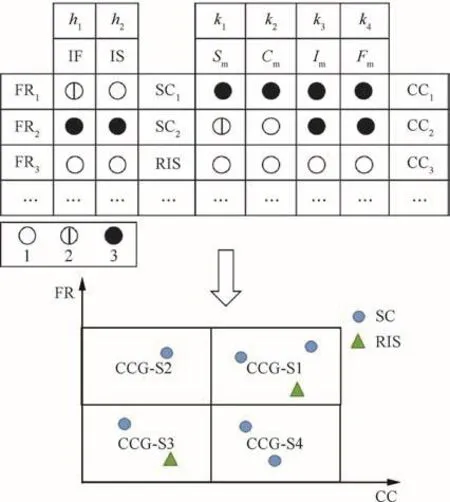
Fig.2 Quantitative process of contributors.
2.3.Categorizing modeling methods
Categorizing different modeling methods is a fundamental part in NUHYS.As mentioned in the introduction section,many modeling theories and methods about SoS problem have been established so far.In order to match them with different contributors,a simple way is putting them into a modeling methods pool together,and then choosing the suitable one based on the characteristics of each contributor.However,this way lacks guidance of practical operation.The authors also tried to categorize methods according to abstraction level of modeling,but categorizing only based on one parameter is rather limited due to the diversity of modeling methods.Thus in this paper,modeling methods are categorized based on two parameters,dynamic attention rate(DyAR)and details attention rate(DeAR).DyAR describes the macroscopic dynamic changes of variables and systems.DeAR describes the details of models and behavior.A ‘bottom-up” modeling method tends to have a higher DeAR,while the DyAR of a ‘topdown”method may be higher.Then modeling methods could also be expressed as coordinates,such as(Dy,De).
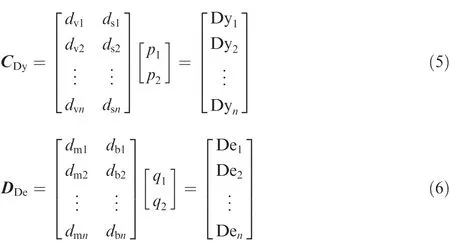
The speci fic quantitative process is shown in Eqs.(5)and(6).The calculative process is similar to categorizing contributors.CDyand DDeare the matrice of DyAR and DeAR.Here take five-level evaluation as an example.The attributes of modeling methods are evaluated as five levels,and the scores of each level are 1,2,3,4 and 5 points respectively.In the two equations,dvrepresents the dynamic changes of variables,dsdynamic changes of systems,dmdetails of models anddbdetails of behavior.Fig.3 shows the scores of four modeling methods.Here the weighting factors are set as 1 to 2.The coordinates of agent-based modeling are(13,15)because they have a high DeAR and DyAR.The coordinates of discrete event modeling are(8,14)because they are more suitable to describe a system with a strong time sequence and logic.The coordinates of analytic method are(6,3)because they usually describe system with analytical formulas or statistical data.The coordinates of system dynamics are(15,4)because they are usually used to describe a macroscopic problem.Then they could be categorized into the four quadrants of the modeling methodscategorizinggraph(MCG,seethebottom of Fig.3).Some other modeling methods could also be scored based on this process.And with multi-disciplinary integration,more and more hybrid modeling methods will be proposed such as integrating agent-based simulation and system dynamics.22Hybrid modeling methods can be scored based on the mixing degree.For example,Point MP5 in Fig.3 is a mix of system dynamics and agent.
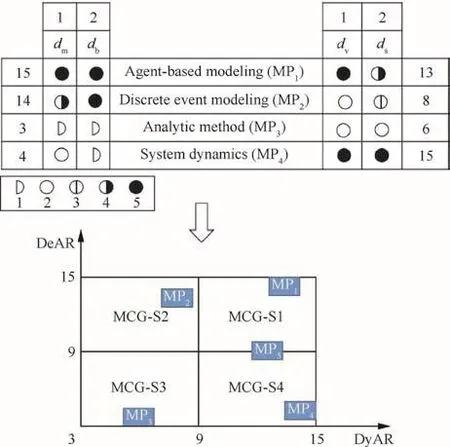
Fig.3 Quantitative process of modeling methods.
2.4.Matching in NUHYS
Integrating Figs.2 and 3,NUHYS matching graph can be obtained(see Fig.4).The four quadrants of CCG correspond to the quadrants of MCG in location.The lines which connect the points of relative quadrants represent the chosen methods for different SCs and RISs.For instance,if both CC and FR of a contributor are high,modeling methods with high DeAR and DyAR are recommended.On the contrary,if CC and FR are both low,modeling methods with low DeAR and DyAR are recommended.
The core idea of NUHYS is to match contributors and modeling methods appropriately,which means complex modeling methods with a high computing cost should be matched with the most relevant parts to the focus of an SoS operation,while simple modeling methods with a low computing cost should be matched with the parts which take subsidiary function.After non-uniform hybrid,the modeling complexity of different SCs and RISs will be obviously different.This is helpful for technology assessment and trade studies,where it is usually necessary to change one or multiple variables in one system,or multiple variables in several systems so as to study the impact of these variables on systems.Thus,under the condition that architecture of SoS and modeling strategy of each SC and RIS keep the same,NUHYS can help decisionmakers judge pros and cons of changing a variable or a couple of variables,which is critical for decision making.
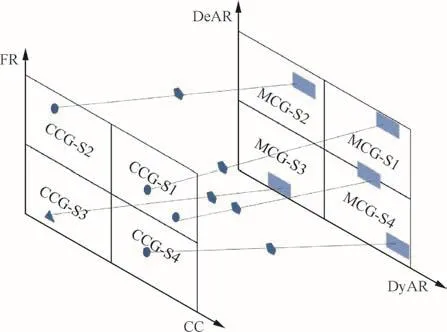
Fig.4 NUHYS matching graph.
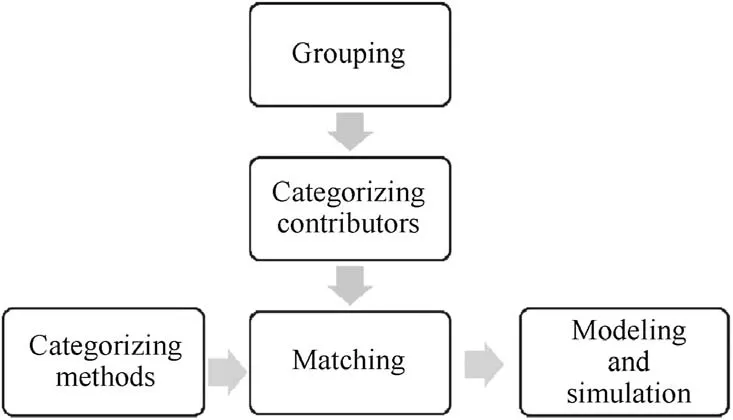
Fig.5 Graph of NUHYS procedure.
As a summary,the procedure of NUHYS could be described as ‘3+1” shown in Fig.5.‘3” represents grouping contributors,categorizing contributors and matching contributors with modeling methods.And ‘1” represents categorizing modeling methods—this part is independent,because it does not pertain to a speci fic SoS operation and can be regarded as a basic and continuous work.
After architecting a flight vehicle focused SoS operation and matching related modeling methods based on NUHYS,the next step is to model SCs and RISs according to corresponding methods and achieve interaction through the information flow between SCs and RISs.Furthermore,simulation of different contributors will be conducted based on the same timeline to make technology assessment and evaluation.
3.Application of NUHYS to helicopter rescue in earthquake relief
3.1.Characteristics of helicopter rescue and basic assumptions
Helicopter plays an important and unique role in a variety of natural disaster relief,especially large-scale disaster relief.For earthquake relief,due to the damage of roads,it is often dif ficult for land vehicles to reach target areas in time,23while helicopter can quickly respond and adapt to different complex terrains.Therefore,the optimization of a helicopter rescue plan and evaluating the effect of a new helicopter’s performance on potential disaster rescue operations are always concerned by decision-makers.
In the helicopter rescue mission,the basic variable is demands of disaster areas and the purpose is to decide a rescue plan to ful fill the demands.First,decision-makers must obtain the demands of different disaster areas.Then,they must analyze whether current helicopters in airports could satisfy the demands.So the gap between demands and relief supplies is needed.If current helicopters cannot finish mission in time,decision-makers should study how to improve it,such as calculating the minimum number of helicopters or load capacity so that they can request helicopters from other airports quickly.Thus some sensitivity analysis data of helicopter parameters are needed.
However,earthquakes are hard to predict.The location,magnitude and time of occurrence are unknown before it happens.If decision-makers want to make a helicopter rescue plan quickly,the rescue simulation must have a high calculating speed and the results should be accurate enough.If all models are built with the same modeling method,the simulation might be too simpli fied to get relatively accurate data or so complicated that it will take too much time and cost in modeling and operating.Both situations are unacceptable.So it is necessary to apply two or more modeling methods to this problem for maximizing time and computational resources and saving cost.This process could be driven by NUHYS.NUHYS will provide a strategy to analyze the architecture of helicopter rescue problem and establish the model more effectively.Meanwhile,it provides a faster simulation and evaluation speed for decision-makers to obtain mission data and optimal data.
In general,helicopter rescue mission includes four main components,i.e.,helicopter system,disaster area system,airport service system and weather system.Each part operates independently as well as interacts with each other.It is rather dif ficult to build detailed models for all components in this SoS.However,because the purpose is to make a helicopter rescue plan,a simpli fied model established based on NUHYS is better.
For a better explanation of NUHYS,some abstraction and simpli fication are made as follows:
(1)Helicopter rescue mission is to transport relief supplies to disaster areas.
(2)Helicopters in the simulation are of the same type.
(3)The case that some helicopters withdraw from the rescue due to breakdown is not considered.
(4)The casualties caused by the aftershock and other accidents will not be taken into account.
(5)Helicopter rescue operation lasts from the first day to the seventh day after earthquake,and the ground transportation cannot be carried out due to the damaged roads in this period.
3.2.Application of NUHYS procedure
When analyzing an SoS operation based on NUHYS,the first step is to group different systems.In this SoS operation,a single helicopter is an independent system,but all helicopters serve for transporting relief supplies as a whole.So helicopters should be regarded as an SC.
After earthquake,survivors usually disperse to different open fields and form safety zone groups distributed throughout the disaster areas.Different safety zones could communicate with each other or merge into larger ones,thus each zone could be regarded as a system.Meanwhile,all safety zones as a whole show the characteristic that they need relief supplies,so all the safety zones in a disaster area could be grouped as an SC.
In the airport service process,maintenance personnel,fuel loading system and cargo loading system operate independently but perform the function of providing service for helicopters collectively.So the whole airport system could be regarded as an SC.
By contrast,the weather system is relatively independent.Although it interacts with other systems,it does not belong to a particular SC or another system.So the weather system is regarded as a RIS.Based on the above analyses,the architecture of this operation can be obtained(see Fig.6).
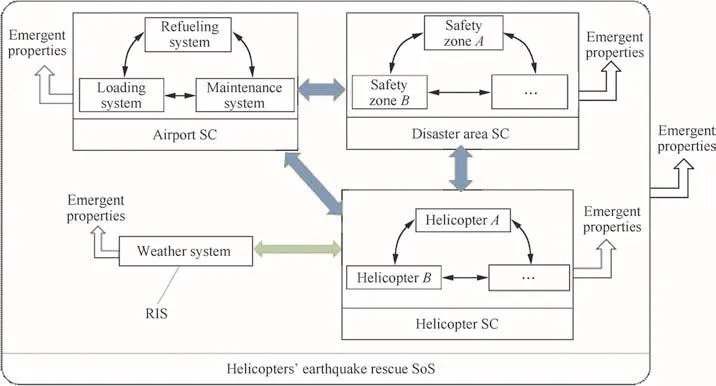
Fig.6 Architecture of helicopter rescue operation.
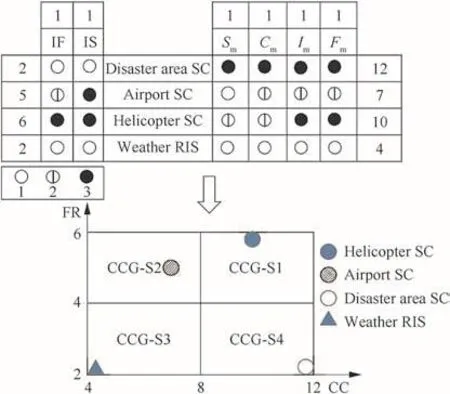
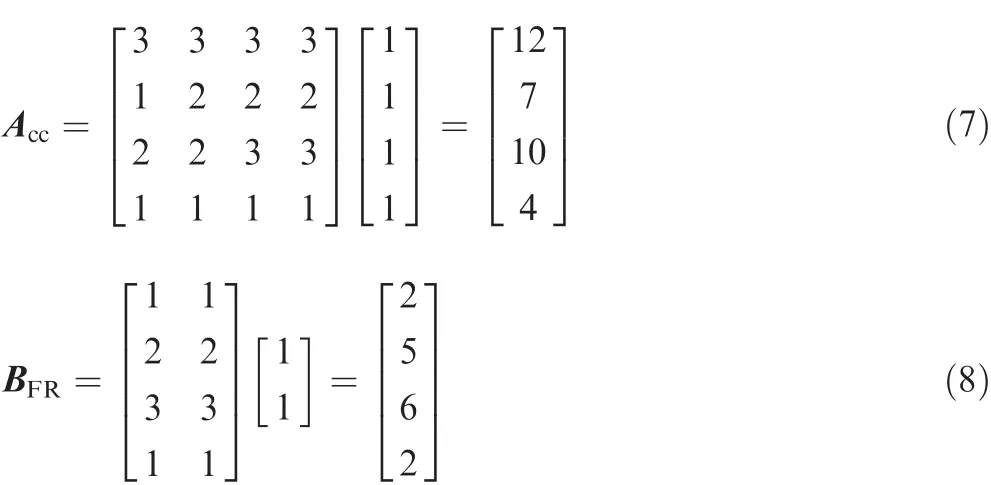
Fig.7 Quantitative process of four contributors.
Secondly,SCs and RISs should be categorized by analyzing CC and FR of each contributor.The quantitative process is shown in Eqs.(7)and(8)and Fig.7.In this example,the weighting factors are set as 1 because the attributes are equally important in the modeling process.The coordinates of disaster area SC are(12,2)located in CCG-S4,and a high CC is due to large numbers of members,complex relationship between members and high intelligence of members,but FR is low because its interaction with mission focus is mainly based on demands.The coordinates of airport SC are(7,5)located in CCG-S2,because the service process in airport is usually fixed but service resources and service time directly affect mission effectiveness of helicopters.The coordinates of helicopter SC are(10,6)located in CCG-S1,because helicopters have a high autonomy,and meanwhile mission effectiveness is directly related to helicopters,such as the number,load capacity,cruise speed,etc.At last,weather RIS has low CC and FR.It can be regarded as an external factor in fluencing the mission.For instance,the fog leads to the change of helicopters’routine.Thus its coordinates are(4,2)located in CCG-S3.
After categorizing SCs and RIS,the final step is to match contributors with modeling methods(see Fig.8).System dynamics is used to model disaster area SC,ignoring details and focusing on the dynamic change of demands.Discrete event modeling is suitable for the airport SC in order to describe the process of airport service.Helicopter SC is modeled based on agent to re flect autonomy and reactivity of helicopters.Weather system could be described as a probability distribution according to statistical data.The detailed modeling procedure of each contributor will be presented in the following section.
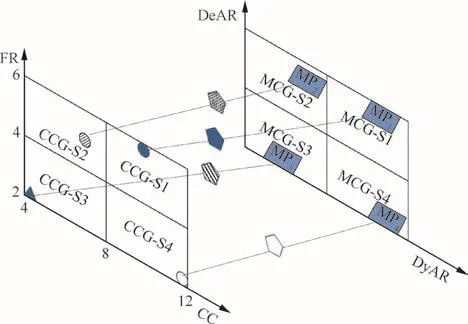
Fig.8 Matching contributors with modeling methods.
4.Procedure of modeling contributors in helicopter rescue
4.1.System dynamics modeling of disaster area SC
The system dynamics model of disaster area SC can intuitively show the causality and feedback between variables,shifting the focus from equations and data to transmission direction of data and system structure.Fig.9 shows the stock- flow model of disaster area SC.In this SC,survivors,consumption and casualty are all abstracted as convergent variables and their functional relations motivate the changes of demands.
To estimate the severity of the earthquake and casualty,a series of empirical formulas used for seismic belt in southwest China proposed by Wu et al.24,which has been applied to roughly assess Wenchuan earthquake and Yushu earthquake,is employed in present paper.The estimation formula for seismic intensity is shown as
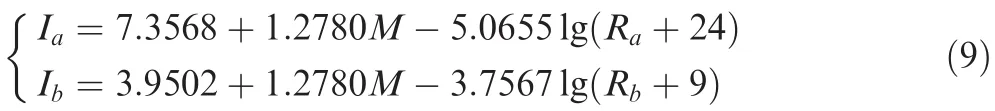
whereaandbrepresent the semi major axis and semi minor axis of the elliptical isoseismal line,respectively;Mis earthquake magnitude;RaandRbdenote the distance from epicenter in km;IaandIbdenote seismic intensity of the isoseismal line.
The estimation formulas for casualty are shown as
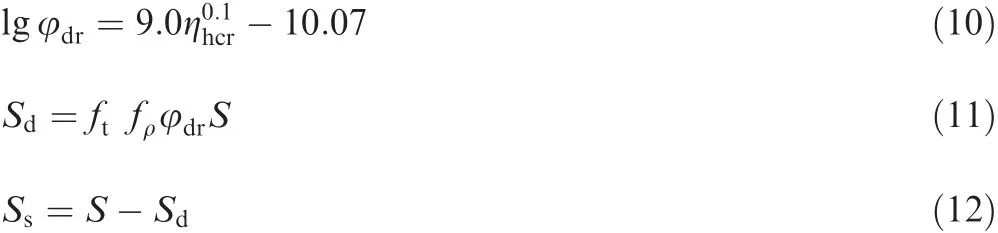
where φdris the death rate;ηhcris the house collapse rate(the area ratio of collapsed houses to all houses),the empirical value of which is shown in Table 1;Sthe total population;Sdthe death toll after correction;Ssthe total number of survivors;fρthe population density correction factor,the empirical value of which is shown in Table 2;ftthe time correction factor,the empirical value of which is shown in Table 3(Thevalue in Table 3 represents the correction factor of night when that of daytime is taken as 1).
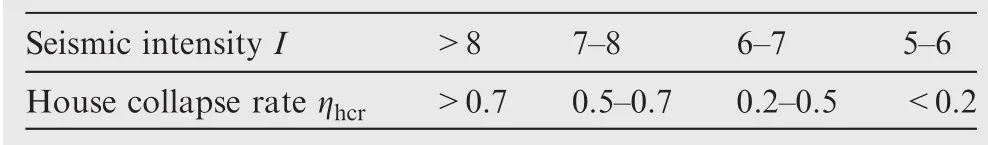
Table 1 Relationship between seismic intensity and house collapse rate.
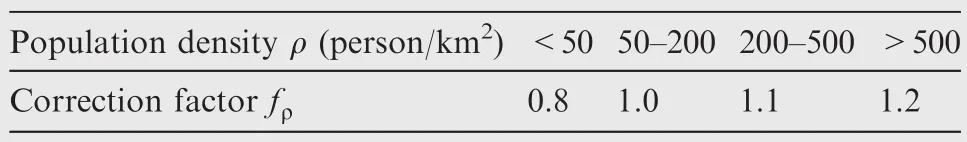
Table 2 Population density correction factor.
The demands for relief supplies are divided to two types:consumable demands(such as food and water)and nonexpendable demands(such as tents and clothes).The corresponding formulas are simpli fied from Ref.25:
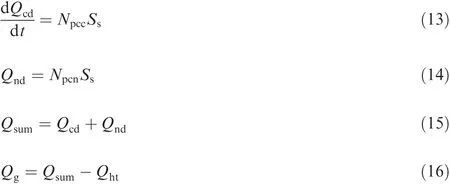
whereNpccis the consumable demands per capita per hour;Qcdthe integral of the consumption rate;Npcnthe per-capita nonexpendable demands;Qndthe total nonexpendable demands;Qsumthe total demands in disaster area SC;Qgthe gap between supply and demand,which is obtained by subtracting the relief suppliesQhtdelivered by helicopters from the total demandsQsum.The gapQgwill drive the rescue behavior of helicopter SC.
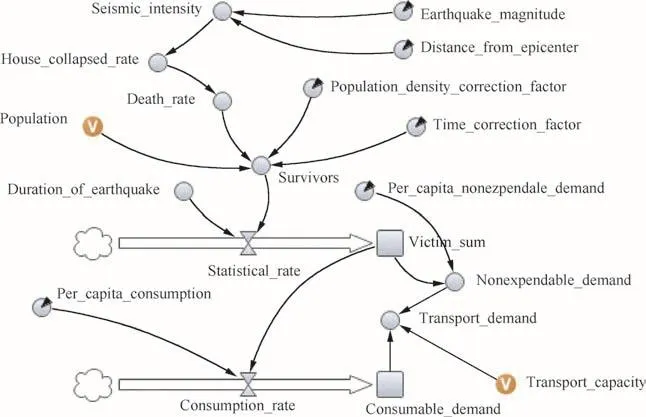
Fig.9 System dynamics modeling of disaster area SC.
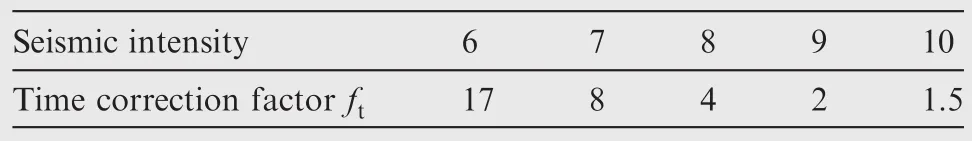
Table 3 Time correction factor.
4.2.Discrete event modeling of airport SC
Fig.10 shows the discrete event modeling of airport SC including preparing for refueling,refueling,checking after refueling,loading,overall check,maintenance,etc.The interaction between airport and helicopters mainly concentrates on the allocation of resources during refueling and loading.Since fuel trucks and pumps are limited,all helicopters cannot be refueled at the same time.Similarly,loading service can only be provided for limited helicopters each time.Therefore,two variables,fuel-resource and load-resource,are introduced to describe the limitations of airport resources.Different airports have different resources and capacities of services.
It is premised that helicopters completing preparations first will be refueled first while the others queue up to get refueled,and the number of helicopters getting refueled at a time is determined by the airport resources.In terms of refueling time,a normal distribution is assumed to describe it since there are suf ficient samples.The refueling time is expressed as normal(min,max,mean,sigma)in which the variables represent minimum value,maximum value,mean value and standard deviation,respectively.However,there are not enough samples of loading time because disaster relief is an emergency transportation task,thus loading time is regarded as a triangular distribution,expressed as triangular(min,max,mode),in which mode represents the value with maximum probability.The whole process of ground service is cyclic so as to provide continuous service for helicopters.
4.3.Agent-based modeling of helicopter SC
In general,the behavior of helicopter agents is divided into two parts,task analysis and rescue operation.Fig.11 shows the detailed process of the behavior of helicopter agents.First,helicopter agents receive the data of demands from disaster area SC.And then they make decisions based on related rules.Finally,helicopters will be allocated to different areas.In present paper,the number of helicopters which are allocated to a certain disaster area SC is decided by the percentage of demands.The rules of allocation are not fixed,i.e.,more rules can be added based on speci fic terrain and situation.
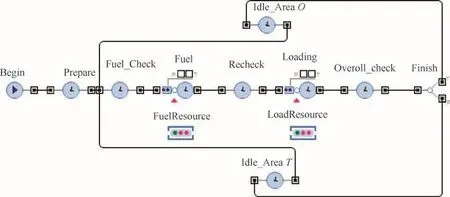
Fig.10 Discrete event modeling of airport SC.
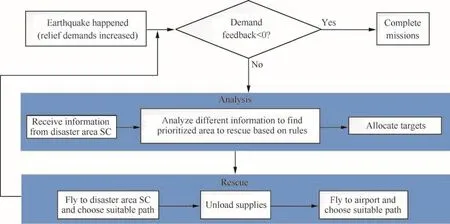
Fig.11 Behavior procedure of helicopter agents.
Helicopter agents have various attributes,among which three variables,number of helicopter agents,cruise speed and load capacity,are chosen to study their in fluence on earthquake relief.More variables could be added according to the requirements of research work.For a single helicopter agent,it has five behavior states:idle state,forward state,rescue state,backward state and maintenance state.The behavior of each state represents accepting airport service, flying to disaster areas,unloading supplies,returning to airport and accepting maintenance for the next task,respectively.If a helicopter agent finishes the behavior corresponding to its current state,it will switch to the next state for new behavior.It should be mentioned that helicopter agents also need to react to the environment.For instance,they will choose prior path under normal condition;however,when encountering heavy fog,they will choose new path to bypass the fog area.
4.4.Modeling of weather RIS
Weather RIS has a direct in fluence on helicopters.In adverse weather conditions,helicopters will have to choose new paths or stop current mission until the weather gets better.The in fluence of weather RIS on helicopters can be simpli fied and described as time,location and probability of occurrence despite its complexity.
In the present paper,the fog is chosen as the main stochastic factor,occurring in accordance with the probability during simulation.To simplify the model,the number of fog areas here is set as 3 and they are placed on initial paths.The time of occurrence is described as uniform distribution,which is expressed as uniform(min,max).It means the fog may appear in the related timeline with equal probability.However,the duration of fog is expressed as a normal distribution formed by the statistical data of this area.
5.Simulation results and trade-off
5.1.Simulation results under initial condition
After grouping and categorizing the whole SoS based on NUHYS,the modeling contents and modeling method of each contributor become clear.Without signi ficantly affecting the precision of simulation,NUHYS can reduce time and cost in modeling and simulation process.In this example,the whole rescue operation in reality lasts 168 h,but it takes only 0.9 s to run a simulation by a personal computer with mainstream con figuration(2.6 GHz CPU,4G RAM).Table 4 shows main input variables of disaster area SC(two SCs that are denoted as AreaAand AreaB),airport SC,helicopter SC and weather RIS in this SoS operation.
Fig.12 gives two scenes of speci fic disaster areas with high seismic activity in Sichuan province,China.Fig.12(a)shows a snapshot in normal weather and Fig.12(b)shows a snapshot in foggy weather.The disaster areas which need to be assisted are marked by red targets and the demands for relief supplies are marked by red texts.The green house represents the airport and the green words describe the number of helicopters in different operation states.The patterns of clouds represent the fog areas.
The simulation results are shown in Fig.13 and Table 5.Fig.13 shows the demand variation of disaster areas in 7 days.In Fig.13,the horizontal coordinate is the time in h and the longitudinal coordinate is the weight in kg.The green curve shows the total demand variation(Qsum)in disaster areas,the red curve shows the relief supply variation(Qht)and the blue curve shows the gap variation(Qg).Table 5 shows some speci fic data of the three outputs in different points in time.From them,it can be seen that the gap between demands and relief supplies gets bigger and bigger.It is because the helicopters in airport are unable to satisfy the mission requirement.The reason may be that the number of helicopters is too small,or the load capacity and cruise speed of helicoptersare not enough.Then decision-makers should find a solution to decrease the gap through analyzing the impact of helicopter parameters on the gap.The sensitivity analysis is an effective way to obtain related data.
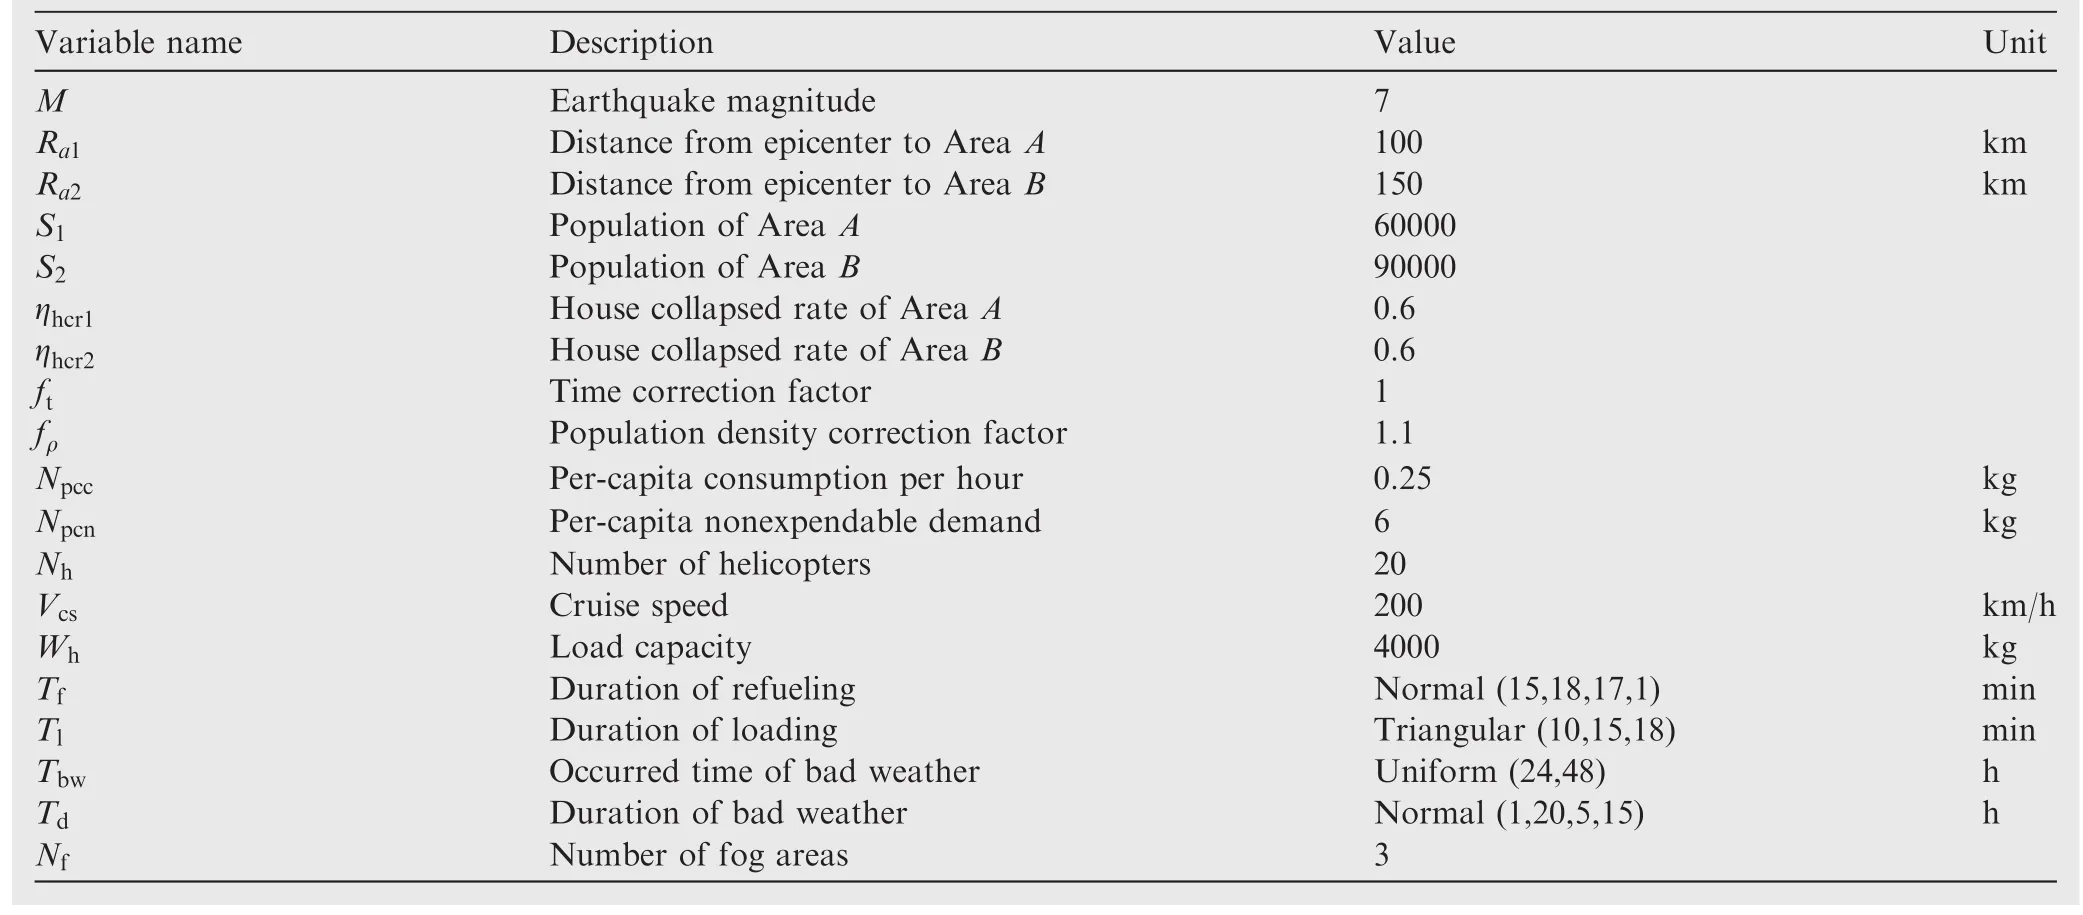
Table 4 List of main inputs.
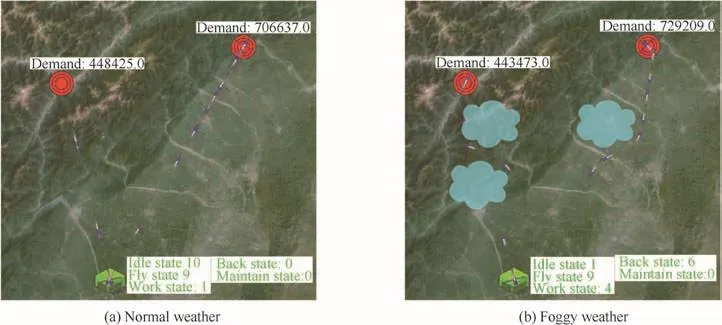
Fig.12 Typical snapshots during simulation.
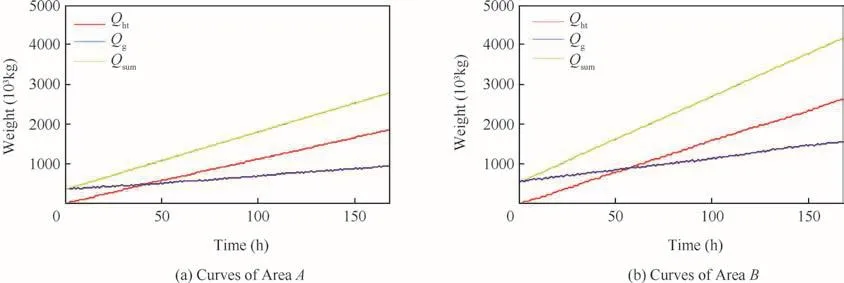
Fig.13 Demand variation with initial helicopters.
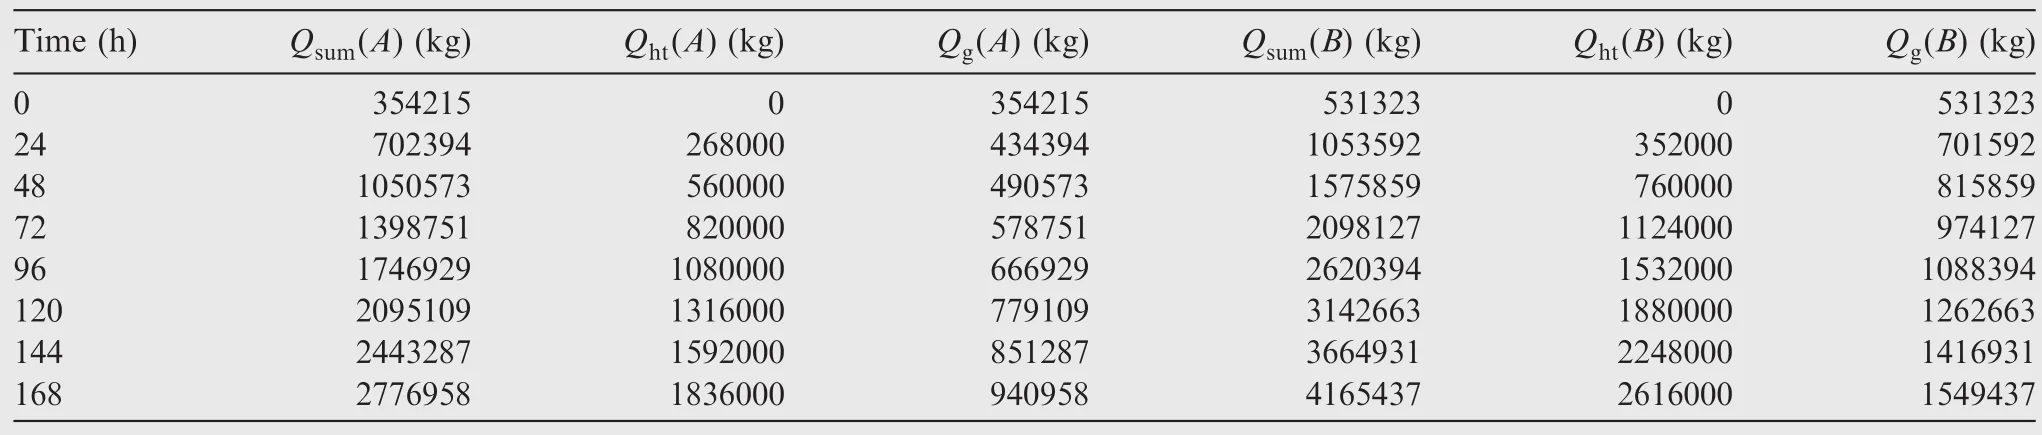
Table 5 Demand variation data over time.
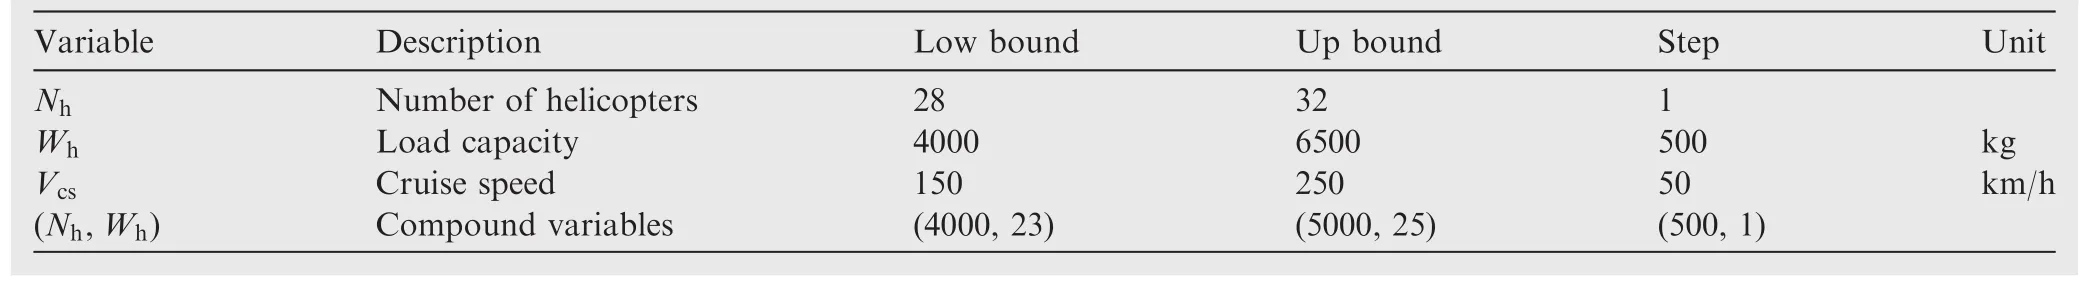
Table 6 Range and step of parameters.
5.2.Sensitivity analysis based on trade-off
The purpose of sensitivity analysis is to find a solution through changing some helicopter parameters if current helicopters are unable to finish mission in time.Before conducting the sensitivity analysis,decision-makers should first set the parameter range and the step length shown in Table 6.Then simulations are running repeatedly according to the range and step length in order to find a suitable value from the range.Fig.14 shows the sensitivity analysis results of different parameters.In Fig.14,the horizontal coordinate represents the time in h,and the longitudinal coordinate represents the gapQgin kg.
Fig.14(a)is the sensitivity analyses of the number of helicoptersN.Because the value of the gap in Fig.13 is too large,the range is set as 28–32.The results show that if the number of helicopters increases to 31,the demands of two disaster areas could be satis fied within 7 days.So a feasible solution is to request 11 more helicopters from other airports.
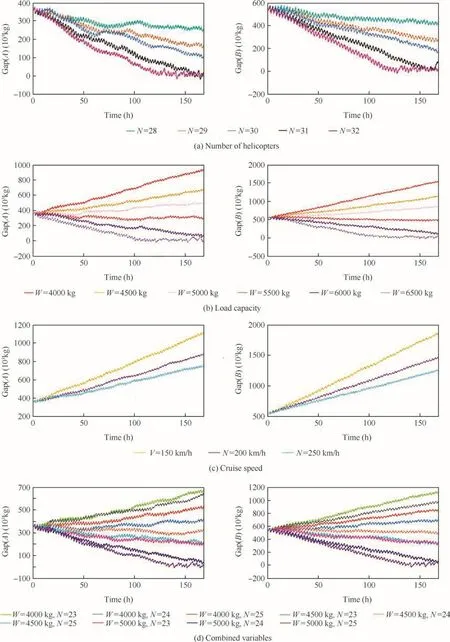
Fig.14 Sensitivity analysis of helicopter SC.
Fig.14(b)is the sensitivity analysis of load capacityW.From the curves,it can be seen that the mission effectiveness is very sensitive to load capacity.If load capacity reaches 6000 kg,the rescue operation is nearly accomplished in the 7th day.Moreover,if adding another 500 kg,the rescue operation can be accomplished in the 5th day.So decision-makers may consider choosing helicopters with a larger load capacity,such as 6000 kg,for rescue mission.
The sensitivity of cruise speedVis shown in Fig.14(c),from which it can be seen that increasing cruise speed bene fits mission effectiveness little,compared with number of helicopter or load capacity.The gap still gets bigger and bigger.Even if cruise speed increases to 250 km/h,the demands of disaster areas still cannot be satis fied.It is because the distance is not very long,so increasing speed cannot save much time.Thus,just increasing cruise speed may not solve rescue problem.
Fig.14(d)is the sensitivity analysis of the combination of number of helicopters and load capacity.It can be seen that if the number of helicopters reaches 25 and the load capacity reaches 5000 kg,the task will be completed within 6 days.It will be another solution to the helicopter rescue plan.Through the combination of different parameters,decision-makers can make a more flexible plan according to resources.
The sensitivity analysis are not limited to the three parameters above,and the impacts of some parameters of airport SC or disaster area SC are also worth a further study.Decisionmakers could get optimal solutions based on speci fic mission environment.
5.3.Bene fits of NUHYS
In the whole analysis process,NUHYS plays a signi ficant role in dealing with the complex helicopter rescue problem in earthquake relief.It not only helps decision-makers to architect and model helicopter rescue mission,but also provides a faster simulation and optimization speed.From the perspective of model complexities,NUHYS handles SoS problems through matching contributors with different modeling methods,which leads to a reasonable simpli fication of components.And it is necessary to apply NUHYS to simplify SoS model.For instance,if decision-makers want to create the model of disaster areas to gain the real-time demands,agent-based modeling and system dynamics are alternative.The former one is more accurate but needs more time and workload.As Zhang et al.23stated in their paper about earthquake rescue mission based on agents,the environment of disaster areas has an impact on helicopter rescue,so the terrain should be created.They emphasized that the modeling process was very dif ficult,thus the terrain was built by the game engine tool of Unity3D.Besides terrains,each survivor should be modeled as an agent.From related literatures,26–28it is easy to see that it is a much more complicated process to establish the behavior of survivors such as escaping,gathering and interaction and set their behavior rules logically.
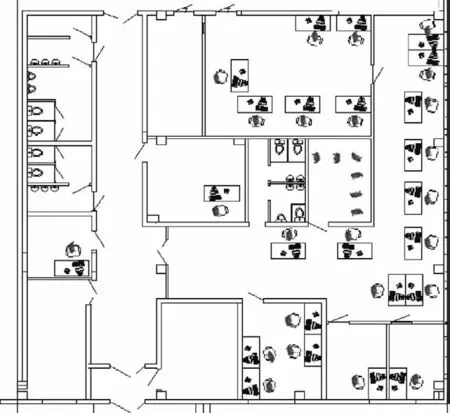
Fig.15 2D terrain of survivors.
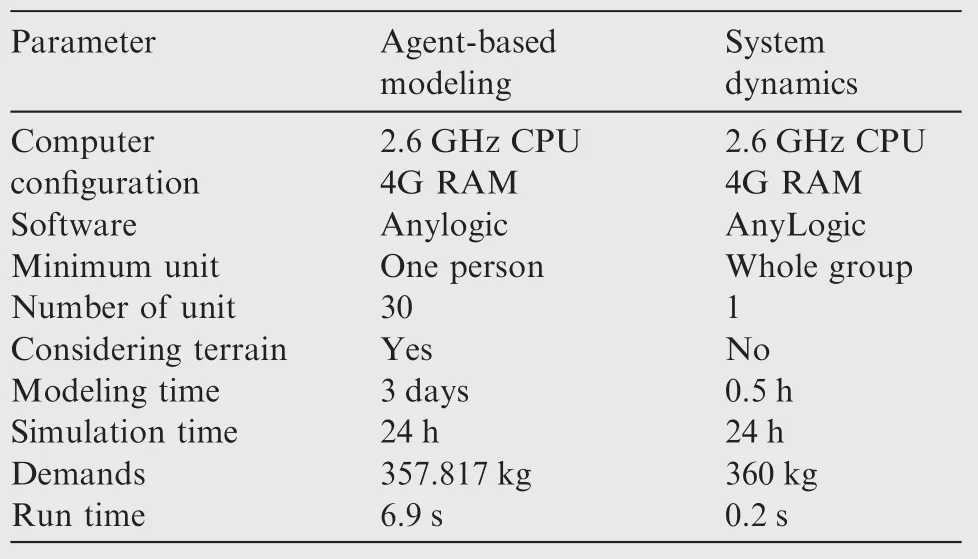
Table 7 Comparison between two methods.
However,according to the analysis of NUHYS,system dynamics is more appropriate to match this component.Here take 30 survivors that work in a company in disaster area SC as an example.Both the agent model and system dynamics model of the example are built in software AnyLogic in a personal computer with mainstream con figuration(2.6 GHz CPU,4G RAM).The 2D terrain is shown in Fig.15 and a comparison between the two methods is shown in Table 7.The results show that the demands of survivors in two models are almost the same.However,it is easy to see that it will take much more time and workload in modeling process based on agent-based modeling.And meanwhile the run time also becomes longer.So agent-based modeling is not suitable for this problem,especially when there are thousands of survivors in disaster areas.So in this paper,system dynamics is chosen as the modeling method of disaster areas based on NUHYS.The key purpose of the proposed approach is that more resources should be spent on the focus of SoS problem through matching contributors with appropriate modeling methods.
6.Conclusions
This paper gives detailed illustration of concept and three steps of NUHYS,i.e.,grouping contributors,categorizing contributors and matching contributors with modeling methods.Meanwhile,helicopter rescue in earthquake relief is taken as an example to verify the effectiveness of NUHYS in architecting and modeling flight vehicle focused SoS operations.
It could be seen that a core view of NUHYS is to build SC based on SoS architecture through analyzing the characteristics of an SoS operation and its contributors comprehensively.And then on the premise of not signi ficantly affecting the precision of the simulation model of the focused flight vehicle,each contributor is matched with the most suitable modeling method for optimal resource allocation to reduce the time and cost of M&S.
It is evident that NUHYS still needs continuous improvement.For instance,more modeling methods should be investigated and added to MCG,so that it can supply more abundant choices when matching contributors with modeling methods,as well as enable the application of NUHYS to more flight vehicle focused SoS operations.
Acknowledgement
This study was supported by the Research Project of Ministry of Industry and Information Technology of the People’s Republic of China.
1.Owens WA.The emerging US system-of-systems.Washington,D.C.:National Defense University press;1996.p.1–6.
2.Maier MW.Architecting principles for systems-of-systems.Syst Eng1998;1(4):267–84.
3.Carlock PG,Fenton RE.System of systems(SoS)enterprise systems engineering for information-intensive organizations.Syst Eng2001;4(4):242–61.
4.Manthorpe WH.The emerging joint system of systems:A systems engineering challenge and opportunity for APL.Johns Hopkins APL Tech Digest1996;17(3):305–10.
5.Lukasik SJ.Systems,systems of systems,and the education of engineers.AI EDAM1998;12(1):55–60.
6.Mane M,Crossley WA,Nusawardhana A.System-of-systems inspired aircraft sizing and airline resource allocation via decomposition.J Aircraft2007;44(4):1222–35.
7.Taylor C,de Weck OL.Integrated transportation network design optimization.47thAIAA/ASME/ASCE/AHS/ASCstructures,structural dynamics,and materials conference;2006 May 1–4;Newport(RI).Reston:AIAA;2006.p.1–16.
8.Nusawardhana A,Crossley WA.Allocating variable resources over a finite time horizon to combine aircraft sizing and airline planning.AIAA 5th aviation,technology,integration,and operations conference(ATIO);2005 Sep 26–28;Arlington(VA).Reston:AIAA;2005.p.1–15.
9.Crossley WA,Mane M,Nusawardhana.Variable resource allocation using multidisciplinary optimization:initial investigations for system of systems.10th AIAA/ISSMO multidisciplinary analysis and optimization conference;2004 Aug 30–Sep 1;Albany(NY).Reston:AIAA;2004.p.1–17.
10.Ranque P,Freeman D,Kernstine K,Lim D,Garcia E,Mavris D.Stochastic agent-based analysis of uav mission effectiveness.11th AIAA aviation technology,integration,and operations(ATIO)conference;2011 Sep 20–22;Virginia Beach(VA).Reston:AIAA;2011.p.1–15.
11.Biltgen PT.A methodology for capability-based technology evaluation for systems-of-systems[dissertation].Atlanta(GA):Georgia Institute of Technology;2007.p.177–87.
12.Frommer JB.System of systems design:Evaluating aircraft in a fleet context using reliability and non-deterministic approaches[dissertation].West Lafayette(IN):Purdue University;2012.p.54–56.
13.Mane M.Concurrent aircraft design and trip assignment under uncertainty as a system of systems problem[dissertation].West Lafayette(IN):Purdue University;2008.p.1–4.
14.de Laurentis D,Ayyalasomayajula S.Exploring the synergy between industrial ecology and system-of-systems to understand complexity:a case study in air transportation.J Ind Ecol2009;13(2):247–63.
15.de Laurentis D,Han EP,Kotegawa T.Network-theoretic approach for analyzing connectivity in air transportation networks.J Aircraft2008;45(5):1669–79.
16.de Laurentis D,Crossley WA,Mane M.Taxonomy to guide systems-of-systems decision-making in air transportation problems.J Aircraft2011;48(3):760–70.
17.de Laurentis D,Callaway RK.A system-of-systems perspective for public policy decisions.Rev Policy Res2004;21(6):829–37.
18.Talley DN,Mavris DN.Robust design method for a battlespace system of systems.49th AIAA/ASME/ASCE/AHS/ASC structures,structural dynamics,and materials conference;2008 Apr 7–10;Schaumburg(IL).Reston:AIAA;2008.p.1–16.
19.Of fice of the Deputy under Secretary of Defense for Acquisition and Technology,Systems and Software Engineering.Systems engineering guide for systems of systems.Washington,D.C.:Of fice of the Deputy under Secretary of Defense for Acquisition and Technology,Systems and Software Engineering;2008.p.47–54.
20.Wikipedia[Internet].Leafcutter ant.c2014[updated 2014 Dec 29;cited 2014 Dec 30].Available from:<http://en.wikipedia.org/wiki/Leafcutter_ant>.
21.Cole R.SoS architecture.In:Jamshidi M,editor.Systems of systems engineering:principles and applications.Boca Raton(FL):CRC Press;2008.p.37–8.
22.Kieckhafer K,Walther G,Axmann J,Spengler T.Integrating agent-based simulation and system dynamics to support product strategy decisions in the automotive industry.Proceedings of the 2009 winter simulation conference(WSC);2009 Dec 13–16;Austin(TX).Piscataway(NJ):IEEE;2009.p.1433–43.
23.Zang J,Liu H,Ni X.Earthquake rescue mission modeling based on multi-agent.TELKOMNIKA Indonesian J Electr Eng2014;12(4):2995–3000.
24.Wu L,Li Z,Wang Z,Li J,Liu C.Rapid assessment of earthquake disaster:with Yushu earthquake as an example.Sci Technol Rev2010;28(24):38–43[Chinese].
25.Peng M.System dynamics models of replenishment decision for reliefsupplies:based on the post-seismic environmentof Wenchuan earthquake[dissertation].Chengdu(Sichuan):University of Electronic Science and Technology of China;2012.p.89–90[Chinese].
26.Wagner N,Agrawal V.An agent-based simulation system for concert venue crowd evacuation modeling in the presence of a fire disaster.Expert Syst Appl2014;41(6):2807–15.
27.Was J,Lubas′R.Towards realistic and effective agent-based models of crowd dynamics.Neurocomputing2014;146:199–209.
28.Helio¨vaara S,Korhonen T,Hostikka S,Ehtamo H.Counter flow model for agent-based simulation of crowd dynamics.Build Environ2012;48:89–100.
 CHINESE JOURNAL OF AERONAUTICS2016年1期
- CHINESE JOURNAL OF AERONAUTICS的其它文章
- Plastic wrinkling prediction in thin-walled part forming process:A review
- Progress of continuously rotating detonation engines
- Microstructure control techniques in primary hot working of titanium alloy bars:A review
- A hybrid original approach for prediction of the aerodynamic coefficients of an ATR-42 scaled wing model
- Dynamic modeling and analysis of vortex filament motion using a novel curve- fitting method
- Boundary-layer transition prediction using a simpli fied correlation-based model