
Five-year plans,China finance and their consequences
2017-11-01 14:21DonghuaChenOliverZhenLiFuXin
Donghua Chen,Oliver Zhen Li,Fu Xin
aNanjing University,China
bNational University of Singapore,Singapore
cHohai University,China
Five-year plans,China finance and their consequences
Donghua Chena,*,Oliver Zhen Lib,Fu Xinc
aNanjing University,China
bNational University of Singapore,Singapore
cHohai University,China
A R T I C L E I N F O
Five-year plans Government engineering Industrial policies Corporate finance Economic growth China
An important factor influencing corporate finance and economic growth in China lies in its government sponsored industrial policies.Examining China’s five-year plans during 1991–2010,we find that state-owned firms in government supported industries enjoy faster growth in initial public offerings and higher offer prices.Further,they enjoy faster growth in loans granted by major national banks.However,this preferential access to capital by state-owned firms appears to be achieved at the expense of non-state-owned firms which are crowded out.Government support induces more investment but also brings more over investment,which mainly comes from the non-state sector.Finally,supported industries have higher stock market returns and cash fl ow growth that dampen when state ownership increases.
?2017 Sun Yat-sen University.Production and hosting by Elsevier B.V.This is an open access article under the CC BY-NC-ND license(http://creativecommons.org/licenses/by-nc-nd/4.0/).
1.Introduction
While the first three decades after the establishment of the communist China in 1949 were marred by political turmoil,instabilities,ideological rigidness and natural and human-made disasters,China’s economy hasbeen growing rapidly since the start of its economic reform in 1978.Its GDP reached about USD8.34 trillion(RMB51.93 trillion)in 2012(National Bureau of Statistics of China,2013),exceeding Japan to become the second largest economy in world in 2010.It currently has the largest foreign currency reserve in the world,reaching USD2.85 trillion in 2011,representing 30%of the global reserve(State Administration of Foreign Exchange,2011).China’s securities market was established just two decades ago.However,by the end of 2010,its total market capitalization reached USD4.01 trillion(RMB26.54 trillion),representing 66.69%of China’s GDP(China Securities Regulatory Commission,2011).By the end of 2012,its total capitalization was RMB22.97 trillion.
On the other end of the spectrum,China’s rapid economic growth appears to contradict and defy mainstream economic and finance theories.China is a highly politically centralized country.Its government has the power to nominate provincial and ministerial level officials and owns a significant portion of the national economy.China’s leaders have the authority to directly interfere with almost all aspects of China’s economic,civil,and political af f airs.China lacks the rule of law that is considered essential for the development of the capital markets(La Porta,Lopez-de-Silanes,Shleifer and Vishny,1997,1998,2002a).
Therefore,it is high time for us to re-recognize the important role played the government in economic development.After many countries failed in their attempt to become developed countries in the 1970s,many economists conclude that government interventions are detrimental.This view appears to be going to one extreme of the pendulum(Lin,2012).With the success of China’s economic reform,its government’s model of economic development has been receiving more and more attention,especially its ability for strategic economic planning(Sachs,2011;Stern,2011).We start from such a background and depict how the Chinese government,playing the role of a central planner,influences resource allocations in China’s capital markets and the consequences of such an influence.
We study official documents of China’s five-year plans and identify industries that the Chinese government emphasizes.We consider two financial markets,the equity market(initial and seasoned equity markets)and the bank loan market.If the government is effective in channeling resources to strategically important industries,then these industries should enjoy higher equity finance and bank loan growth.Further,corporate investment should be affected by the government’s national strategies.We also examine consequences of this government engineering to determine if five-year plans are at least partially responsible for China’s economic growth.If there is a positive association between the two,we conclude that government engineering is effective in spurring economic growth.1Of course,even if we fail to find a positive association,we still cannot dismiss government engineering as ineffective as external benefits that cannot be internalized within certain supported industries are often the basis of government policies.
A good knowledge of the heavy influence that China’s political system exerts on corporate finance is important for us to understand the myriads of economic and social activities of China and its business entities.We try to comprehend China’s corporate finance from the angle of its political superstructure and the interaction between the market mechanism and government control.This research can be useful in helping us understand the following issues:(1)Why can China,a country with such a severe degree of government interference,grow its economy consistently at a rapid pace over the last three decades?(2)What is the association between government engineering and corporate finance?(3)What are the consequences of government engineering?
Focusing on four of China’s strategic five-year national plans during 1991–2010,we find that government supported industries enjoy faster IPO growth.However,supported state-owned firms appear to crowd out non-stateowned firms.As the government controls the IPO approval and review mechanism,IPO resources are scarce and the government can exert a powerful influence on initial equity offerings.In the SEO market,the government’s control power is subdued due to an increase in market orientation.In the bank loan market,the government’s power is further subdued due to a further increase in market orientation.We find that the government’s influence exists mainly in loans granted by major national banks to state-owned firms.This pattern helps us understand the interactive effect of the government force and the market force in influencing resource allocations.
On the investment dimension,we find that supported industries invest more.This pattern is present in both the state and non-state sectors.However,non-state-owned firms appear to overinvest more in response to government support.This evidence is consistent with the fact that the Chinese economy is investment-driven and the momentum of investment mainly comes from the non-state sector(Barnett and Brooks,2006).
Finally,we examine the economic performance of the five-year plan national strategies.We find that government supported industries enjoy higher stock market returns and cash flow growth but these positive effects dampen when state ownership increases.However,government supported industries have a higher ratio of non-performing loans.
While results concerning industry stock returns,cash flow growth,and the ratio of non-performing loans are not entirely consistent with each other,they help us objectively evaluate the effect of government engineering on industry performance as five-year plans are complicated and multi-dimensional strategies.Industries consistent with government policies may generate external benefits that are difficult to internalize.A high level of non-performing loans in supported industries can be a price paid for these external benefits.However,the government can potentially internalize these external benefits.While to a certain industry,an increase in nonperforming loans hurts its individual interest,to the government,losses due to non-performing loans can be of f set by other ensuing benefits and therefore an industrial policy can still be rational.We show that supported industries have a higher level of non-performing loans but also higher stock returns and cash flow growth.This suggests that in formulating industrial policies,the government probably considers the balance between individual industries’interests and the society’s aggregate interest.This perspective helps us comprehend the coexistence of the prevalence of low efficiency industries and the rapid economic growth in China.
An important innovation of our study is that we focus on government engineered five-year plans which play an important role in China’s recent economic development and its people’s everyday life.It is important to note that even based on economists most critical of China’s economic development,its growth has so far been a sustained one.China’s experience can be useful to other late developing countries.
Allen et al.(2005)challenge the ‘‘law,finance and growth” paradigm by providing evidence of China’s economic growth under a backward system of law and finance.They examine the finance and growth of the state sector,the listed sector and the private sector and find that the more financially constrained private sector enjoys faster growth and support the possibility of informal financing or relationship-based financing.However,Ayyagari et al.(2010)compare China’s formal and informal financing channels and show that firms with access to formal financing channels grow faster than those that can only access informal channels,not supporting Allen et al.(2005).Allen et al.(2011)propose a substitutive mechanism in explaining China’s growth.They point out that at the early growth stage of a developing country,there could exist a dynamic and adaptive mechanism that is more effective than those in developed countries,such as a mature law and finance system.They do not provide evidence of this mechanism.Our logic is similar to Allen et al.(2005,2011).National industrial policies can be the substitutive mechanism proposed in Allen et al.(2011).We establish links among government engineering,finance,investment and performance,and potentially reconcile Allen et al.(2011,2005)and Ayyagari et al.(2010).
This paper proceeds as follows.Section 2 reviews the literature on the nexus among government,finance and economic growth.Section 3 describes China’s institutional settings and its five-year plan program.Section 4 discusses research questions.Section 5 describes data,research design and presents empirical results.Section 6 concludes.
2.Literature
Studying corporate finance in emerging and transitional economies,one needs to start from fundamentals such as these economies’cultures,histories,political and legal systems(Williamson,2000;Claessens et al.,2002).These systems are intertwined and influence each other in an ever-changing process of evolution.Issues such as corporate finance are born within these fundamental factors.Only through a good understanding of these fundamental factors can one gain a glimpse of how these factors combine to explain corporate finance and economic growth.
2.1.Political forces,the big push,catching up and the economy
The structure of a nation’s political system can affect how resources are allocated in the economy and the society(Olson,1965;Shleifer and Vishny,1994;Alesina and Rodrik,1994;Fisman,2001;La Porta et al.,2002b;Dinc,2005;Faccio,2006;Khwaja and Mian,2005;Sapienza,2004;Claessens et al.,2008;Perotti and Vorage,2008,2009).An important criterion for assessing the power of a political system is the government’s ability in playing a dominant role in resource allocations.During the early stage of the industrial revolution,governments of today’s developed European and North American countries all played a crucial role in building the economic system,in protecting private properties and in promoting trade(Adelman and Morris,1988).After the Second World War,with the resurrection of the post-war economy,the role governments play in nations’economic development was widely recognized.The economies of Japan,South Korea and the South-East Asian region took of f.Behind the South-East Asia Miracle are governments(World Bank,1993).However,during South-East Asia’s financial crisis in the middle of 1990s,the role of the government was criticized(Stiglitz and Yusuf,2001).Interestingly,when the 2008 global financial crisis hit,the debate was reignited on the limited role that the market mechanism could play in resource allocations.Governments stepped forward to save their financial markets and researchers start to reevaluate the role of the government.
Since the start of its economic reform in 1978,China has realized more than 30 years of rapid economic growth.Even though this growth is not gained without problems such as pollutions,corruptions and inefficiencies,it still represents a major achievement and helps enhance China’s prestige and lift hundreds of millions of people out of abject poverty.Brandt and Rawski(2008)call this ‘‘China’s Great Economic Transformation”.Economic growth of developing nations often cannot be simplistically viewed from a free market perspective.
Murphy et al.(1989)propose a model of industrialization for under-developed countries.They point out that a premise for industrialization in South-East Asian economies such as South Korea is the governmentinitiated coordinated investment strategies in various industries.Trindade(2005)use the big push theory in open economies and explains how Taiwan and South Korea’s industrialization is achieved under their governments’export oriented schemes.Governments can act as the engine of economic growth.China is probably doing this on a massive scale due to the size of its economy and the power of its government.
China’s contemporary history of humiliation(since its defeat in the First Opium War against the British Empire,1839–1842)and foreign domination has created a yearning for catching up among its people and leaders.A prosperous and powerful country can defend its people’s properties,rights and dignities.To many Chinese people,the biggest threat to property rights may come from external forces and not from within.External threats are associated with a nation’s backwardness.Economic development is an important premise for rights protection.
The reason that the catching up strategy can be successful partially lies in the fact that developed countries’experience of success and failure reduces the information cost of national strategic decision-making and partially lies in the fact that governments can reduce transaction cost.To a certain extent,more advanced countries serve as an experimental ground for all sorts of technologies,systems,ideals and philosophies.If the catching up strategy is successful,the biggest beneficiaries are governments as they can enhance their legitimacy of ruling.
A less developed country may have to start from simple imitation if it strives to catch up with more advanced countries.China is no exception.China’s catching up economic development strategy has gone through three stages:catching up based on a simple imitation of the completely planned economy of the former Soviet Union;catching up based on the comparative advantage strategies driven by both the government and the market;and catching up based on system innovation.Currently,China is transforming from the second stage to the third stage.This is the technological background of today’s China.
Transforming is difficult.As a poor developing country,China formulated a catching up strategy by developing heavy industries after its establishment in 1949.As this strategy was inconsistent with China’s natural endowment and technology at that time,economic growth was slow.After the start of the economic reform in 1978,the government changed the national strategy of developing heavy industries to the more advantageous labor intensive industries and realized rapid economic growth(Lin et al.,1994).The Chinese government runs the country like a giant corporation.To enhance economic efficiency and create a competitive environment,it supports key industries(the so-called lifeline or pillar industries),it creates state-owned firms aimed at realizing government’s multiple goals,and it tilts financial resources towards preferred industries and state-owned firms.Stern(2011)calls this framework of economic development ‘‘China’s Superior Economic Model”.
Above said,we are not to deny that the market economy is potentially the most important and effective mechanism in resource allocations.For late developing countries,however,due to the lack of a mature market system,many industries that can contribute to the whole economy cannot be properly developed due to a high level of transaction cost.Governments can emerge to reduce the transaction cost and thus their role has economic rationale.This is especially true in China as more than two thousand years of ruling by the elite greatly reduces the mass’s resistance to this model of development.
2.2.Formal versus informal financing
Allen et al.(2005)show that the economic growth of China,especially the rapid growth of its private sector in an environment with weak property rights protection and a weak financial system,suggests the existence of some form of alternative financing channels and governance mechanism.Ayyagari et al.(2010),using opinion surveys of 2400 Chinese firms,investigate the effects of formal and informal financing channels on firm performance.They claim that their analysis does not support Allen et al.’s(2005)hypothesis of the importance of alternative financing channels.In fact,firms receiving formal financing significantly outperform firms using informal financing.Guariglia et al.(2011)investigate the effect of internal financing channels on firm growth.They find that among firms facing restrictions on external financing,those with ample free cash flows grow faster.They suggest that developing countries do not necessarily need a highly developed external financing market to warrant rapid economic growth.Note that Ayyagari et al.(2010)and Guariglia et al.(2011)are not necessarily in conflict with Allen et al.(2005).It is not difficult to imagine that even in the presence of informal and internal financing channels,formal financing can be more effective.
The above studies suggest that financing channels,for example,the presence of and the reliance on informal financing or internal financing,in developing countries such as China,are fundamentally different from those of developed countries.We argue for another dimension of financing in China,that is,government engineering.Government industrial policies,to a large extent,can exert a heavy influence on whether firms obtain finance to realize their growth opportunities.This perspective potentially enriches corporate finance theories for developing countries.From a certain perspective,our research extends Ayyagari et al.(2010)as we potentially explain why firms receiving formal financing significantly outperform firms using informal financing.When formal financing channels are heavily influenced by governments’industrial strategies, firms receiving government support can crowd out firms not receiving government support.This logic helps us understand conditions under which formal,informal and internal financing channels interact and impact firm performance.Formal finance is important to government supported industries.In non-supported industries,informal or internal finance potentially plays a bigger role.Therefore,our research helps us better assess Allen et al.(2005),Ayyagari et al.(2010)and Guariglia et al.(2011).
2.3.Political connections and corporate finance
The corporate finance literature has accumulated a vast reservoir of evidence on how political connections in fluence governance, fi nance,investment and firm performance.Shleifer and Vishny(1994)propose a model of government control and show that political connections bring about excess employment,low efficiency and corruption(Stigler,1971;Peltzman,1976;Kornai,1979;McChesney,1987;De Soto,1990).Researchers often fi nd that non-state-owned firms are more efficient than state-owned firms which naturally have political connections and that the privatization of state-owned firms often brings efficiency gains(Kikeri et al.,1992;Megginson et al.,1994;Sun and Tong,2003).Further,political connections increase the risk of government rent-seeking and property rights exploitation(Agrawal and Knoeber,2001;Hadlock et al.,2002;Helland and Sykuta,2004;Faccio,2006).Due to this risk, firms with political connections under-perform non-connected firms(Fan et al.,2007).
On the other hand,political connections can bring bene fi ts to connected firms.Backman(1999)and Dinc(2005)show that the government brings bene fi ts to firms with political connections through its control of banks.De Soto(1990) fi nds that political connections bring about tax bene fi ts.Fisman(2001)provides evidence that the health condition of Indonesia’s former president Suharto a ff ects the value of firms connected to him.Faccio’s(2006)international study shows that high level executives who enter politics bring bene fi ts to their firms.However,these bene fi ts are often obtained through wealth redistribution and rather than through wealth creation.That is,politically connected firms establish unfair competition and exploit other firms to create gains for themselves.In sum,most of the studies on political connections suggest that political connections negatively impact overall resource allocations.
Political connections are not necessarily the original purposes of policy-makers.If the effect of political connections is universally negative,then where does the economic growth of many developing countries,including China,come from?If,among some developing countries,governments’economic planning is effective to a certain extent,will this of f er an explanation for the widespread government interference of economic af f airs?It is possible that political connections are merely a by-product of government-led economic development.Foregoing economic development to avoid these by-products may not be a desired solution.
Further,allow us to raise the research stake a little higher by thinking about the causality of the above issues.Will this help us explain why small government-large market countries are mostly developed countries while large government-small market countries are often developing countries?What is the causal relation between these?It is possible that a shrinking government is a result of economic development rather than that economic development is a result of a small government,and that the nexus between law and finance is more important in developed countries(King and Levine,1993;Levine and Zervos,1998;Rajan and Zingales,1998;La Porta et al.,1997,1998,2002a;Demirgu¨c?-Kunt and Maksimovic,1998;Levine,1999;Beck and Levine,2002)while the link between the government and finance fits developing countries better.
3.China and its five-year national plan program
3.1.Political control system
China is a highly politically centralized country.It has thirty-four provinces,direct administrative cities,or minority autonomous regions.It has twenty-nine ministries,333 prefecture-level governments,2858 countylevel governments and over 40,000 township-level governments(China Statistical Yearbook,2010).This system employs about 10 million people.However,the control power of such a large organization resides with the Politburo of the Central Committee of the Communist Party of China(CCCPC).The Politburo is the supreme decision-making organization.The State Council and ministries below it convert national policies into executable government policies.This political control system functions through appointments,promotions,rotations and cross-postings of government officials(Huang,2002).
3.2.Banking and finance
After its establishment in 1949,communist China adopted a policy of financial repression(McKinnon,1973).Four major state-owned banks(Industrial and Commercial Bank of China,Bank of China,China Construction Bank and Agricultural Bank of China)dominate the banking system(Allen et al.,2005).During 1949–1990,the securities markets were non-existent.
China’s stock market was established in 1990(Shenzhen and Shanghai Exchanges),originating from the ideal of‘‘crossing the river by feeling the rocks”.2‘‘If it turns out to be good,we will do it.If it turns out to be bad,we will shut it down.We can try this.” (Deng Xiaoping’s(former Chinese President)talk during excursions to China’s southern cities).However,the government tightly controls the stock market.To facilitate market development,in October 1992,the State Council established the Securities Commission of the State Council as a regulatory authority of all securities businesses and the Securities Regulatory Commission as the monitoring authority of the Securities Commission of the State Council.In 1998,State Council reform merged these two organizations into the China Securities Regulatory Commission(CSRC)directly under the State Council.It is the counterpart to the SEC of the U.S.All chairmen of the CSRC came from high level government officials.Before becoming CSRC chairmen,they were State Council secretariats or general managers of the People’s Bank of China(China’s central bank),or even Politburo members of the highest decision-making organization.This way,China’s central government effectively controls the securities regulatory authority and therefore realizes its goal of policy promotions.
Since 1992,the IPO and SEO of f ering processes have experienced several reforms.3For China’s regulations on IPOs,please refer to Kao et al.(2009).For China’s regulations on rights offerings,please refer to Chen and Yuan(2004).A major trend is the transition from an approval system to a review system.Of course,the monitoring mechanism for IPOs and SEOs has not been fundamentally changed.Though CSRC adopted a review system for IPOs and SEOs in 2004,in practice,both stock exchanges still use an approval system.4Based on CSRC’s official interpretation(Chi Bin,2011)(Source:http://www.qgcy.org/show.asp?id=3519).From CSRC’s official documents governing IPOs and SEOs,a common criterion for equity of f erings is that ‘‘they are consistent with the national industrial policies”.
Based on the above discussion of China’s political control system,we have reasons to believe that China’s central government can fulfill its policy goals through its effective political control system and tilts financial resources towards supported industries.
3.3.Origin of five-year plans
Five-year plans originated from the former Soviet Union.On November 22,1926,at the seventh expansionary conference of the Executive Committee of the Communist International,Joseph Stalin stated the doctrine that‘‘The socialist economy is the most centralized economy.The socialist economy should progress based on plans.” (Complete Works of Stalin,People’s Publishing House,China,1954).Based on his socialist economic philosophy,inDecember1927,attheFifteenth CongressoftheAll-UnionCommunistParty(Bolsheviks)ofthe former Soviet Union,Stalin further developed his doctrine of centralized and planned socialist economy.Under his guidance,the former Soviet Union adopted highly concentrated and all-encompassing economic plans.The Sixteenth Congress of the All-Union Communist Party approved the 1928–1932 national economic plan.This signaledthebirthoffive-plansintheformerSovietUnion.Bythetimeitcompletedthesecondfive-yearplan,the former Soviet Union had become the largest economy in Europe and the second largest economy in the world.
3.4.China’s five-year plans
As early as 1928,the government of the Republic of China started drawing plans for economic growth,for example,the fundamental industry-building plan in 1928 and the five-year plan for heavy industries(1935)(Wu,2013,p.164).These plans were interrupted by the Japanese invasion of China during 1937–1945.However,the 1928–1937 is considered a golden ten-year period in contemporary Chinese economic history with an average annual industry growth of 8.7%(Fairbank,1994).
After the communist government took over the country in 1949,China went through three years of economic recovery.In 1953,China started its first five-year plan covering 1953–1957.The focus of the First Five-Year Plan was ‘‘developing heavy industries” (People’s Daily,1953).Since 1953,China has implemented eleven five-year plans.Year 2011 marked the first year of the Twelfth Five-Year Plan.5The twelve five-year plans are:First Five-Year Plan(1953–1957),Second Five-Year Plan(1958–1962),Third Five-Year Plan(1966–1970),Fourth Five-Year Plan(1971–1975),Fifth Five-Year Plan(1976–1980),Sixth Five-Year Plan(1981–1985),Seventh Five-Year Plan(1986–1990),Eighth Five-Year Plan(1991–1995),Ninth Five-Year Plan(1996–2000),Tenth Five-Year Plan(2001–2005)and Eleventh Five-Year Plan(2006–2010)and Twelfth Five-Year Plan(2011–2015).Note that due to the three-year famine in 1959–1961,the Third Five-Year Plan was delayed by three years and the economy went through a period of adjustment.
Before the start of the economic reform in 1978,due to a lack of statistical data and technical expertise,Chinese government’s capabilities of formulating five-year plans were limited.This was especially true during the Great Leap Forward and the Cultural Revolution periods.Plans were often interrupted or the goals were set unrealistically high,causing a spate of problems or even disasters during implementation.In fact,during 1949–1978,China focused on socialist ideologies,politics,power struggle,‘‘the revolution”,and not on economic development.
Since the start of the economic reform in 1978,China’s economy has gradually moved to an increasingly market-oriented system.The government’s abilities in managing economic and social af f airs also improve.Starting from the Sixth Five-Year Plan formulated during 1981–1982,the procedure has become more and more formalized.By the end of the last year of the current five-year plan period,the Politburo will convene a session to discuss and propose recommendations for the next five-year plan.Based on these recommendations,the State Council will formulate outlines for making the plan.After its approval in the next year’s National People’s Congress,the new five-year plan is finalized.
China’s Eighth Five-Year Plan(1991–1995)ref l ected reform philosophies of Deng Xiaoping’s ‘‘Talks during Excursions to China’s Southern Cities”.It is a relatively special five-year plan.6Early 1992,Deng Xiaoping gave talks in Wuchang,Shenzhen,Zhuhai,Shanghai and other cities.These talks are historically summarized as ‘‘Deng Xiaoping’s Talks during Excursions to China’s Southern Cities”.During this period,Deng proposed many bold ideas and smashed conservative thinking in economic development at that time.These ideas include: ‘‘More audacious reform”, ‘‘The difference between socialism and capitalism does not lie in more planned economy or more market economy.”,‘‘Planned economy does not equal socialism as capitalism also has plans.Market economy does not equal capitalism as socialism also has markets.”After Deng talks,the central committee adjusted the Eighth Five-Year Plan on dimensions such as the pace of economic reform,industrial structure,the use of foreign investment,import and export,scale of investments,etc.Based on Deng’s ‘‘threestep” strategy,the government formulated the Eighth Five-Year Plan and the long-term ten-year(1991–2000)scheme(Deng,1993;Chinese Communist Party Central Committee,1987).7Deng Xiaoping proposes a three-step formula for China’s modernization development,reflecting long-term strategies for China’s economic reform.First step,GDP in 1990 should double that in 1981 to cover people’s basic needs.Second step,from 1991 to the end of the twentieth century,GDP should double again.Third step,by the middle of the twenty- first century,GDP per capita should reach that of medium developed countries.The government also sought advices from various strata of the society.
The formulation of the Ninth Five-Year Plan(1996–2000)started in September 1995.Based on achievements and experience of the Eighth Five-Year Plan,the Chinese government also proposed long-term goals for the year 2010.At the same time,China’s economy weathered through the 1997 Asian financial crisis and progressed towards its goals.The average annual GDP growth was 8.3%during the Ninth Five-Year Plan period.In 2000,GDP reached RMB8.94 trillion(exceeding USD1 trillion).Average per capita GDP reached USD856(National Bureau of Statistics of China,2001).
The Tenth Five-Year Plan(2001–2005)was formulated during a period when China’s overall economic situation was relatively good.By that time,GDP has exceeded USD1 trillion.The situation of consumer goods shortage was largely eliminated and a consumer market began to take shape.The formulation of the Tenth Five-Year Plan was different from that of previous ones.First,the planning committee listened to suggestions from international organizations such as the World Bank.8Early 1999,World Bank was entrusted by the National Development and Planning Committee to provide recommendations on China’s Tenth Five-Year Plan and the 2015 long-term scheme.World Bank produced ‘‘China’s Intermediate Economic Transition:Several Issues Related to Economic Development in the Tenth Five-Year Plan”.This document contained 21 reports and provided valuable views on China’s economic development and reform(World Bank,2000)Second,based on the national plan,specialized plans and regional plans were also made.
As the importance of five-year plans on people’s standard of living and national development became more apparent,the formulation process also became more democratic and transparent.Many people from different social strata participated in the formulation of the Eleventh Five-Year Plan(Jiang,2006).For example,the National Development and Reform Committee was made up of experts from various different government departments and organizations.Further,comments and suggestions were taken from members of the National People’s Congress,National Political Consultative Congress,the Eleventh Five-Year Plan Expert Committee,political and military organizations,the so-called democratic parties,representatives from provinces,direct administrative cities and minority autonomous regions.The State Council also held four conferences to listen to comments and advices.
The Twelfth Five-Year Plan,which started in 2011 and which is not covered in this study,is markedly different from previous ones.It contains more intangible themes such as sustainable growth,moving up the value chain,reducing income disparities,improving citizens’lives,enhancing scientific development,education,urbanization,environmental protection,energy efficiency and domestic consumption(Chinese Communist Party Central Committee,2010;KPMG,2011).It signals a crucial stage in China’s reform and transition.
Five-year plans have exerted a profound influence on China’s national economy and social life.They provide guidance for major projects and help fulfill government’s goals.An important objective of five-year plans is guidance for various industries,that is,industrial policies.Compared with the completely free market economy and the completely planned economy,five-year plans ref l ect a mixture of the two and are a manifestation of China’s pragmatism.
4.Research questions
4.1.Five-year plans and corporate finance
An important method for realizing government industrial strategies is the creation of preferential financing opportunities.This method can also encourage more firms to enter supported industries until the marginal benefit equals the marginal cost.In China,both the equity market and the loan market are,to a varying degree,controlled by the central government.The government has the review and approval rights of initial and seasoned equity of f ering applications.The government can further control the equity market through its personnel control system.For example,the chairman of the CSRC is named by the State Council.Finally,major banks are state-owned.Therefore,the capital markets are capable of carrying out government’s industrial policies.We predict that firms in government supported industries have a larger chance of obtaining equity finance and bank loans.
State-owned firms play an important role in carrying out government strategies.The government’s control over state-owned firms is obviously stronger than its control over non-state-owned firms.Further,supporting state-owned firms can also enlarge the base of state ownership and build a foundation for carrying out the next strategy.In a way,preserving state-ownership potentially helps the government carry out national strategies.Therefore,out of strategic considerations as well as profit motives,government strategies are more tilted towards industries with a high concentration of state ownership.Of course,state-owned firms are also likely more willing to carry out national strategies.We predict that state ownership enhances supported industries’ability to obtain financing opportunities.
4.2.Five-year plans and corporate investment
China’s economic growth is largely investment driven.The proportion of investment in GDP growth exceeds 30%(Barnett and Brooks,2006).Therefore,how government policies af f ect corporate investment is an important empirical question.Since the 2008 financial crisis,China’s economy has received a lot of attention,especially its level of investment.In an investment-driven economy,supported industries will need to use investment to realize their growth.We predict that government supported industries invest more than nonsupported industries.
4.3.Five-year plans and industry performance
We cannot avoid a discussion and an examination of the association between government engineering and industry performance.However,this is a tricky issue.The literature appears to believe that government interference brings about resource allocation distortion and inefficiency(Fan et al.,2007;Morck,Yavuz and Yeung,2011).This certainly is a viable proposition.However,distortion and inefficiency cannot be entirely measured in short-run economic or financial terms.For example,a government may be willing to enter industries that have low short-term profit prospects or even no profit prospects at all but are deemed strategic or vital to the national interest or have long-term prospects.Therefore,relatively short-run inferior economic or fi nancial outcome associated with government engineering should not necessarily be viewed as distortional or inefficient.Further,even in economic or fi nancial terms,government engineering may not necessarily be associated with inefficiency.The Chinese economy has been growing rapidly in the last three decades.It would be hard to imagine that the government has been doing this all wrong and economic growth is primarily driven by firms in non-supported industries.
Based on the above,there are two potentially opposing explanations of this tricky issue.We treat it as an empirical question and examine whether government engineering,as manifested in fi ve-year plans,is associated with superior or inferior industry performance.We consider three measures of performance,stock performance(a market measure),growth in cash flow(an accounting measure)and the ratio of nonperforming loans.Of course,we hasten to admit,and to avoid contradicting our discussion earlier,that relying on the capital markets for evaluating five-year plans is narrowly focused.Five-year plans af f ect many aspects of the economy and we capture just a part of the picture by focusing on the capital markets.
5.Data and empirical analyses
5.1.Data
We hand-collect actual reports of four five-year plans by the Chinese central government during 1991–2010,covering the Eighth(1991–1995),Ninth(1996–2000),Tenth(2001–2005)and Eleventh(2006–2010)Five-Year Plans.We analyze the content of their ‘‘industry schemes” to determine government supported industries.Listed firms’industry classifications are based on the ‘‘Index for Listed Firms’Industry Classifications” published by the China Securities Regulatory Commission(CSRC)in 2001 and ‘‘Guideline#6 of Listed Firms’Conduct of Businesses– Modified Industry Classifications” published in 2007.Classifications for industrial firms are based on ‘‘Classifications and Code Standards of National Economic Industries” – National Standards(Guo Biao)GB/T4754 published by the National Bureau of Statistics of China in 1983 and the more recently revised ‘‘National Industry Classifications” GB/T4754-2002 published in 2003.
Data for Chinese listed firms come from(Research Set)RESSET for IPO and SEO data covering 1991–2010 and(China Stock Market Trading Database)CSMAR for bank loan data covering 1996–2010.Annual reports of China’s banking industry are hand-collected.We examine the industry distribution of nonperforming loans.We hand-collect China Statistical Yearbooks to obtain industry economic growth data.
5.2.Capturing government engineering
In order to evaluate the government’s influence on the national economy and the capital markets,we collect five-year plan government documents(see Appendix A).These reports include:‘‘Guidelines for the national economy and social development ten-year scheme and the Eighth Five-Year Plan of the People’s Republic of China” (Fourth Plenum of the Seventh Conference of the National People’s Congress,April 9,1991),‘‘Guidelines for the national economy and social development Ninth Five-Year Plan and goals beyond year 2010 of the People’s Republic of China” (Fourth Plenum of the Eighth Conference of the National People’s Congress,March 17,1996),‘‘Guideline for the national economy and social development Tenth Five-Year Plan of the People’s Republic of China” (Fourth Plenum of the Ninth Conference of the National People’s Congress,March 15,2001)and ‘‘Guideline for the national economy and social development Eleventh Five-Year Plan of the People’s Republic of China” (Fourth Plenum of the Tenth Conference of the National People’s Congress,March 14,2006).
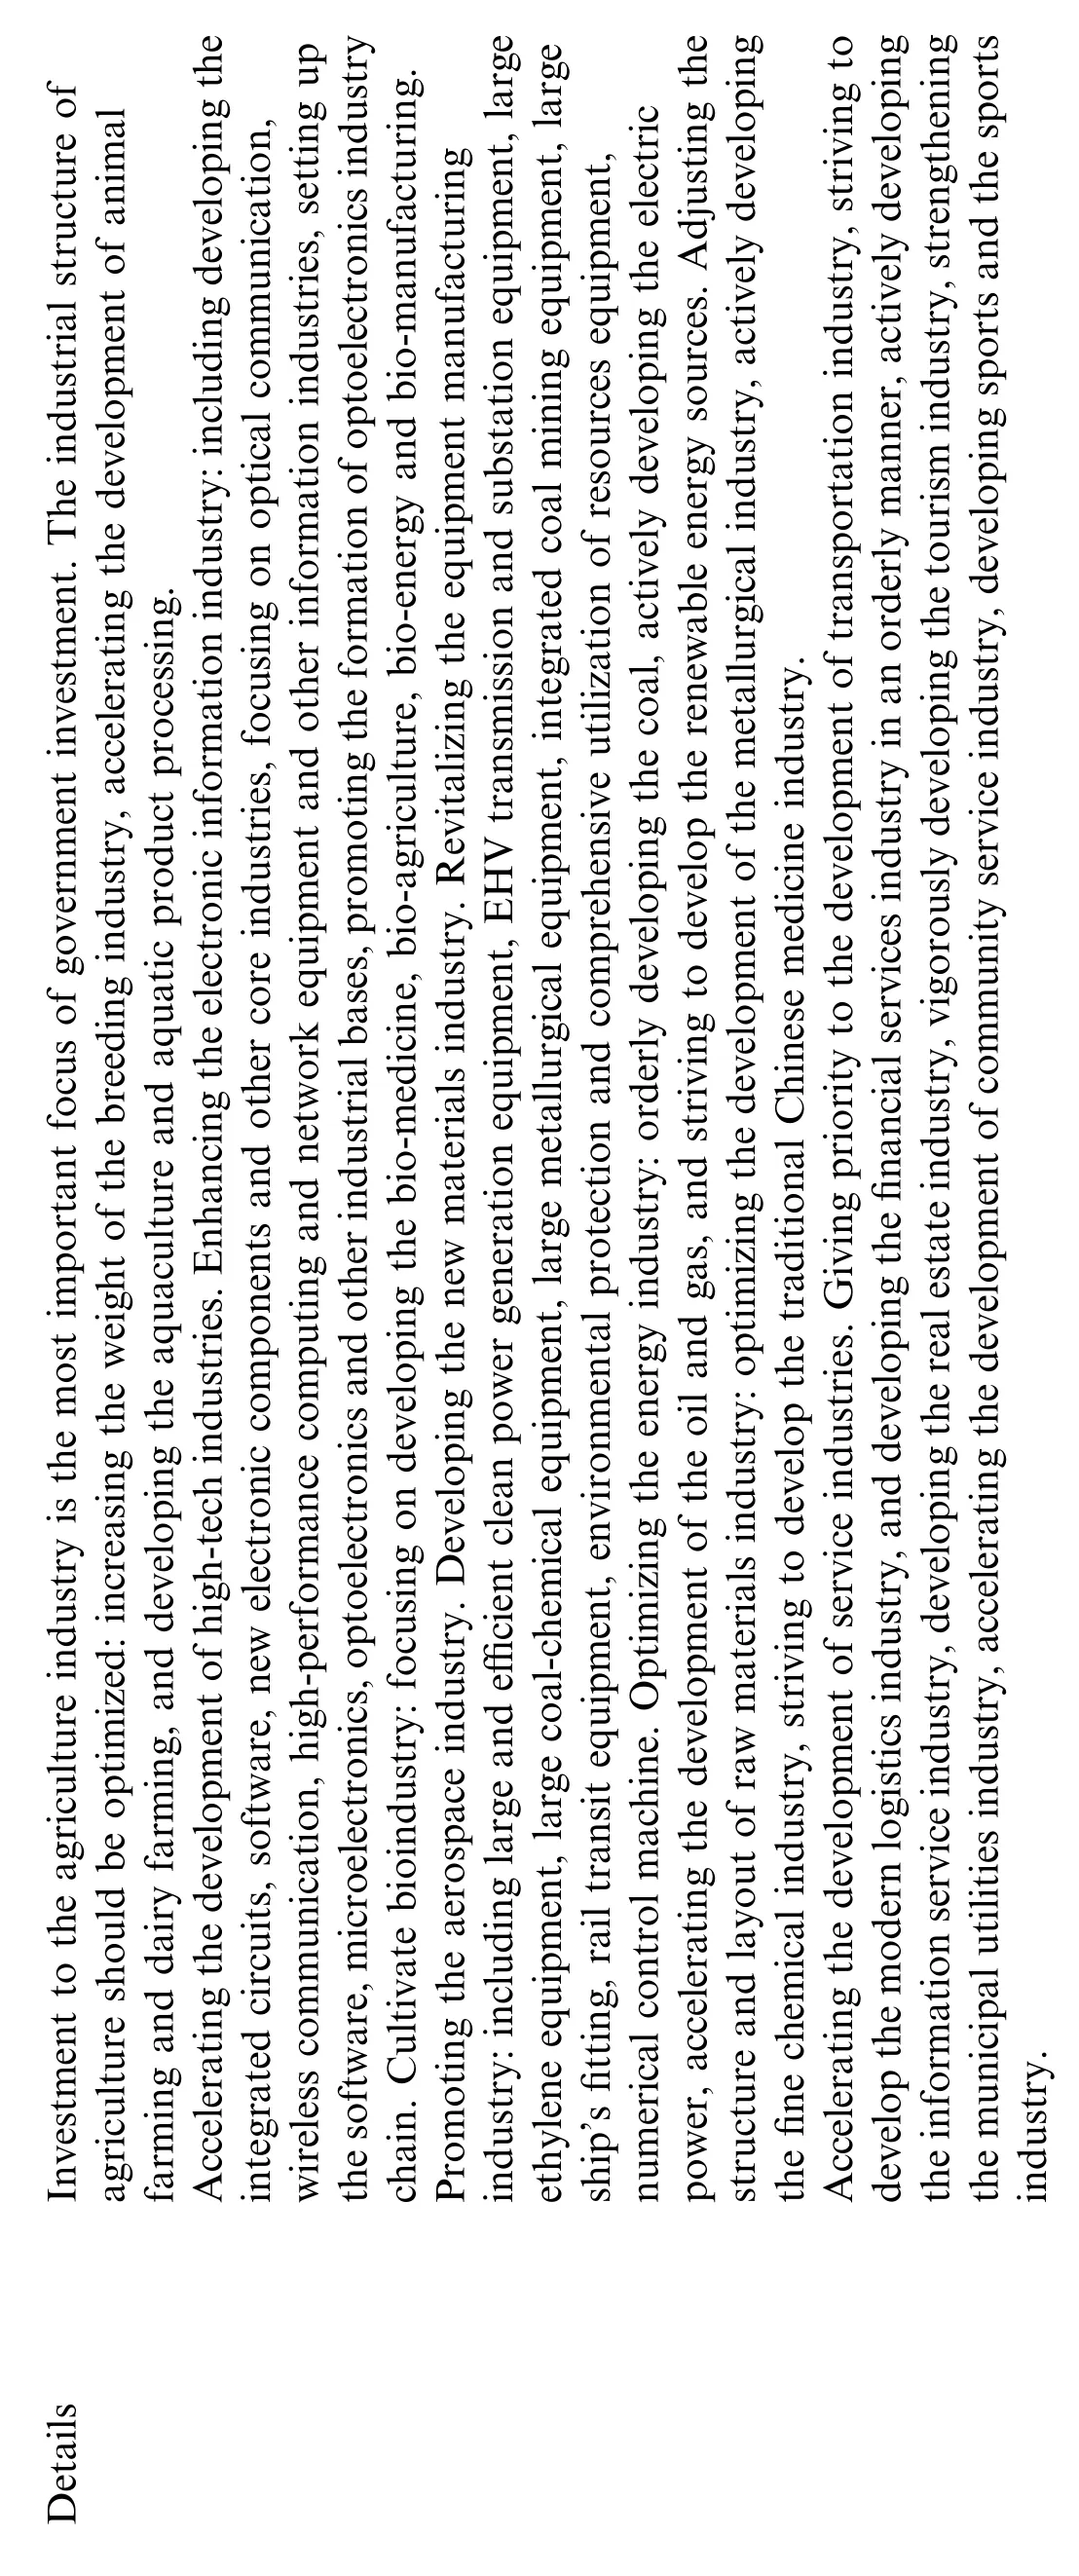
These documents detail plans for China’s industrial deployment during the next five years.For example,the third chapter of the Eighth Five-Year Plan contains ‘‘goals and policies for the development of major economic sectors during the Eighth Five-Year Plan”.It covers several industries,such as agriculture and the agricultural economy,hydroelectric industry,energy industry,transportation and postal communication industry,raw materials industry,geological survey and atmospheric industry,electronic industry,machinery manufacturing industry,national defense industry and national defense research and development,and textile industry,etc.For each industry,these reports explicitly point out the goals and directions of that industry during the next five years as well as measures to achieve these goals.From these documents,we identify keywords that determine government supported industries.We define an industrial policy variable IP that equals 1 if an industry is supported by the government in the current five-year plan period,and 0 otherwise.
5.3.Growth in finance
5.3.1.IPO/SEO
Since the establishment of two stock exchanges in 1990,China now has 1718 listed firms and a total amount of raised capital of RMB3662 billion(China Statistics Yearbook,2010).We are interested in how the govern-
ment engineered industrial policies affect corporate finance.We follow Rajan and Zingales(1998)but use industry and five-year plan combinations as units.Specifically,we aggregate amounts raised in(the frequency of)IPOs/SEOs for a specific industry during a five-year plan period.

Table 1 Sample Selections for Equity Finance(IPOs/SEOs)and Bank Loan Finance.

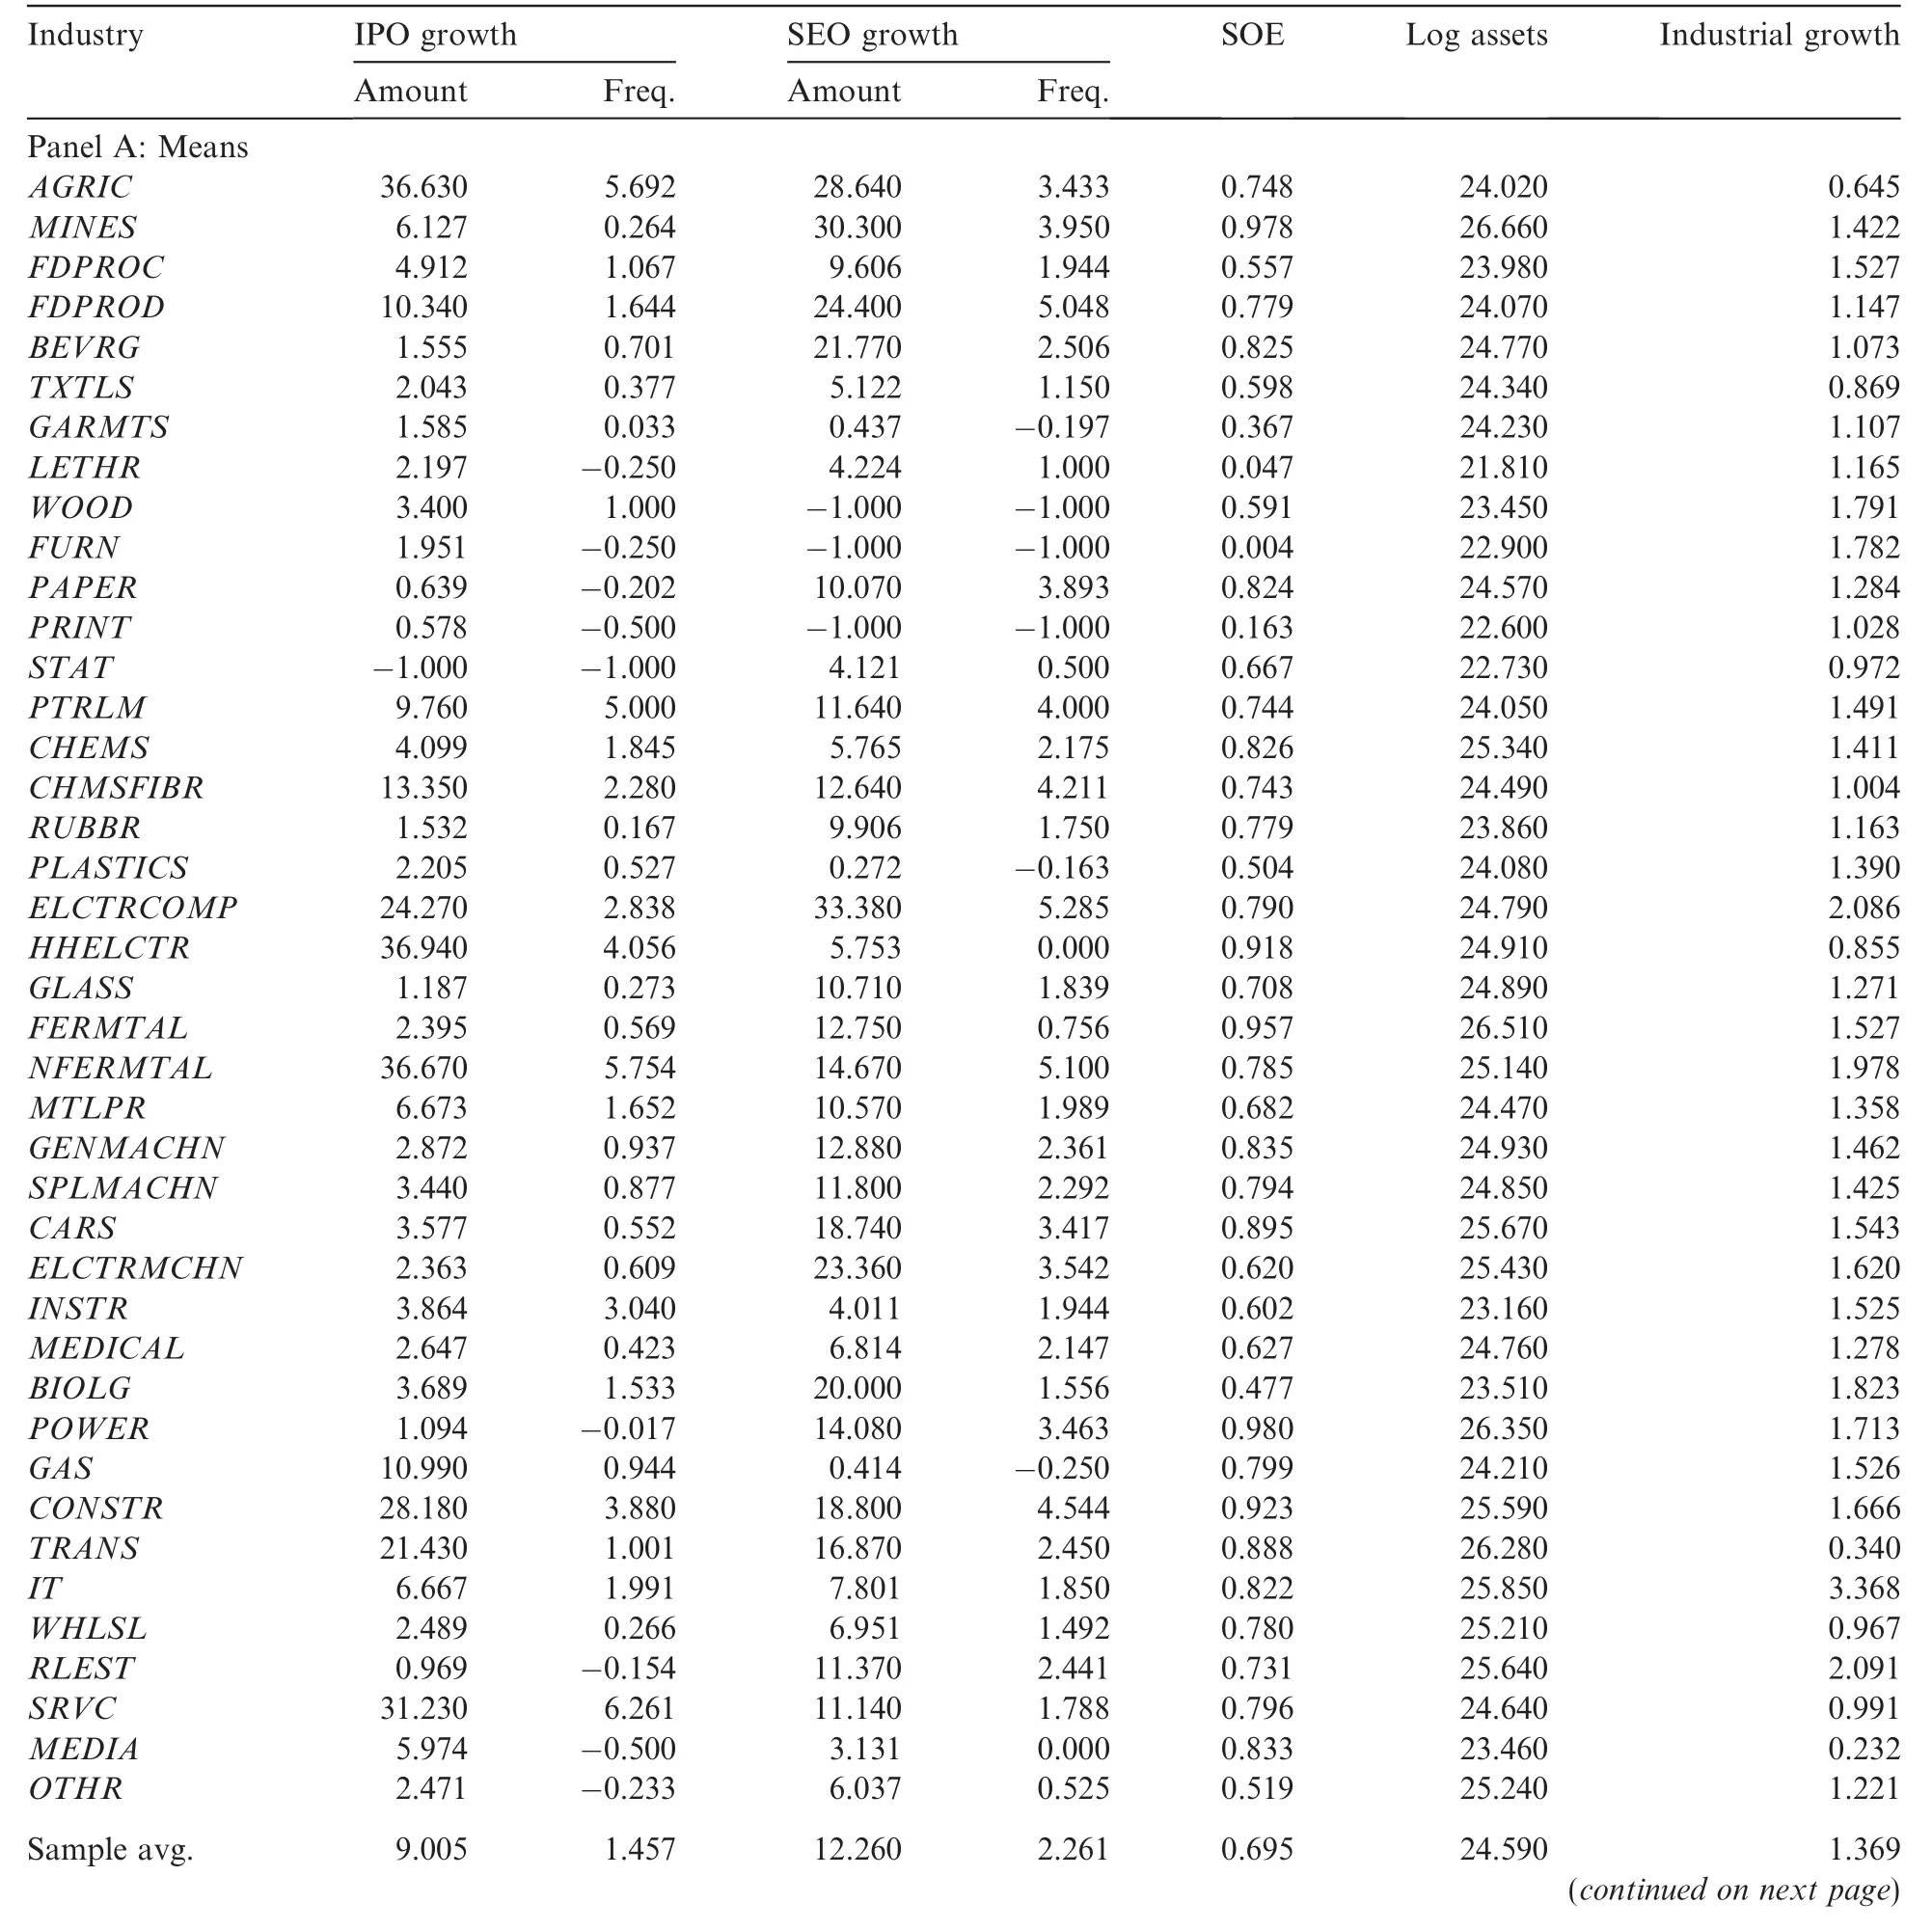
Table 3 Equity Finance Activities and Five-Year Plans.The growth rate of IPO/SEO total amount(number)during Five-Year Plan t(compared with the previous five-year plan)for Industry j:Growth in IPO amount,(SumIPOjt-SumIPOjt-1)/SumIPOjt-1;Growth in IPO frequency,(NumIPOjt-NumIPOjt-1)/NumIPOjt-1;Growth in SEO amount,(SumSEOjt-SumSEOjt-1)/SumSEOjt-1;Growth in SEO frequency,(NumSEOjt-NumSEOjt-1)/NumSEOjt-1,where Sum indicates IPO/SEO amount and Num indicates IPO/SEO number.SOE is the value-weighted ratio of state ownership enterprises over the public firms.Growthjtis the growth rate for industry j in during the tth five-year plan based on China Statistical Yearbook,log(Assets)jtis the logarithm transformation of Industry j’s median total assets,P10_5jtand P11_5jtare indicators that equal 1 for the Tenth and Eleventh Five-Year Plans and 0 otherwise,respectively.

Table 3(continued)
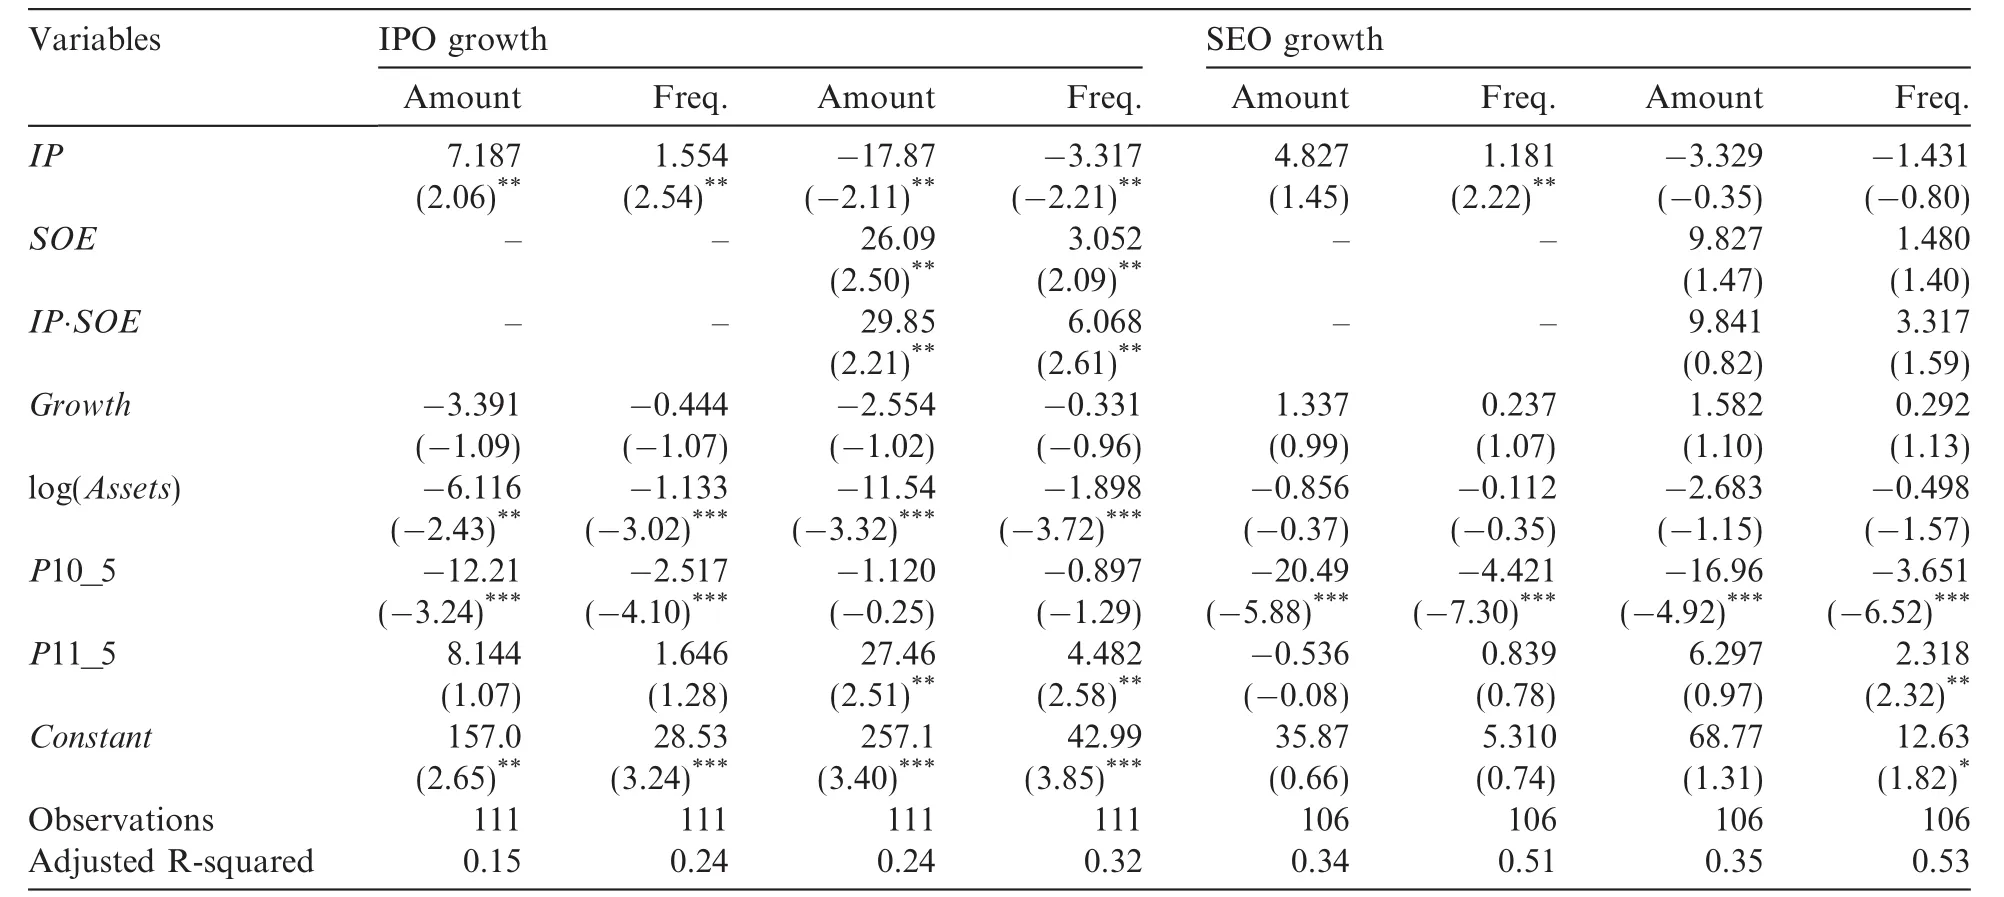
Table 4 Regressions of Equity Finance Activities and Five-Year Plans.Industrial policy IPjtequals 1 if Industry jis supported by the government in Five-Year Plant,and 0 otherwise.The growth rate of IPO/SEO total amount(number)during Five-Year Plan t(compared with the previous five-year plan)for Industry j:Growth in IPO amount,(SumIPOjt-SumIPOjt-1)/SumIPOjt-1;Growth in IPO frequency,(NumIPOjt-NumIPOjt-1)/NumIPOjt-1;Growth in SEO amount,(SumSEOjt-SumSEOjt-1)/SumSEOjt-1;Growth in SEO frequency,(NumSEOjt-NumSEOjt-1)/NumSEOjt-1,where Sum indicates IPO/SEO amount and Num indicates IPO/SEO number.SOE is the valueweighted ratio of state ownership enterprises over the public firms.Growthjtis the growth rate for industry j in during the tth five-year plan based on China Statistical Yearbook,log(Assets)jtis the logarithm transformation of Industry j’s median total assets,P10_5jtand P11_5jt are indicators that equal 1 for the Tenth and Eleventh Five-Year Plans and 0 otherwise,respectively.
We compute the growth rate of IPO/SEO in total amount(number)during Five-Year Plan t(compared with the previous five-year plan)for Industry j.We define four variables:Growth in IPO amount,(SumIPOjt-SumIPOjt-1)/SumIPOjt-1; Growth in IPO frequency, (NumIPOjt-NumIPOjt-1)/NumIPOjt-1;GrowthinSEO amount,(SumSEOjt-SumSEOjt-1)/SumSEOjt-1;GrowthinSEO frequency,(NumSEOjt-NumSEOjt-1)/NumSEOjt-1,where Sum indicates IPO/SEO amount and Num indicates IPO/SEO number.We estimate the following regression to determine if government industrial policies affect corporate finance:

where Growthjtis the growth rate for Industry j in during the tth Five-Year Plan based on China Statistical Yearbook,log(Assets)jt-1is the logarithm transformation of Industry j’s median total assets,P10_5jtor P11_5jtis an indicator that equals 1 for the Tenth or the Eleventh Five-Year Plan,and 0 otherwise.If the coefficient on IPjtis positive,then we have evidence that government industrial policies,as reflected in five-year plans,influence the equity finance market.
Panels A and B,Table 1 report sample selections for IPOs and SEOs,respectively.Table 2 shows that the total IPO amount is RMB1421.04 billion and the total SEO amount is RMB1779.66 billion during 1991–2010.The Extractive industry(MINES)and the Transportation and Warehousing industry(TRANS)are the two biggest recipients of equity finance opportunities.
Panel A,Table 3 shows the industry distribution of IPO/SEO growth.Overall,the average IPO growth in amount(growth in frequency)is 9.005(1.457).The average SEO growth in amount(growth in frequency)is 12.260(2.261).In terms of IPO growth in amount,the Household Electronic Appliances industry(HHELCTR)has the highest growth of 36.940,followed by the Smelting and Pressing of Nonferrous Metals industry(NFERMTAL)of 36.760 and the Agriculture industry(AGRIC)of 36.630.The industry with the highest growth in IPO frequency is the Social Services industry(SRVC)of 6.261,followed by the Smelting and Pressing of Nonferrous Metals industry(NFERMTAL)and the Agriculture industry(AGRIC).
Overall SEO growth in amount(growth in frequency)is 12.260(2.261).The industry with the highest SEO growth in amount(growth in frequency)is the Electronic Components Manufacturing industry(ELCTRCOMP),33.380(5.285).Using total assets as weights,the proportion of state-ownership is 69.5%,suggesting that the state occupies a dominant place in the capital markets.The Electric Power,Steam and Hot Water industry(POWER)has the highest level of state-ownership,98.0%,followed by the Extractive industry(MINES),97.8%.Therefore,state ownership is dominant in traditional industries and utilities.
Panel B,Table 3 compares IPO and SEO growth for supported and non-supported industries.All differences are insignificant.Regression results for IPOs and SEOs are reported in Table 4.Each observation is an industry-five-year-plan combination.Consistent with our expectation,in government supported industries,the growth of IPOs(in terms of amount and frequency)is higher than that in other industries.The coefficient on IP is positive and significant(7.187,t=2.06 for growth in IPO amount;1.554,t=2.54 for growth in IPO frequency).The coefficient on industrial policy IP is higher for IPO amount than that for IPO frequency,suggesting that the IPO amount grows even faster,consistent with the government’s intention of supporting these industries.The growth in SEO frequency is also higher in government supported industries than that in other industries.The coefficient on IP is 1.181(t=2.22).
When comparing the results for IPOs and SEOs,we find that the effect of industrial policies is stronger for IPOs than for SEOs,suggesting that government’s ability in implementing industrial policies is likely stronger in the initial offering market than in the secondary market.This is consistent with the fact that the role played by the government in reviewing and approving of IPOs is larger than that of SEOs.SEO firms already have obtained the listing status and the market force plays a larger role in them.Further,regulatory authorities are more careful dealing with initial offerings than with secondary offerings.As for an already listed firm,its SEO application time and cost are usually shorter or lower than those of an IPO firm.In addition,SEO firms often need to attract new investors through good performance.This is a more market-oriented mechanism.The role of the government in influencing SEOs is reduced(as compared with IPOs)as the market force becomes stronger.
State ownership is very important in China’s economy.Using shareholder data from CCER,we compute the proportion of state ownership for each industry,SOE,to determine whether a high level of state ownership enables supported industries to obtain equity finance more easily.We estimate the following regression:

If the coefficient on IPjt.SOEjtis positive,we have evidence that national strategies are more tilted towards the state-owned sector or the state-owned sector is more responsive to national strategies.
Results are reported in Table 4.In the IPO regressions,when SOE and IP.SOE are added,the coefficients on IP.SOE are positive and significant(29.85,t=2.21 using amount;6.068,t=2.61 using frequency),suggesting that state-owned firms in supported industries enjoy more IPO opportunities.However,the coefficients on IP become negative and significant(-17.87,t=-2.11 using amount;-3.317,t=-2.21 using frequency).This result suggests that state-owned firms may have crowded out non-state-owned firms in terms of IPO financing in supported industries.The coefficients on SOE are positive and significant(26.09,t=2.50 using amount;3.052,t=2.09 using frequency),suggesting that state-owned firms always enjoy better IPO opportunities.In the SEO regressions,with the addition of SOE and IP.SOE,IP,SOE and IP.SOE are all insignificant.Again,it appears that the results for SEOs are weaker than those for IPOs.
Apart from IPO growth,we also examine a measure of the cost of equity financing,IPO underpricing.The higher is the level of underpricing,the higher is the cost of equity financing as initial shares are sold at a lower price.Although IPO underpricing captures only one aspect of the cost of equity capital,it is a reasonable and easy indicator for the ease or the difficulty of obtaining equity capital.
We construct two measures of underpricing.IR is the average initial return during Five-Year Plan t for Industry j and IR_W is the size-weighted initial return during Five-Year Plan t for Industry j,where initial return is computed as(IPO first day closing price-IPO offer price/IPO of f er price).We replace IPO Growth and SEO Growth with IR or IR_W in Models(1)and(2).Results are presented in Table 5.When we do not consider state-ownership,the coefficients on IP are both insignificant.When we add SOE and IP.SOE,the coefficients on IP.SOE are both negative and significant(-1.096,t=-1.83 using IR;-1.319,t=-2.26 using IR_W).Further,when IR_W is used,the coefficient on IP becomes positive and significant(0.739,t=1.81).Therefore,state-owned firms in government supported industries are able to sell their initial shares at higherprices,again indicating the relative ease that state-owned firms in supported industries have in obtaining equity capital.

Table 5 Regressions of IPO Underpricing and Five-Year Plans.Industrial policy IPjtequals 1 if Industry j is supported by the government in Five-Year Plan t,and 0 otherwise.IR(IR_W)is the average(weighted)initial return during Five-Year Plan t for Industry j,computed as(close price at IPO-offering price/offering price).Growthjtis the growth rate for industry j in during the tth five-year plan based on China Statistical Yearbook,log(Assets)jtis the logarithm transformation of the industry median of assets,P11_5jtis an indicator that equals 1 for the Eleventh Five-Year Plan and 0 otherwise,respectively.
5.3.2.Bank loans
Allen et al.(2005)investigate four important financing channels when Chinese firms invest in fixed assets:domestic bank loans,self-financing,state budget and foreign direct investment.They point out that domestic bank loans are the most important channel.We therefore investigate the effect of industrial policies on bank loans.We follow Foos et al.(2010)to compute growth in bank loans for an industry.We also hand-collect information on the lead banks of these loans.According to Allen et al.(2005),China’s banking industry is mainly occupied by four major state-owned banks.We therefore divide banks into two categories:Big4 state-owned banks(Industrial and Commercial Bank of China,Bank of China,Agricultural Bank of China and Bank of Construction)and non-Big4 banks.9Interestingly,the names of these Big4 state-owned banks all reflect flavors of industrial policies.We further divide the sample into loans with collaterals and loans without collaterals.We estimate the following regression separately for big-four banks and nonbig-four banks with and without collaterals.

If the coefficient on IPjtis positive,we have evidence that government industrial policies,as reflected in fiveyear plans,influence the bank loan market.Panel C,Table 1 shows the sample selection process for bank loans.
Based on an earlier discussion of China’s political control system,China’s control of its financial system is an integral part of its political control system.For example,the chairmen of the Industrial and Commercial Bank of China and the Bank of China were members of the Sixteenth and Seventeenth Chinese Communist Party Central Committees.They,being a part of the political control system,certainly behave differently from other bank executives.Among many differences,an important one is the ability and the intent to carry out national policies.Therefore,we expect to observe differences between the Big4 national banks and non-Big4 banks.The Big4 national banks are more likely to carry out national policies.
From descriptive statistics in Table 2,we observe evidence that China’s bank loan market is mainly headed by national banks(Allen et al.,2005).Among the 2467 bank loans(RMB598.52 billion),RMB238.24 billion are attributable to the Big4 national banks and RMB360.28 billion are attributable to other banks(including national banks such as China Development Bank and Bank of Communication).The Big4 national banks account for 39.80%of the loan market,suggesting that they have a scale advantage over other banks.We also see that the Big4 national banks and non-Big4 banks differ in clienteles.Among the Big4 banks,the industry receiving the most loans is the electric power,steam and hot water production and supply industry(POWER),a total of RMB65.30 billion.This industry is mainly represented by national monopolies.The second clientele group is the real estate industry(RLEST),representing RMB34.05 billion.Non-Big4 banks have only about a half of that amount in these industries.The Big4 national banks’monopolistic power is high in traditional industries and high-profit industries.
Panel A,Table 6 presents basic information on bank loan growth.Panel B,Table 6 compares bank loan growth between supported and non-supported industries.It appears that supported industries have a significantly higher level of loan growth than non-supported industries and this pattern mainly occurs in loans initiated by Big4 banks.
Table 7 reports regression results on bank loan growth.Again,each observation is an industry-five-yearplan combination.In Panel A based on the full sample,we find that loan growth is affected by industrial polices.The coefficient on IP is positive and significant(6.168,t=2.07 using loan amount).
Next,we consider the role of state-ownership by estimating the following regression:

However,with the addition of SOE and IP.SOE,the coefficients on IP,SOE and IP.SOE are all insignificant.
In Panel B,Table 7,we perform our analysis based on combinations of Big4,non-Big4 banks and loans with and without collaterals.For loans issued by Big4 banks,before we introduce SOE and IP.SOE,onlythe coefficient on IP for loans with collaterals in amount is significant(2.303,t=2.07).After we introduce SOE and IP.SOE,the coefficients on IP are negative and significant(-6.600,t=-2.25 in amount with collaterals;-2.999,t=-1.72 in frequency without collaterals;-4.863,t=-1.71 in amount without collaterals).The coefficients on IP.SOE are positive and significant(14.113,t=2.75 in amount with collaterals;8.351,t=2.16 in frequency without collaterals;9.525,t=1.94 in amount without collaterals).Therefore,for loans initiated by Big4 banks,government engineering benefits state-owned firms while crowding out non-stateowned firms.However,this pattern does not exist in loans initiated by non-Big4 banks.Overall,it appears that Big4 banks are more likely to grant policy-oriented loans.
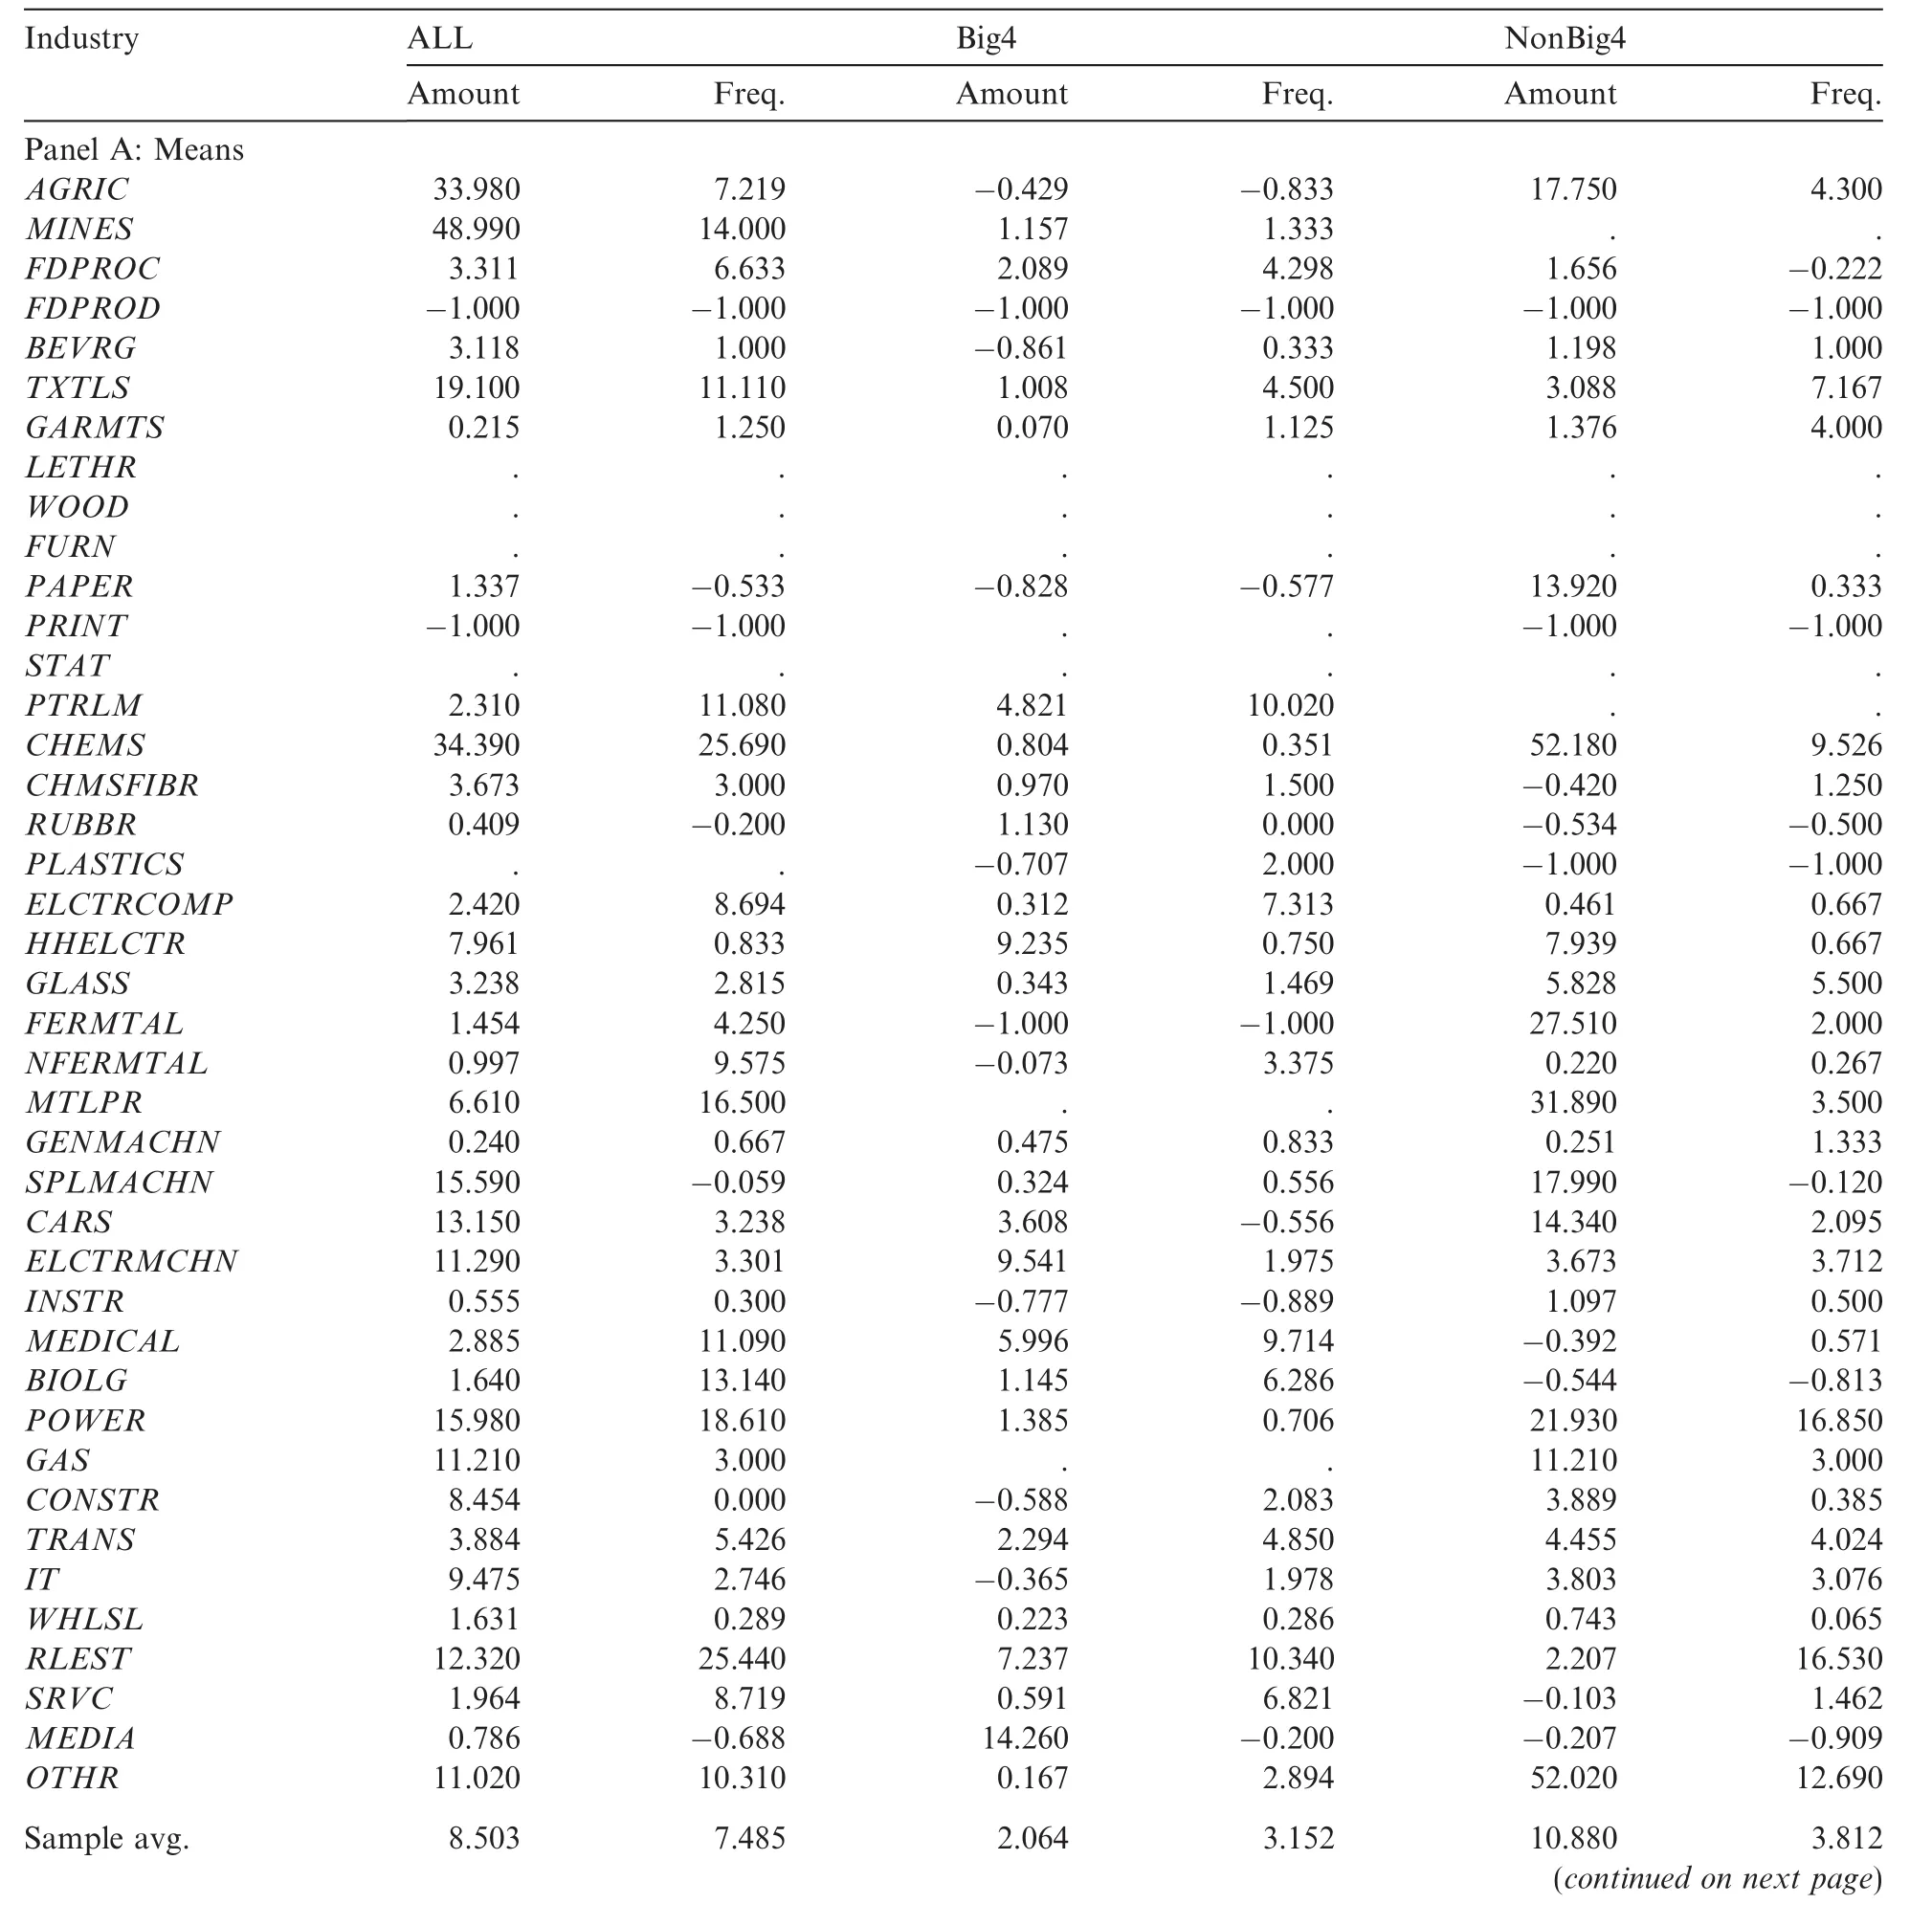
Table 6 Bank loan growth and five-year plans.Industrial policy IPjtequals 1 if Industry j is supported by the government in Five-Year Plan t,and 0 otherwise.The growth rate of Loan total amount(number)during Five-Year Plan t(compared with the previous five-year plan)for Industry j:Growth in Loan amount,(SumLoanjt-SumLoanjt-1)/SumLoanjt-1;Growth in Loan frequency,(NumLoanjt-NumLoanjt-1)/NumLoanjt-1.Growth in Loan(ALL)is from both Big4 national banks and Non-big4 national banks.Growth in Loan(Big4)is from collateral and non-collateral loans issued by Big4 national banks.Growth in Loan(NonBig4)is from collateral and non-collateral loans issued by Non-Big4 national banks.Growth in Loan(Big4/Collateral)is from collateral loans issued Big4 national banks.Growth in Loan(Big4/Non-Collateral)is from non-collateral loans issued Big4 national banks.Growth in Loan(NonBig4/Collateral)is from collateral loans issued by NonBig4 national banks.Growth in Loan(NonBig4/Non-Collateral)is from non-collateral loans issued by NonBig4 national banks.
5.4.Investment
Based on the above analyses of the IPO,SEO and the bank loan markets,it is natural to consider and determine whether financing opportunities spur investment.This is especially important as China’s economy is investment-driven.We define new investment INEWjtas ITOTALjt-IMAINTENANCEjt(Richardson,2006),where ITOTALis measuredas cash payments for fixed assets,intangible assets,and other long-term assets from the cash fl ow statement,scaled by beginning total assets.This definition of ITOTALis equivalent to capital expenditure used in US-based studies.IMAINTENANCEis measured as depreciation and amortization,scaled by beginning total assets.All observations are industry- five-pear plan combinations.We estimate the following regression:

We use the average value of investment for all firms in the industry.All other variables are as defined earlier.If the coefficient on IPjtis positive,we have evidence that supported industries invest more than non-supported industries.
To determine investment efficiency,we also measure overinvestment following Richardson(2006)and estimate the following regression:

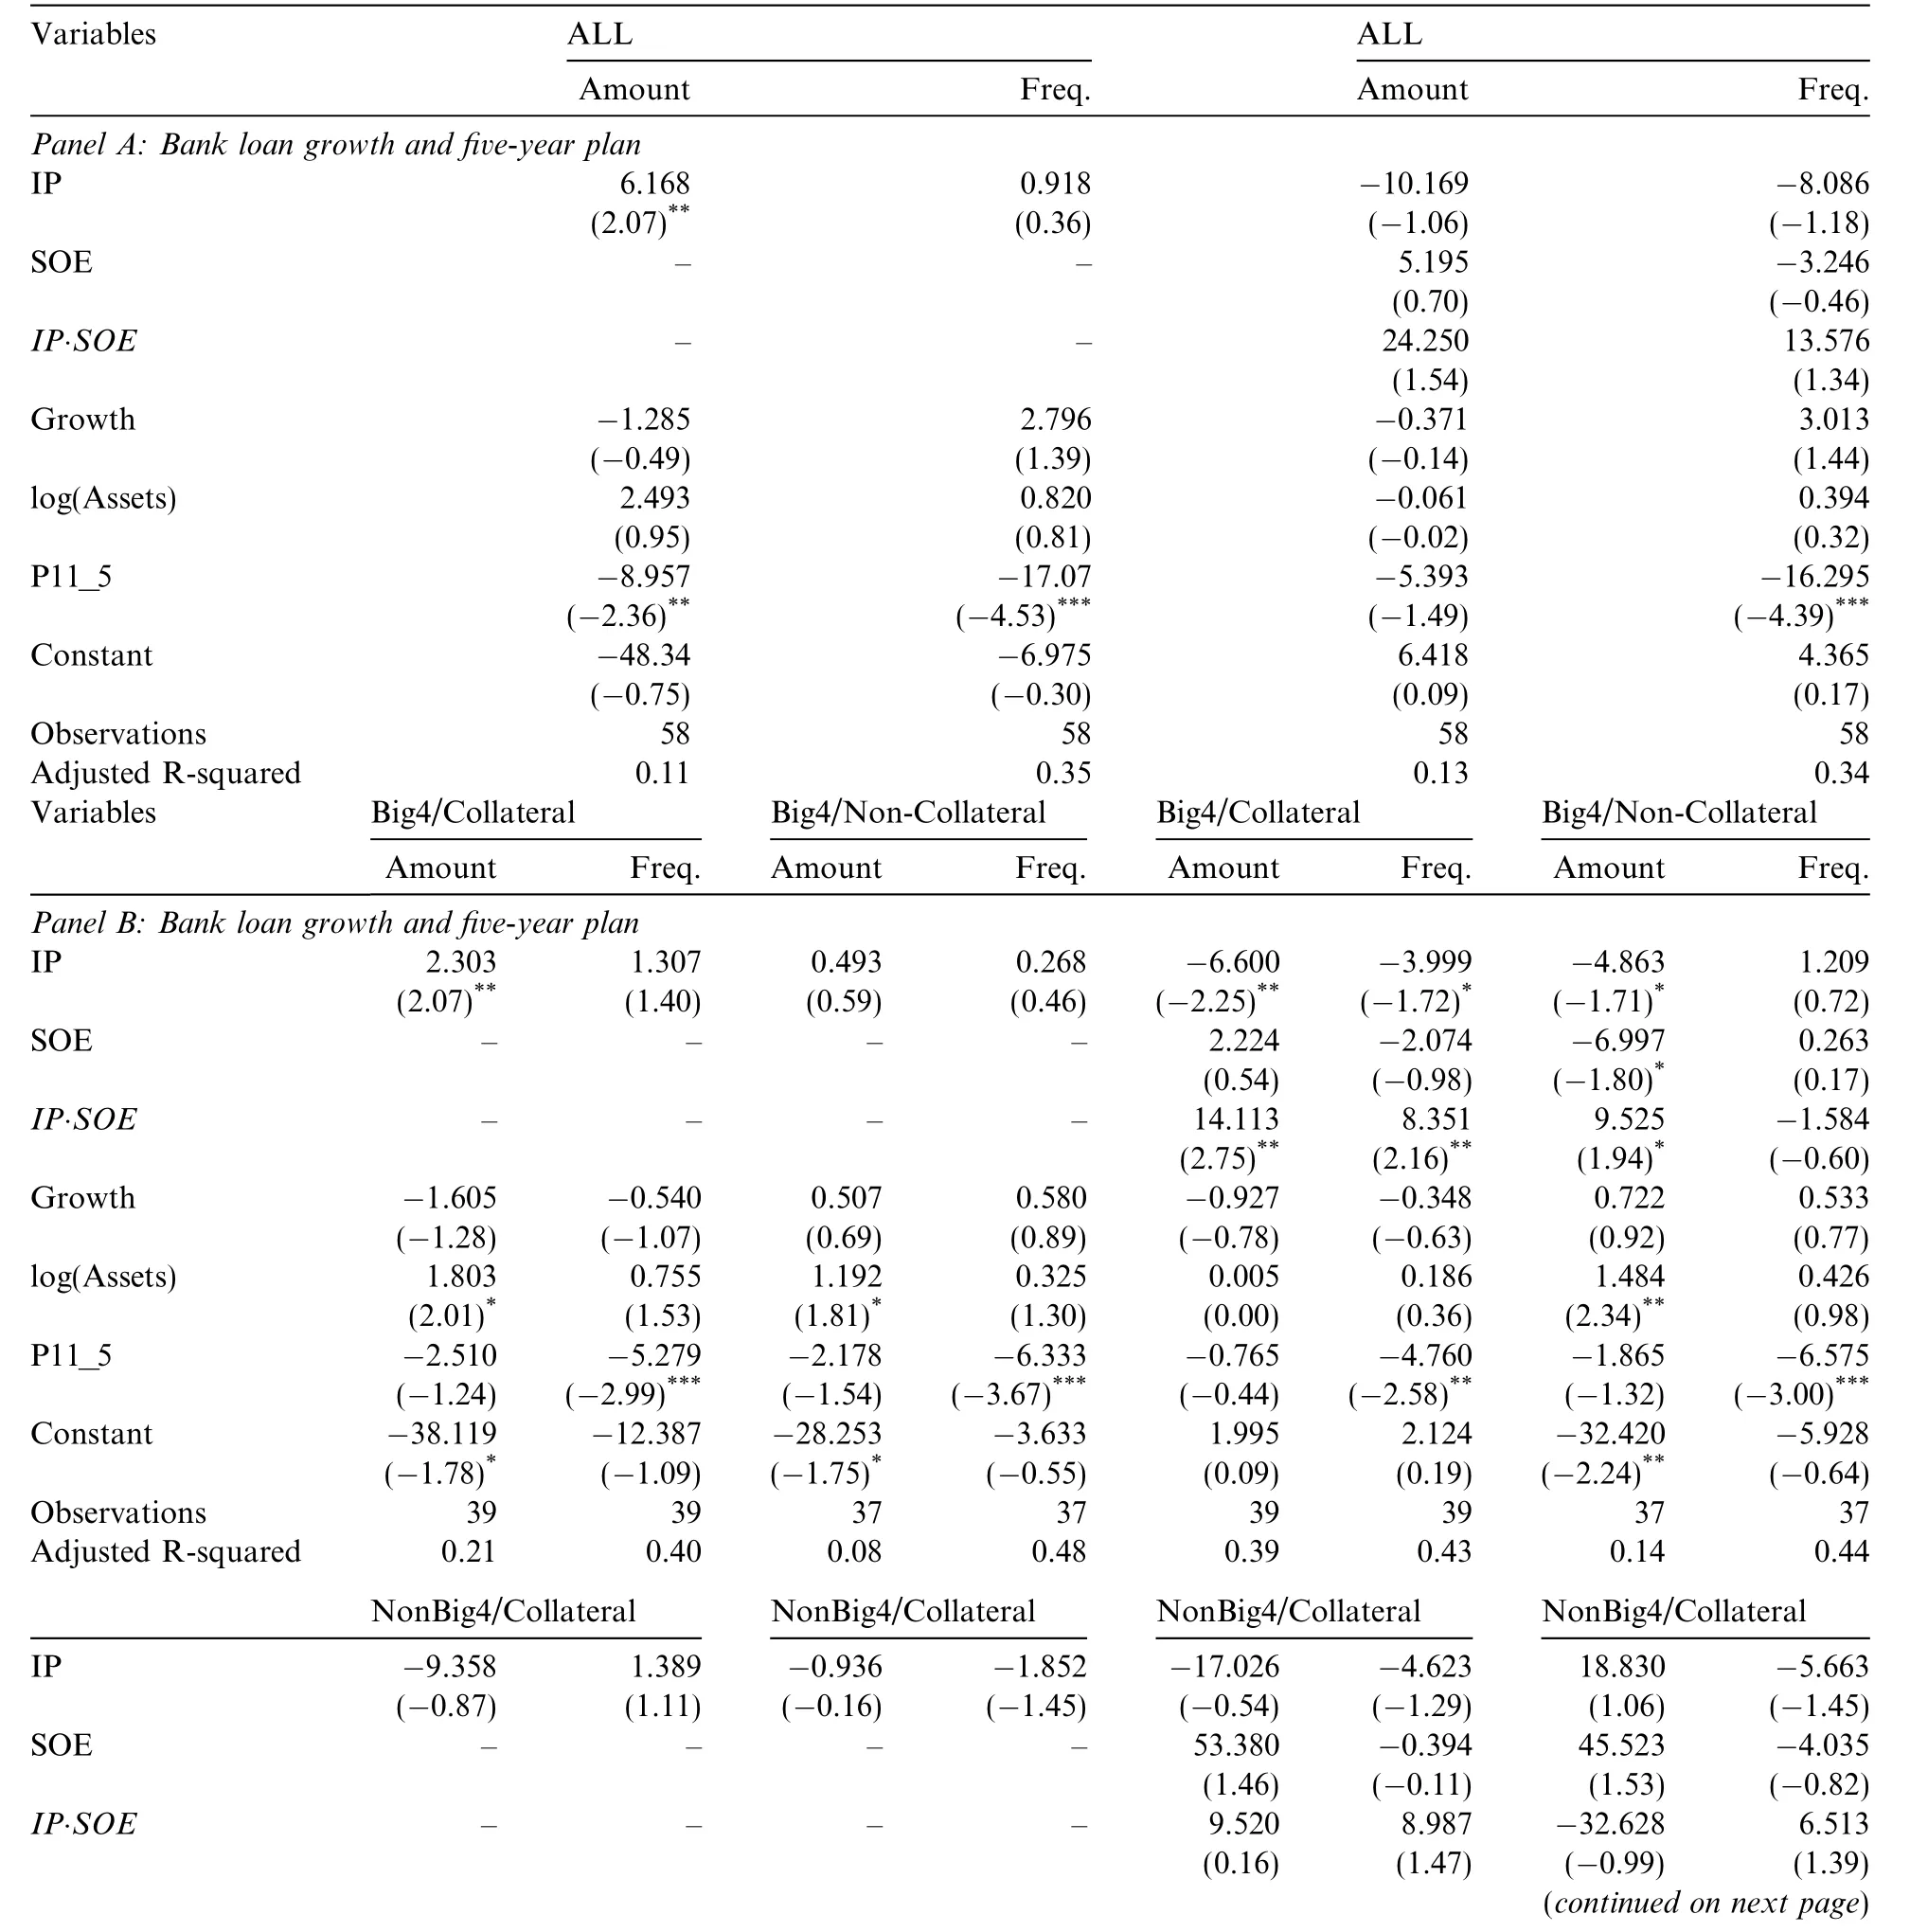
Table 7 Regressions of bank loan growth and five-year plans.Industrial policy IPjtequals 1 if Industry j is supported by the government in Five-Year Plan t,and 0 otherwise.SOEjtis the proportion of state ownership for Industry j during the tth five-year plan.The growth rate of Loan total amount(number)during Five-Year Plan t(compared with the previous five-year plan)for Industry j:Growth in Loan amount,(SumLoanjt-SumLoanjt-1)/SumLoanjt-1;Growth in Loan frequency,(NumLoanjt-NumLoanjt-1)/NumLoanjt-1.Growth in Loan(ALL)is from both Big4 national banks and Non-big4 national banks.Growth in Loan(Big4)is from collateral and non-collateral loans issued by Big4 national banks.Growth in Loan(NonBig4)is from collateral and non-collateral loans issued by Non-Big4 national banks.Growth in Loan(Big4/Collateral)is from collateral loans issued Big4 national banks.Growth in Loan(Big4/Non-Collateral)is from noncollateral loans issued Big4 national banks.Growth in Loan(NonBig4/Collateral)is from collateral loans issued by NonBig4 national banks.Growth in Loan(NonBig4/Non-Collateral)is from non-collateral loans issued by NonBig4 national banks.Growthjtis the growth rate for industry j in during the tth five-year plan based on China Statistical Yearbook,log(Assets)jtis the logarithm transformation of the industry median of assets,P11_5jtis an indicator that equals 1 for the Eleventh Five-Year Plan and 0 otherwise,respectively.

Table 7(continued)
where INEWitis the difference between total investment(ITOTAL)and depreciation and amortization(IMINTENANCE)for Firm i in Period t.VP is Tobin’s Q,measured as the sum of the market value of equity and net liabilities over the book value of tangible assets.Leverage is the ratio of total liabilities to total assets.Cash is cash and cash equivalents scaled by beginning total assets.Age is the log of listing years.Size is the log of total assets.Stock Return is the annual stock return.INEWit-1is new investment in Period t-1.We estimate the coefficients and obtain the residual ε[See Appendix B for regression results of the estimation model].We compute the proportion of firms with ε> 0 for each industry,Freq[ε> 0].The higher is the value of Freq[ε> 0]for an industry,the more severe is its overinvestment problem.
To determine if supported industries have more overinvestment,we estimate the following regression:

If the coefficient on IPjtis positive,we have evidence that supported industries have more overinvestment.
Panel A,Table 8 presents information on investment in various industries.The three industries with the highest level of new investments are the extractive(MINES),transportation and warehousing(TRANS),and construction(CONSTR)industries.This pattern is consistent with China’s current investment situation in that investment in infrastructure is intense.Panel B,Table 8 compares investment in supported industries and non-supported industries.Total investment,new investment and overinvestment in supported industries all exceed those in non-supported industries.
Table 9 presents regression results.Supported industries have a higher level of new investment.The coeffi cient on IP is positive and significant(0.012,t=2.56).On the other hand,supported industries also have a more severe level of overinvestment.In the overinvestment regression,the coefficient on IP is positive and significant(0.046,t=2.85).
As seen earlier,industries with heavier state-ownership are more likely to obtain financing opportunities.We therefore examine the effect of state ownership on investment and overinvestment.We add SOE and IP.SOE and estimate the following regressions:

If the coefficient on IPjt.SOEjtis positive,we have evidence that state-owned firms invest more.
Results on the effect of state-ownership are presented in Table 9.When we use INEW,the coefficient on IP is positive and significant(0.013,t=1.79)while the coefficient on IP.SOE is insignificant.When we use a measure of industry overinvestment,the coefficient on IP is positive and significant(0.083,t=2.65)andthe coefficient on IP.SOE is negative and significant(-0.071,t=-1.68),suggesting that while firms in supported industries tend to overinvest,state-owned firms actually overinvest less.

Table 8 Investment and five-year plans.ITOTALis measured as cash payments for fixed assets,intangible assets,and other longterm assets from the cash flow statement,scaled by beginning total assets.INEWitis the difference between total investment(ITOTAL)and depreciation and amortization(IMINTENANCE)for firm i in t.Overinvestment,ε,is the residual estimated from the following model.INEWit= γ0+ γ1VPit-1+ γ2Leverageit-1+ γ3Cashit-1+ γ4Ageit-1+ γ5--1+ γ2Leverageit-1+ γ3Cashit-1+ γ4Ageit-1+ γ5Sizeit-1+ γ6Stock Returnit-1+ γ7INEWit-1+Year+Industry+eit.

Table 8(continued)

Table 9 Regressions of investment and five-year plans.ITOTALis measured as cash payments for fixed assets,intangible assets,and other long-term assets from the cash flow statement,scaled by beginning total assets.INEWitis the difference between total investment(ITOTAL)and depreciation and amortization(IMINTENANCE)for firm i in t.Overinvestment,ε,is the residual estimated from the following model.INEWit= γ0+ γ1VPit-1+ γ2Leverageit-1+ γ3Cashit-1+ γ4Ageit-1+ γ5Sizeit-1+ γ6Stock Returnit-1+ γ7INEWit+1+Year+Industry+eit.Industrial policy IPjtequals 1 if Industry j is supported by the government in Five-Year Plan t,and 0 otherwise.SOEjtis the proportion of state ownership for Industry j during Five-Year Plan t.Growthjtis the growth rate for industry j in during the tth five-year plan based on China Statistical Yearbook,log(Assets)jtis the logarithm transformation of the industry median of assets,P11_5jtis an indicator that equals 1 for the Eleventh Five-Year Plan and 0 otherwise,respectively.
Ding et al.(2010) find that overinvestment exists in all types of Chinese firms,including non-state-owned firms with presumably better corporate governance and higher production efficiency.A possible explanation for our result is that major projects of state-owned firms all have to be approved by the government while the investment decision making of non-state-owned firms is more flexible,causing more overinvestment by nonstate-owned firms.

Table 10 Stock returns and five-year plans.BHARjtis the market adjusted buy-and-hold cumulative abnormal return.We use two measures of BHARjtfor industries:one is weighted based on firms’market value of tradable shares,BHAR_WOSjt;and the other one is weighted based on firms’market value of all shares,including non-tradable shares,BHAR_WTSjt.
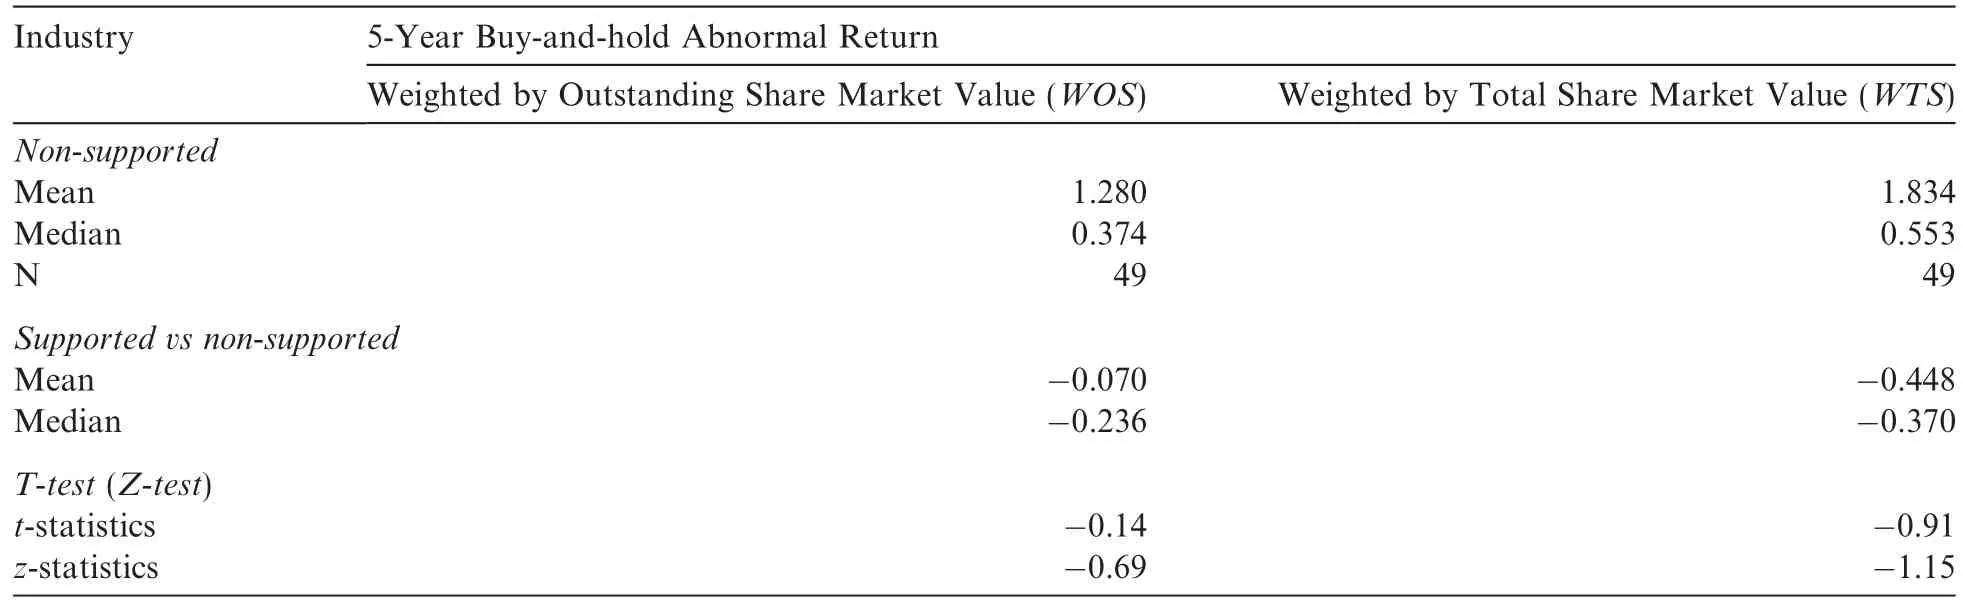
Table 10(continued)
5.5.Industry performance
It is important to determine if government engineering is associated with an improvement or deterioration in the performance of supported industries.Government engineering is a strategy that is not necessarily consistent with the free market mechanism.Therefore,supported industries may not perform well in the long run.On the other hand,the government may be able to identify industries that are promising in the future or are important for the national economy.If this is the case,supported industries can perform well in the long run.
It is also important to note that the economic performance of supported industries may not fit the original goals and purposes of government policies as the government often considers the aggregate interest of the whole economy and the aggregate interest may not be consistent with the interest of a certain industry.That is,the external benefit of supporting an industrial can be scattered in the society and not directly reflected within the industry that is the target of the policy.Therefore,even if we cannot find a link between government support and economic performance,we still cannot disapprove the rationale of government engineering.
5.5.1.Buy-and-hold abnormal return,BHAR
BHAR is the market adjusted buy-and-hold cumulative abnormal return(Barber and Lyon,1997;Lyon et al.,1999)for an industry.We compute BHARjtfor Industry j starting from the beginning of Five-Year Plan t to its end.We use two measures of BHAR:one is weighted based on firms’market value of tradable shares,BHAR_WOS;and the other is weighted based on firms’market value of all shares,including non-tradable shares,BHAR_WTS.10Chinese state-owned firms of ten just sell a portion of their shares.Therefore,many of their shares are non-tradable.
Panel A,Table 10 presents values of these two return measures for various industries.Panel B,Table 10 compares these two measures for supported and non-supported industries.Without control variables,there is no significant difference in returns between supported and non-supported industries.We then estimate the following regression:

The purpose of this analysis is to determine whether government supported industries fare better or worse in the long run in the stock market.
Regression results are reported in Table 11.Each observation is an industry-five-year-plan combination.The coefficients on IP are largely insignificant(0.654,t=1.56 using BHAR_WOS;0.429,t=1.15 using BHAR_WTS).
Next,we add state-ownership SOE and IP.SOE,and estimate the following regression:
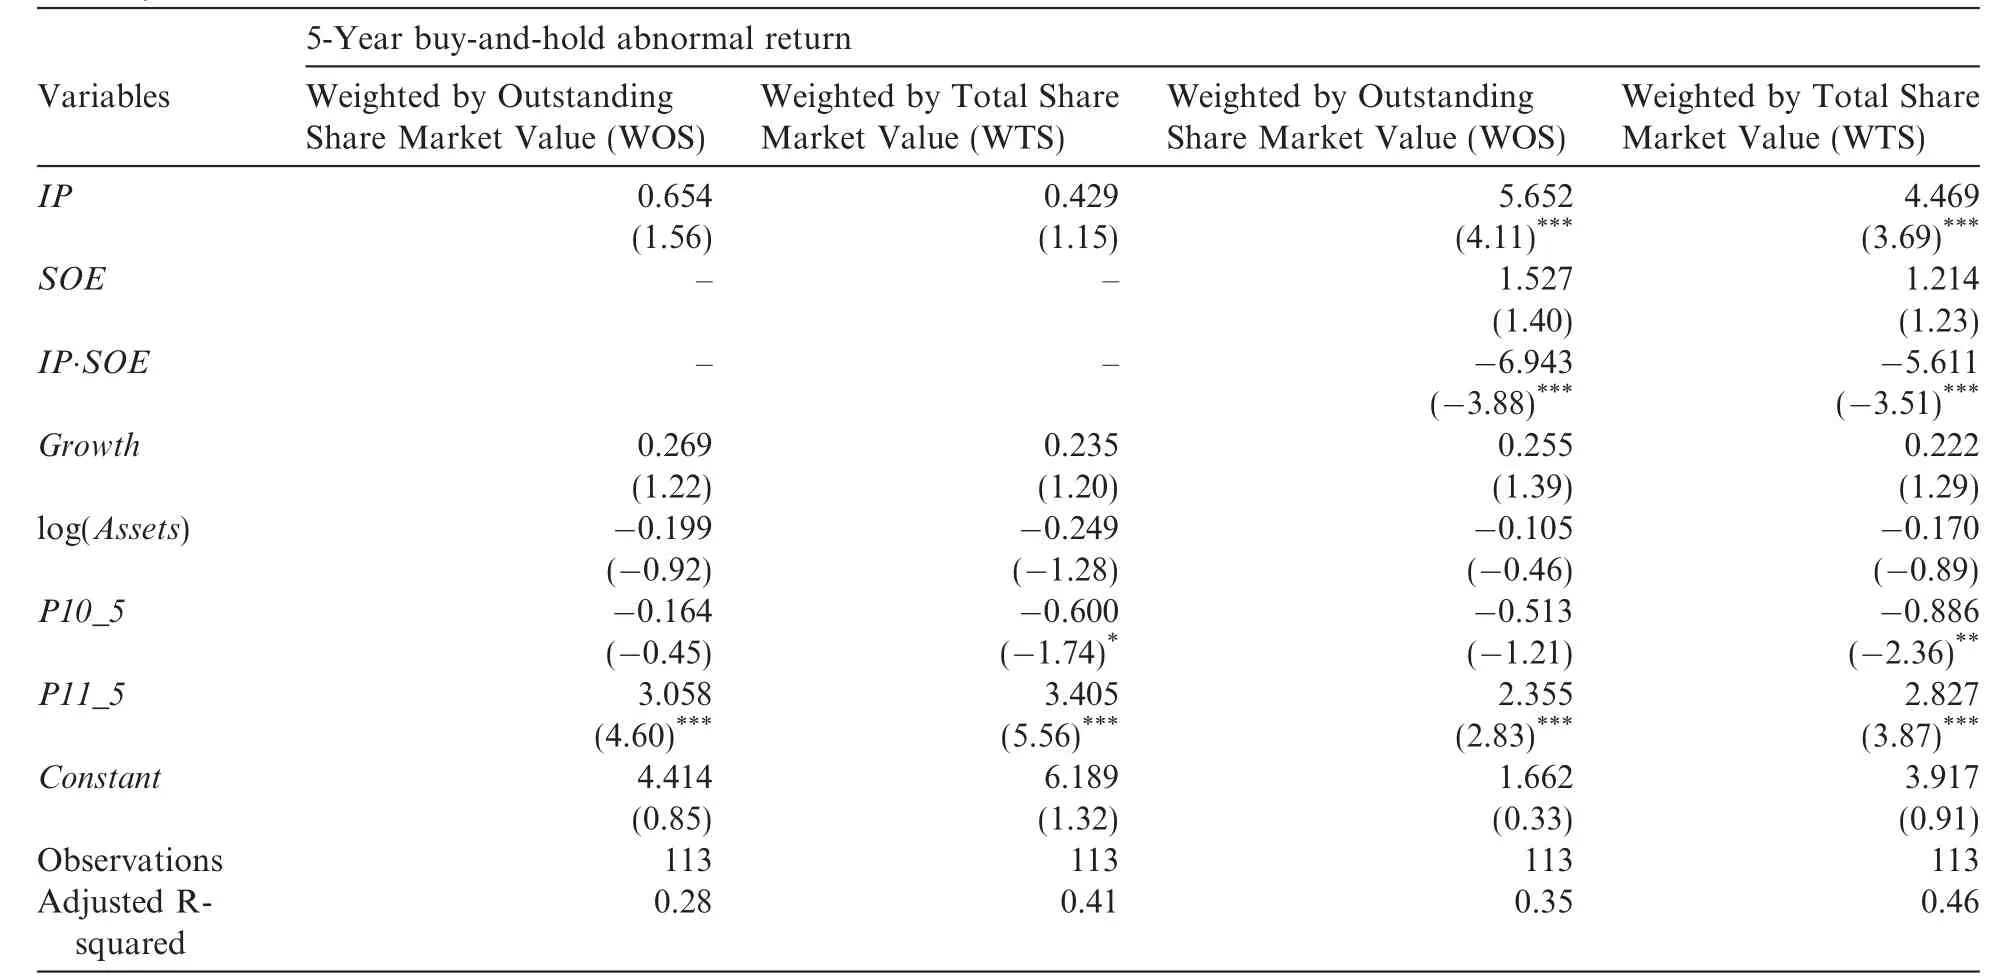
Table 11 Regressions of stock returns and five-year plans.Industrial policy IPjtequals 1 if Industry j is supported by the government in Five-Year Plan t,and 0 otherwise.SOEjtis the proportion of state ownership for Industry j during Five-Year Plan t.BHARjtis the market adjusted buy-and-hold cumulative abnormal return.We use two measures of BHARjtfor industries:one is weighted based on firms’market value of tradable shares,BHAR_WOSjt;and the other one is weighted based on firms’market value of all shares,including non-tradable shares,BHAR_WTSjt.Industrial policy IPjtequals 1 if Industry j is supported by the government in Five-Year Plan t,and 0 otherwise.log(Assets)jtis the logarithm transformation of Industry j’s median total assets.

With the addition of SOE and IP.SOE,the coefficients on IP are positiveand significant(5.652,t=4.11using BHAR_WOS;4.469,t=3.69 using BHAR_WTS),suggesting that supported industries enjoy higher stock returns.However,when state ownership increases,stock performance declines.The coefficients on IP.SOE are negative and significant(-6.943,t=-3.88 using BHAR_WOS;-5.611,t=-3.51 using BHAR_WTS).
Based on this result,we can potentially conclude that low efficiency associated with state ownership dampens the positive effect of government support on industry stock performance.On the other hand,we perhaps can also argue that as some of the external benefit of government engineering cannot be internalized by the state sector,the performance of the state sector is not as good as that of the non-state sector which potentially absorbs some of the external benefit.
5.5.2.Operating cash flow
We also consider an accounting based measure of performance,the growth in operating cash flow,Cash Flowjt.It is the compounded average annual growth rate of net operating cash flow for Industry j during Five-Year Plan t.We estimate the following regression:

The purpose of this examination is that cash flow ref l ects another dimension of industry performance,complementing results based on industry stock returns.
Panel A,Table 12 provides information on cash flow in various industries.Panel B,Table 12 compares the growth in cash flow between supported and non-supported industries.There is some weak evidence that supported industries have higher cash flow growth(difference in mean=0.050,t=1.83).Regression results arereported in Table 13.Each observation is an industry-five-year-plan combination.The coefficient on IP is positive and significant(0.058,t=2.04),suggesting that supported industries enjoy higher cash flow growth.

Table 12 Growth of operating cash flows and five-year plans.Cashflow is the average growth rate of net operating cash flow in every five-year plan.
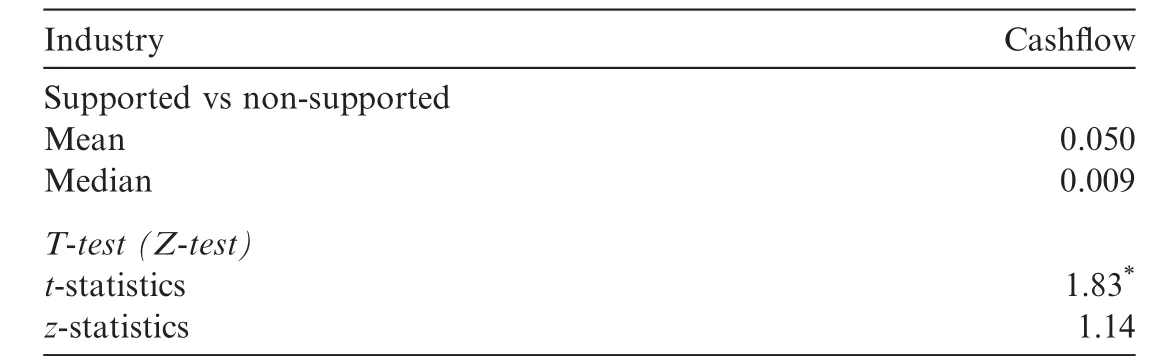
Table 12(continued)
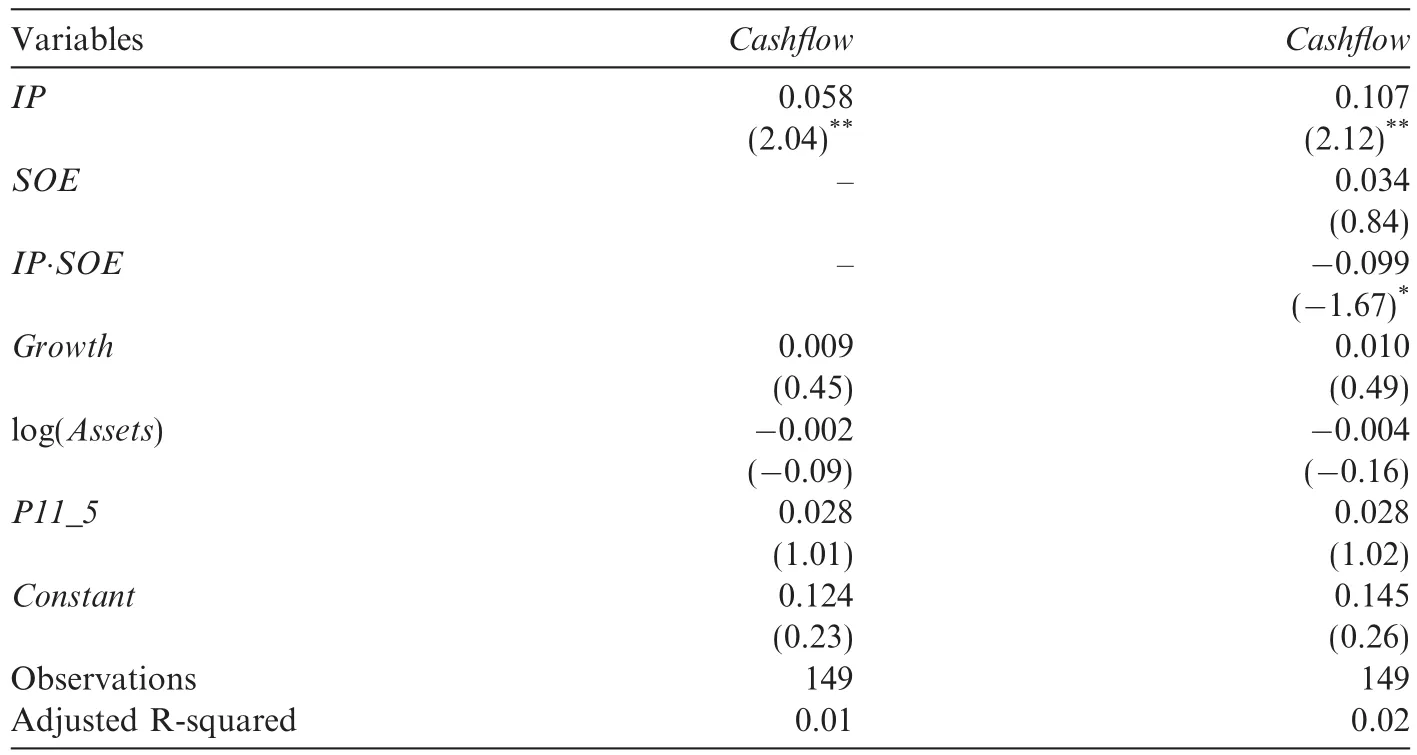
Table 13 Regressions of growth of operating cash flows and five-year plans.Cashflow is the average growth rate of net operating cash flow in every five-year plan.Industrial policy IPjtequals 1 if Industry j is supported by the government in Five-Year Plan t,and 0 otherwise.SOEjtis one if the ultimate controller is state ownership for Industry j during Five-Year Plan t.Growthjtis the growth rate for industry j in during the tth five-year plan based on China Statistical Yearbook,log(Assets)jtis the logarithm transformation of Industry j’s median total assets.
Next,we add state-ownership SOE and IP.SOE and estimate the following regression:

With the addition of SOE and IP.SOE,the coefficients on IP are positive and significant(0.107,t=2.12),suggesting that supported industries enjoy higher growth of cash flow.However,as state ownership increases,the growth rate of cash flow declines.The coefficients on IP.SOE are negative and significant(-0.099,t=-1.67).
5.5.3.Non-performing loan ratio,NPLR
The buy-and-hold return and cash flow analyses above capture performance in the stock market or in accounting terms.As we have earlier examined the effect of the government support in the loan market,we also estimate a performance measure for the loan market.We follow Morck et al.(2011)and compute the non-performing loan ratio NPLRjtfor Industry j during 2006–2010.Data come from hand-collected annual reports of the CBRC for 2006–2010.

Table 14 Non-performing loans and five-year plans.NPLRjtis non-performing loan ratio for Industry j in Year t.
Panel A,Table 14 shows the level of non-performing loans for various industries.Panel B,Table 14 compares the level of non-performing loans between supported and non-supported industries.We find no significant difference.Next,we take a logistic transformation of NPLR and estimate the following regressions:

where VAjtis value-added for Industry j.We use these equations to determine whether supported industries have more or less non-performing loans.
The issue of non-performing loans in China’s banking system has been a topic of interest.China’s banking system has experienced several major reforms and through the establishment of several big asset management firms,non-performing loans have been drastically reduced.Based on annual reports of China’s Banking Regulatory Commission,the ratio of non-performing loans exhibits steady decline over 2005–2010.However,government industrial policies may distort the bank loan market,causing the ratio of non-performing loans to be higher in supported industries than in non-supported industries.This logic would be consistent with Allen et al.(2005)and Morck et al.(2011).

Table 15 Regressions of non-performing loans and five-year plans.Industrial policy IPjtequals 1 if Industry j is supported by the government in Five-Year Plan t,and 0 otherwise.SOEjtis the proportion of state ownership for Industry j during Five-Year Plan t.NPLRjtis non-performing loan ratio for Industry j.We take the logistic transformation of NPLRjt.VAjtis value added Industry j.
Table 15 presents results covering 2006–2010.In this analysis,as we only have data for one five-year plan,each observation is an industry-year combination.The coefficient on IP is positive and marginally significant(1.659,t=1.64),suggesting that the ratio of non-performing loans is higher in supported industries than in non-supported industries.This is evidence of a negative effect of government support,consistent with Morck et al.(2011)that government-led resource allocations can create distortion.The coefficient on SOE is negative and significant(-2.199,t=-3.12),suggesting that state-owned firms in non-supported industries actually have a lower non-performing loan ratio.The coefficient on IP.SOE is insignificant(-0.715,t=-0.64),suggesting no difference in the non-performing loan ratio between state-owned and non-stateowned firms in supported industries.
The above results are different from our stock market performance and cash flow growth analyses earlier.We do not attempt a formal reconciliation here.Five-year plans are multi-dimensional and an analysis of them has to be conducted from different angles.Finding different results enriches our understanding of this model and helps us more objectively evaluate its consequences.Of course,the evidence that state-owned firms in nonsupported industries have a lower non-performing loan ratio may be specific for the time period 2006–2010 used in the analysis as the government established several asset management companies that took over many non-performing loans from banks.
6.Conclusion
Since the start of its economic reform in 1978,China has achieved rapid and sustained economic growth.What does China’s rapid growth tell us?Is the China experiment useful to other economies?These are unavoidable questions of our era.Different from prior research on China’s economy,we focus on an economic management model long used by the Chinese government– five-year plans.We examine the influence of four five-year plans from 1991 to 2010 on China’s capital markets and their economic consequences.
We find that industries supported by the government enjoy faster growth in equity and debt finance.This pattern is more pronounced in industries with heavy state ownership.Further,as their respective market orientation improves,the government’s control of the IPO,SEO and bank loan markets declines.We also find that government supported industries have higher stock market returns and cash fl ow growth that dampen as state ownership increases.Supported industries also have a higher ratio of non-performing loans.These findings provide a new perspective in understanding the role played by government economic engineering on corporate finance and its economic consequences.


Agrawal,D.,Knoeber,C.,2001.Do some outside directors play a political role?J.Law Econ.44(1),179–198.
Alesina,A.,Rodrik,D.,1994.Distributive politics and economic growth.Quart.J.Econ.,465–490
Allen,F.,Qian,J.,Qian,M.,2005.Law,finance,and economic growth in China.J.Financ.Econ.77,57–116.
Allen,F.,Qian,J.,Zhang,C.2011.An Alternative View on Law,Institutions,Finance and Growth,Working paper.
Ayyagari,M.,Demirgu¨c?-Kunt,A.,Maksimovic,V.,2010.Formal versus informal finance:evidence from China.Rev.Finan.Stud.23(8),3048–3097.
Barber,B.M.,Lyon,J.D.,1997.Detecting long-run abnormal stock returns:the empirical power and specification of test statistics.J.Finan.Econ.43,341–372.
Barnett,S.,Brooks,R.2006.What’s Driving Investment in China?IMF working paper.
Beck,T.,Levine,R.,2002.Industry growth and capital allocation:does having a market-or bank-based system matter?J.Finan.Econ.64,147–180.
Brandt,V.L.,Rawski,T.G.,2008.China’s Great Economic Transformation.Cambridge University Press.
Chen,K.C.W.,Yuan,H.,2004.Earnings management and capital resource allocation:evidence from China’s accounting-based regulation of rights issues.Account.Rev.79(3),645–666.
Claessens,S.,Feijen,E.,Laeven,L.,2008.Political connections and preferential access to finance:the role of campaign contributions.J.Financ.Econ.88,554–580.
Claessens,S.,Djankov,S.,Fan,J.P.H.,Lang,L.,2002.Disentangling the incentive and entrenchment effects of large shareholdings.J.Finan.57(6),2741–2771.
De Soto,H.,1990.The Other Path:The Invisible Revolution in the Third World.Perennial Library.
Demirgu¨c?-Kunt,A.,Maksimovic,V.,1998.Law,finance,and firm growth.J.Finan.53,2107–2137.
Dinc,I.S.,2005.Politicians and banks:political influences on government-owned banks in emerging markets.J.Finan.Econ.77(2),453–479.
Ding,S.,Guariglia,A.,Knight,J.,2010.Does China Overinvest?Evidence From a Panel of Chinese Firms.Working paper.
Faccio,M.,2006.Politically connected firms.Am.Econ.Rev.96(1),369–386.
Fan,J.P.H.,Wong,T.J.,Zhang,T.,2007.Politically connected CEOs,corporate governance,and post-IPO performance of China’s newly partially privatized firms.J.Finan.Econ.84,330–357.
Fisman,R.,2001.Estimating the value of political connections.Am.Econ.Rev.91,1095–1102.
Foos,D.,Norden,L.,Weber,M.,2010.Loan growth and riskiness of banks.J.Bank.Finan.34(12),2929–2940.
Guariglia,A.,Liu,X.,Song,L.,2011.Internal finance and growth:microeconometric evidence on Chinese firms.J.Dev.Econ.96(1),79–94.
Hadlock,C.J.,Lee,D.S.,Parrino,R.,2002.CEO careers in regulated environments:evidence from electric and gas utilities.J.Law Econ.45,535–563.
Helland,E.,Sykuta,S.,2004.Regulation and the evolution of corporate boards:monitoring,advising,or window dressing.J.Law Econ.74,167–192.
Huang,Y.,2002.Managing Chinese bureaucrats:an institutional economics perspective.Polit.Stud.50,61–79.
Kao,J.L.,Wu,D.,Yang,Z.,2009.Regulations,earnings management,and post-IPO performance:the Chinese evidence.J.Bank.Finan.33,63–76.
Khwaja,A.I.,Mian,A.,2005.Do lenders favor politically connected firms:rent provision in an emerging financial market.Quart.J.Econ.120(4),1371–1411.
Kikeri,S.,Nellis,J.,Shirley,M.,1992.Privatization:The Lessons of Experience.World Bank,Washington,D.C..
King,R.,Levine,R.,1993.Finance and growth:Schumpeter might be right.Quart.J.Econ.108,717–738.
Kornai,J.,1979.Resource-constrained versus demand-constrained systems.Econometrica 47(4),801–820.
KPMG,2011.China’s 12th Five-Year Plan:Overview.
La Porta,R.,Lopez-De-Silanes,F.,Shleifer,A.,Vishny,R.,1998.Law and finance.J.Polit.Econ.106(6),1113–1155.
La Porta,R.,Lopez-De-Silanes,F.,Shleifer,A.,Vishny,R.,1997.Legal determinants of external finance.J.Finan.52,1131–1150.
La Porta,R.,Lopez-De-Silanes,F.,Shleifer,A.,Vishny,R.,2002a.Investor protection and corporate valuation.J.Finan.57(3),1147–1170.
La Porta,R.,Lopez-de-Silanes,F.,Shleifer,A.,2002b.State ownership of banks.J.Finan.57(1),256–301.
Levine,R.,Zervos,S.,1998.Stock market,banks,and economic growth.Am.Econ.Rev.88,537–558.
Levine,R.,1999.Law,finance,and economic growth.J.Finan.Intermed.8,36–67.
Lyon,J.D.,Barber,B.M.,Tsai,C.L.,1999.Improved tests of long-run abnormal returns.J.Finan.54,165–201.
McChesney,F.,1987.Rent extraction and rent creation in the economic theory of regulation.J.Legal Stud.16(1),101–118.
McKinnon,R.,1973.Money and Capital in Economic Development.Brookings Institution Press,Washington,DC.
Megginson,W.L.,Nash,R.C.,Randenborgh,M.,1994.The financial and operating performance of newly privatized firms:an international empirical analysis.J.Finan.49,403–452.
Morck,R.,Yavuz,M.D.,Yeung,B.,2011.Banking system control,capital allocation,and economy performance.J.Finan.Econ.100(2),264–283.
Murphy,K.M.,Shleifer,A.,Vishny,R.,1989.Industrialization and the big push.J.Polit.Econ.97(5),1003–1026.
Olson,M.,1965.The Logic of Collective Action:Public Goods and the Theory of Groups.Harvard University Press.
Peltzman,S.,1976.Toward a more general theory of regulation.J.Law Econ.19(Aug.),807–820.
Perotti,E.,Vorage,M.,2008.Political Allocation of Finance.Working paper.
Perotti,E.,Vorage,M.,2009.Political Allocation of Bank Finance.Working paper.
Rajan,R.G.,Zingales,L.,1998.Financial dependence and growth.Am.Econ.Rev.88(3),559–586.
Richardson,S.,2006.Over-investment of free cash flow.Rev.Acc.Stud.11,159–189.
Sapienza,P.,2004.The effects of government ownership on bank lending.J.Finan.Econ.72,357–384.
Shleifer,A.,Vishny,R.,1994.Politicians and firms.Quart.J.Econ.109(4),995–1025.
Stern,A.,2011.China’s superior economic model.Wall Street J.1.
Stigler,G.J.,1971.The theory of economic regulation.Bell J.Econ.
Stiglitz,J.E.,Yusuf,S.(Eds.),2001.Rethinking the East Asian miracle.A Copublication of the World Bank and Oxford University Press.
Sun,Q.,Tong,W.H.S.,2003.China share issue privatization:the extent of its success.J.Finan.Econ.70,183–222.
Trindade,V.,2005.The big push,industrialization and international trade:the role of exports.J.Dev.Econ.78,22–48.
Williamson,O.E.,2000.The new institutional economics:taking stock,looking ahead.J.Econ.Lit.38(3),595–613.
World Bank,1993.East Asian Miracle.
in Chinese
Chinese Communist Party Central Committee,2010.Recommendations to the Twelfth Five-Year Plan.
China Securities Regulatory Commission,2011.Monthly Report of Securities Market,August,2011.
Deng,X.,1993.Selected Works of Deng Xiaoping,vol.3.People’s Publishing House.
Fairbank,J.K.,1994.Cambridge university history of the Republic of China.Translated by Pingquan,Y.et al.China Social Science Press.
Jiang,Y.,2006.How was the Eleventh Five-Year Plan Formulated?People’s Net <http://www.china.com.cn/>.
Lin,Y.,Cai,F.,Li,Z.,1994.The Miracle of China:Development Strategy and Economic Reform.Shanghai Sanlian Publishing House.
Lin,Y.,2012.The Quest for Prosperity:How Developing Economies can Take Of f.Princeton University Press.
People’s Daily,1953.Fight for the Great Aim of Socialist Industrialization:Celebration of Forth Year Birthday of People’s Republic of China.Editorial of the People’s Daily,1 October.
Sachs,J.,2011.America Needs a Long-Term Economic Strategy:Interviewing.Jeffrey Sachs.
Wu,X.,2013.Gains and Losses of Economic Reforms.Zhejiang University Press.
Further reading
Acemoglu,D.,Johnson,S.,2005.Unbundling institutions:law vs.politics.J.Polit.Econ.113(5),949–995.
Acemoglu,D.,Johnson,S.,Robinson,J.,2001.The colonial origins of comparative development:an empirical investigation.Am.Econ.Rev.91,1369–1401.
Bai,C.,Lu,J.,Tao,Z.,2006.Themultitask theory of state enterprise reform:empirical evidence from China.Am.Econ.Rev.96(2),353–357.
Barzel,Y.,1989.Economic Analysis of Property Rights.Cambridge University Press.
Blanchard,O.,Shleifer,A.2001.Federalism With and Without Political Centralization:China vs.Russia.IMF StaffWorking Papers,Special Issue,2001,International Monetary Fund.
Caijing(Chinese language financial magazine),2011.6 November.
Chen,Y.,1952.Directions and goals for finance and economics for 1952.People’s Daily,Editorial,17 November 1952.Important government documents since the founding of the People’s Republic of China,vol.3.
China Securities Regulatory Commission,2001.Index for Listed Firms’Industry Classifications,4 April.
China Securities Regulatory Commission,2007.Guideline#6 of Listed Firms’Conduct of Business:Changing Industry Classifications,20 December.
China State Council,1994.Automobile Industry Policy.
China State Council,2004.Automobile Industry Development Policy.
Derashid,C.,Zhang,H.,2003.effective tax rates and the ‘‘industrial policy” hypothesis:evidence from Malaysia.J.Int.Account.,Audit.Tax.12,45–62.
Dollar,D.,Wei,J.-S.2007.Das(wasted)Capital:Firm Ownership and Investment Efficiency in China.NBER Working Paper No.13103,National Bureau of Economic Research,Inc.
Fan,J.P.H.,Wong,T.J.,Zhang,T.,n et al.,forthcoming.Founder succession and accounting properties.Contemp.Account.Res.,forthcoming
Gerschenkron,A.,1962.Economic Backwardness in Historical Perspective:A Book of Essays.Frederick A.Praeger Publishers.
Guan,H.,Lin,Z.,2011.Five year plan and course of economic development of China.China Econ.
Jin,H.,Qian,Y.,Weingast,B.R.,2005.Regional decentralization and fiscal incentives:federalism,Chinese style.J.Pub.Econ.89,1719–1742.
La Porta,R.,Lopez-de-Silanes,F.,Pop-Eleches,C.,Shleifer,A.,2004.Judicial checks and balances.J.Polit.Econ.112,445–470.
Levine,R.,2002.Bank-based or market-based financial systems:which is better?J.Finan.Intermed.11,1–30.
Lewis,W.A.,1949.The Principles of Economic Planning.George Allen and Unwin Ltd,London.
Li,H.,Zhou,L.,2005.Political turnover and economic performance:the incentive role of personnel control in China.J.Public Econ.89(9–10),1743–1762.
Lin,J.Y.,Yao,Y.,2001.Chinese rural industrialization in the context of the East Asian miracle.Chapter 4.In:Stiglitz,J.E.,Yusuf,S.(Eds.),Rethinking the East Asian Miracle.A Co-Publication of the World Bank and Oxford University Press.
Lin,Y.,Srinivasan,A.,Yamada,T.,2011.The Real effect of Lending by State Owned Banks:Evidence from Japan During the Crisis of the 90s.Working paper.
Liu,G.Research Report on China’s Ten Five-Year Plan.People’s Publishing House.
Martin,M.F.,2010.Understanding China’s political system.In:Congressional Research Service Report for Congress.
Monthly Report on China’s Economy,2010 <http://www.china-economic-data.com/>.
Montinola,G.,Qian,Y.,Weingast,B.R.,1995.Federalism,Chinese style:the political basis for economic success in China.World Polit.48(1),50–81.
Morris,C.T.,Adelman,I.,1988.Comparative Patterns of Economic Development,1850–1914.Hopkins Press.
National Bureau of Statistics of China,1983.Classification and Code Standard of National Economy Industry-National Standard(Guo Biao)GB/T4754.
National Bureau of Statistics of China,2003.National Industries Classification GB/T4754-2002.
National Bureau of Statistics of China,2011.Bulletin of the Verification of Gross Domestic Product(GDP)in Year 2010<http://www.stats.gov.cn/>.
National Bureau of Statistics of China.China Statistical Yearbook.Various years of volumes.
National People’s Congress,1986.The Eighth Five Year Plan.
National People’s Congress,1991.The Outline of Eighth Five Year Plan and the National Economic and Social Development Plan of People’s Republic of China for Ten Years.
National People’s Congress,1996.Ninth Five Year Plan and Outline of Future Perspective in 2010 of the National Economic and Social Development of People’s Republic of China.
National People’s Congress,2001.The Outline of Tenth Five Year Plan of the National Economic and Social Development of People’s Republic of China.
National People’s Congress,2006.The Outline of Eleventh Five Year Plan of the National Economic and Social Development of People’s Republic of China.
Piotroski,J.,Wong,T.J.,2010.Institutions and Information Environment of Chinese Listed Firms,Capitalizing China.NBER.
Qian,Y.,Weingast,B.,1997.Federalism as a commitment to preserving market incentives.J.Econ.Perspect.11,83–92.
Qian,Y.,Roland,G.,1998.Federalism and the soft budget constraint.Am.Econ.Rev.88,1143–1162.
Rajan,R.G.,Zingales,L.,2003.The great reversals:the politics of financial development in the twentieth century.J.Financ.Econ.69(1),5–50.
Rajan,R.G.,Zingales,L.,2004.Saving Capitalism from the Capitalists:Unleashing the Power of Financial Markets to Create Wealth and Spread Opportunity.Princeton University Press.
Ritter,J.,1984.The ‘‘hot issue” market of 1980.J.Bus.57(2),215–240.
Saich,T.,2004.Governance and Politics of China.In:Comparative Government and Politics,second ed.
Stalin,J.V.,1954.Complete Works of Stalin.People’s Publishing Press,China.
State Administration of Foreign Exchange of China,2011.Foreign Currency Exchange in China <http://www.safe.gov.cn/>.
Vining,A.,Boardman,A.,1992.Ownership vs.competition:efficiency in public enterprise.Public Choice 73(March),205–239.
Zhang,W.,Cheung,N.S.,2008.China’s Economic System.
Zhou,L.,2004.Chinese officials’motivation and cooperation:a discussion of China’s regional protectionism and overlapping development.Econ.Res.J.6.
Zhu,R.,2011.Zhu Rongji’s Talks.People’s Publishing House.
20 May 2016 Accepted 5 June 2017 Available online 23 August 2017
*Corresponding author.
E-mail address:dhchen@nju.edu.cn(D.Chen).
☆We thank workshop and conference participants at Fudan University,National Chengchi University,National University of Singapore,National University of Taiwan,Peking University,University of Hong Kong,University of International Business and Economics,China Accounting and Finance Review International Symposium 2010 and Journal of Contemporary Accounting and Economics Conference 2013 for comments and suggestions.This project has benefited from a generous Tier 2 grant from the Ministry of Education of Singapore,#R-521-000-024-112 and National Natural Science Foundation of China,#71372032.
http://dx.doi.org/10.1016/j.cjar.2017.06.001
1755-3091/?2017 Sun Yat-sen University.Production and hosting by Elsevier B.V.
This is an open access article under the CC BY-NC-ND license(http://creativecommons.org/licenses/by-nc-nd/4.0/).
JEL classification:G3 O2 P2 P3
 China Journal of Accounting Research2017年3期
- China Journal of Accounting Research的其它文章
- How much control causes tunneling?Evidence from China
- influence of Chinese entrepreneurial companies’internationalization on independent innovation:Input incentive effect and efficiency improvement effect
- Stock index adjustments,analyst coverage and institutional holdings:Evidence from China
- The significance of research—Comments on the Five-Year Plan paper