
Analysis of the hydrological safety of dams combining two numerical tools: Iber and DualSPHysics *
2018-04-13 12:13GonzlezCaoGarcFealDomnguezCrespomezGesteira
水動力學研究與進展 B輯 2018年1期
J. González-Cao, O. García-Feal, J. M. Domínguez, A. J. C. Crespo, M. Gómez-Gesteira
?
Analysis of the hydrological safety of dams combining two numerical tools: Iber and DualSPHysics*
J. González-Cao, O. García-Feal, J. M. Domínguez, A. J. C. Crespo, M. Gómez-Gesteira
Theupgrade of the hydrological safety of dams is a critical issue to avoid failures that can dramatically affect people and assets. This paper shows a numerical methodology to analyse the safety of the Belesar dam (NW, Spain) based on two different numerical codes. First, a mesh-based code named Iber, suited to deal with large 2-D domains, is used to simulate the impoundment. The initial conditions and the inlet provided to Iber correspond to the maximum water elevation and the maximum expected inflow to the impoundment defined in the technical specifications of the dam, which are associated to the more hazardous operation conditions of the dam. Iber provides information about the time needed for water to attain the crest of the dam when floodgates are closed. In addition, it also provides the velocity of discharge when gates are opened. Then, a mesh-free code named DualSPHysics, which is especially suited to deal with complex and violent 3-D flows, is used to reproduce the behaviour of one of the spillways of the dam starting from the results obtained with Iber, which are used as inlet conditions for DualSPHysics. The combined results of both model show thattheleft spillway can discharge the surplus of water associated to the maximum inflow to the reservoir if the gates of the spillways are opened before the overtopping of the dam was observed. In addition, water depth measured on the spillway is considerably lower than the lateral walls, preventing overtopping. Finally, velocities at different points of the spillway showed to be in good agreement with theoretical values.
Hydrological safety, dam;numerical simulation, Iber, DualSPHysics
Introduction
The hydrological safety of dams can be associa- ted with the probability of failure of the exceedance structures: spillways and outlet works[1]. The failure of the exceedance structures can be divided into two types: structural and performance failures[2]. The first one is related to dam breaks or collapses and the second one is related to water excess in the impound- ment of the dam. These failures can generate high impacts downstream the dam causing serious damage to population[3, 4]or infrastructures. For instance, on February 11, 2017, the damage of main and emer- gency spillways of the Oroville dam, in Northern California, precluded the opening of the gates. This fact, combined with a high precipitation event, led to the rising of the level of the impoundment over the crest of the dam (overtopping). In order to avoid the collapse of the weir derived from overtopping, the gates of the spillways were opened causing the erosion of the main spillway. More than 150 000 people living downstream were evacuated.
In this work the hydrological safety of Belesar dam was analysed by means of two numerical codes: Iber[5]and DualSPHysics[6]. First, the water elevation and the outflow of the spillways associated with the maximum expected flow defined in the dam speci- fications were obtained using Iber[5], which is a mesh- based numerical code that solves the St. Venant 2D equations using a finite volume scheme. Iber is well suited to analyse the behaviour of rivers or impound- ments with large domains where only the horizontal components of the velocity and the water depth are involved. Two applications of Iber to flood analysis can be found in Bonasia et al.[7]and Areu-Rangel et al.[8]. In the present application, the numerical domain includes the geometry of the Belesar dam and its associated impoundment.
Once the water elevation near the spillways of the dam and the outflow of the left spillway were obtained with Iber, the behaviour of the spillway was studied by means of DualSPHysics[6], which is a mesh-free numerical code conceived to analyse free- surface phenomena where complex fluid dynamics is observed[9-11].
1. Case of study
Belesar dam and its associated impoundment are located in North-West of Spain in Autonomous Community of Galicia 42o37?45??N, 7o42?36??W. The dam was built in the mid 20th century with the main purpose of power generation, basin regulation and flooding control. The total high (from heel to crest) is 132 m with a crest length is 500 m, whose upper part is at 332 ma.s.l.. The impoundment associated to the dam has a capacity of 654.5 hm3and covers an area of 1.9097′108m2, with a watershed of 4 290 km2. The main exceedance structures of the dam are two spillways and four scour outlets. According to the technical specifications of the dam, the maximum level of the pool is equal to 330 m.a.s.l. and the maximum expected Mi?o river flow is 4 000 m3/s. The geographical location of the dam, and aerial image of the impoundment and a zoomed aerial image including both spillways are shown in Fig. 1.
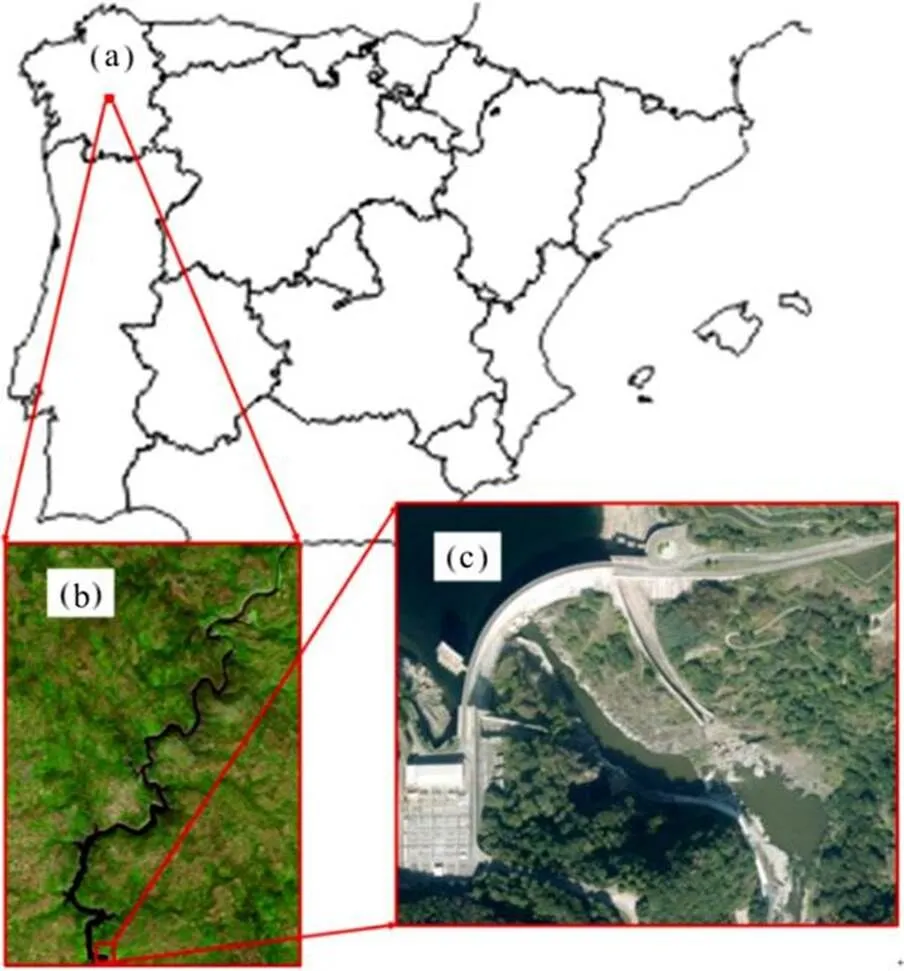
Fig.1(Color online) Location of “Belesar” dam (a), impound- ment associated to the dam (b) and aerial image of the dam (c). The figures showed in panels b and c were obtained from http://www.ign.es/iberpix2/visor/# (PNOA courtesy of ? Instituto Geográfico Nacional)
The geometry of the impoundment was obtained from raster files obtained from the IGN website and edited by means of QGIS[12]. In addition, the geometry of the spillway was obtained using the Blender[13]according to the technical specifications of the dam.
2. Material and methods
A description of the numerical codes used to per- form the simulations and the parameters defined for these simulations is presented in this section.
2.1 Iber
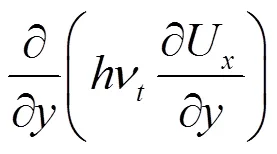
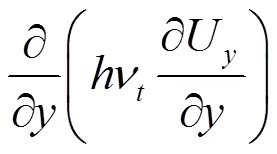
Iber[5]is a numerical code that solves the St. Venant 2-D Equations (Eq. (1)) by means of a finite volume scheme. The model consists of three modules: hydrodynamic, turbulence and sediment transport. Although only the hydrodynamic one was used in this work. The code can be freely downloaded from http://iberaula.es/web/index.php.
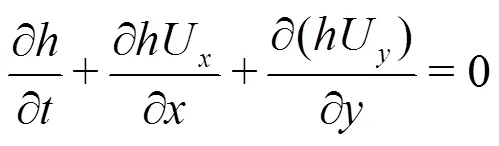
The assumptions of the St. Venant 2-D Equations are: (1) the velocity vector varies only in the hori- zontal direction of the flow. (2) The slope of the bottom is small. (3) No erosion is considered. (4) The flow is considered as incompressible.
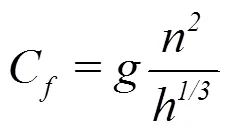
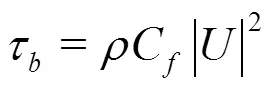
The friction between the water and the bottom of the channel is an important parameter to model the hydrodynamics of the flow in a wide variety of app- lications. This parameter is usually modelled as
Manning’s coefficients were assigned by means of a tool[14]implemented in Iber that automatically links the land uses defined in the Sistema de Infor- mación sobre Ocupación del Suelo de Espa?a (SIOSE)to the values of the Manning’s coefficients internally defined in Iber. More than 1 000 land uses were prescribed for the area under study with Manning?s coefficients ranging from 0.002 s/m1/3to 0.073 s/m1/3. Figure 2 shows the land uses defined for this simula- tion.
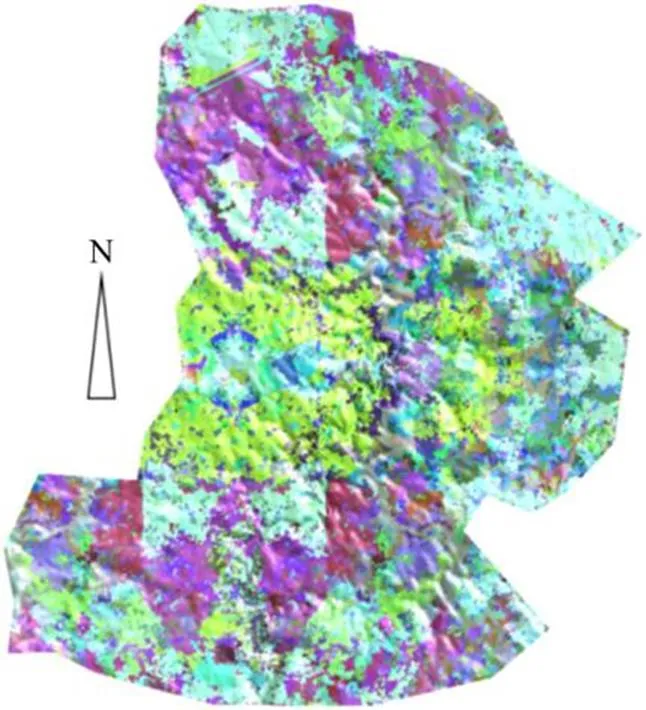
Fig.2(Color online) Land uses automatically assigned
Two numerical experiments were carried using Iber. In the first one, the entire area of the impound- ment was analysed considering the crest of the dam to be 350 m.a.s.l. (18 m above its real value) and the gates of the spillways were closed. The boundary con- dition was an inlet flow of 4 000 m3/s located 50 km upstream, which was kept constant during the si- mulation. This inlet flow corresponds to the maxi- mum expected flow of the Mi?o river defined in the technical specifications of the dam. This experiment allows analyzing the time needed for water to reach the top of the real structure (332 m.a.s.l.) under extre- me inflow conditions. In the second experiment a more detailed simulation of the area near the dam was considered by reconstructing the original bathymetry of the impoundment using old topographic maps and QGIS. The inlet condition in the vicinity of the dam (see Fig. 3, upper panel) corresponds to the values provided by the first experiment. The second experi- ment was split into two steps. In the first step the gates of the spillways were closed and they were opened in the second step once water elevation reached the crest of the original dam (332 m.a.s.l.). The outflows were modelled by means the tool culvert defined by Iber, which computes the flow between the starting and the ending points of the culvert using Eq. (4) (Manning’s equation).
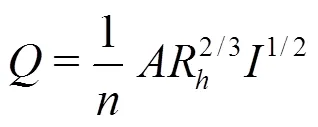
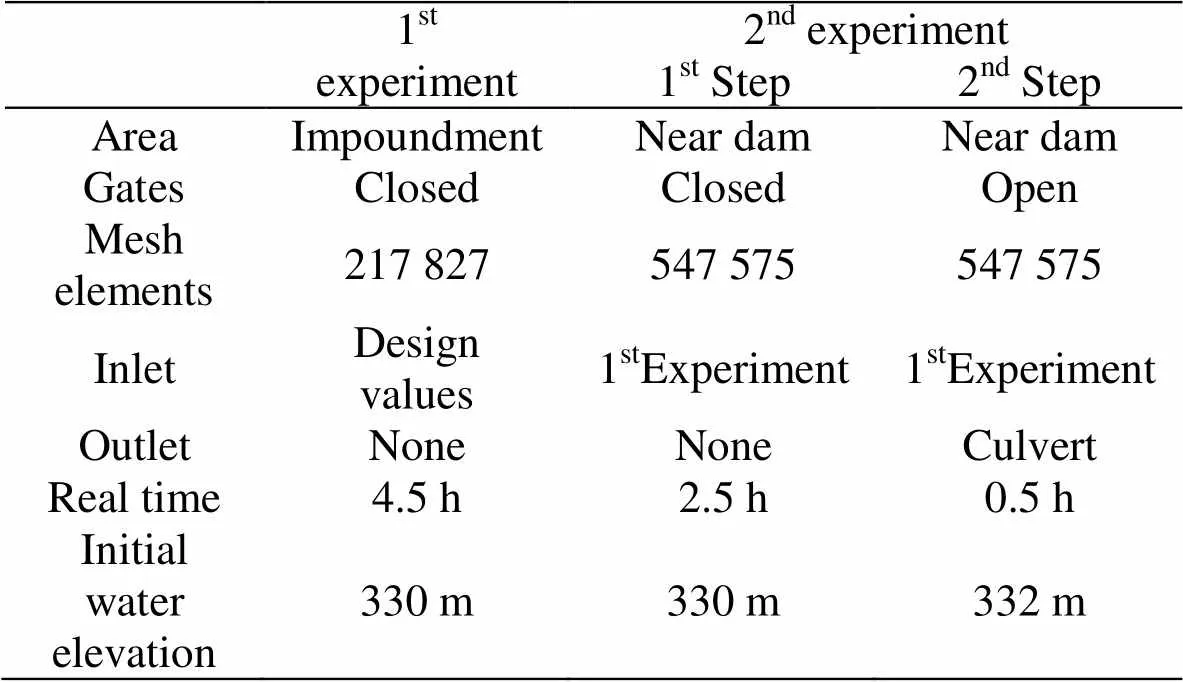
Table1Main features of the numerical experiments carried out with Iber
Figure 3 shows the area defined for the different experiments.
2.2 DualSPHysics
DualSPHysics is a numerical code based on the smoothed particle hydrodynamics (SPH) method con- ceived to be used for real engineering problems. The model is open source and can be freely downloaded from http://www.dual.sphysics.org. DualSPHysics includes a software that can be run on either CPUs or GPUs (graphics cards with powerful parallel compu- ting). GPUs offer greater computing power than CPUs, and they are a suitable an affordable option to accele- rate SPH modelling. The package also includes pre- processing and post-processing tools. A complete des- cription of DualSPHysics can be found in Crespo et al.[6].
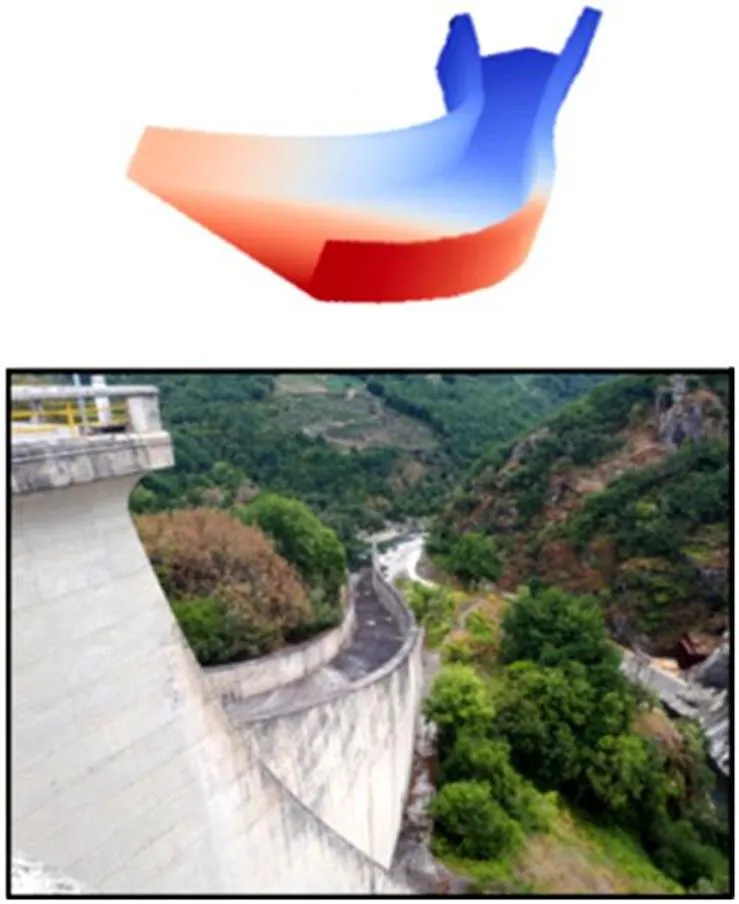
Fig.4 (Color online) Geometry of the left spillway ofBelesar dam obtained with Blender (upper panel) and real image of the spillway (lower panel)
DualSPHysics has been widely used to analyse- water flows under extreme conditions.[9-11, 15-17]. The walls of the spillway were discretised using Dynamic Boundary Conditions[18]. A new functionality of DualSPHysics allows the user to define inlet condi- tions imposing velocity, density or water depth[19]. Inlet conditions with prescribed velocity were used in this work.
Only the left spillway whose real and numerical geometry is shown in Fig. 4, was considered in the present study. The initial interparticle spacing defined for the numerical simulations carried out with DualSPHysics was equal to 0.3 m (1.76′105particles) being the physical time to be simulated 30 s.
3. Results and discussions
3.1 Simulation of the reservoir using Iber
Figure 5 shows the time series of water elevation near the left spillway obtained in the first experiment with Iber. Water elevation was observed to be similar atbothspillways.Theelevationoftherealcrest(332 m.a.s.l.) was reached at time equal to 4.2 h, which marks the maximum time to open the flood- gates to prevent dam failure by overtopping under extreme river discharge.
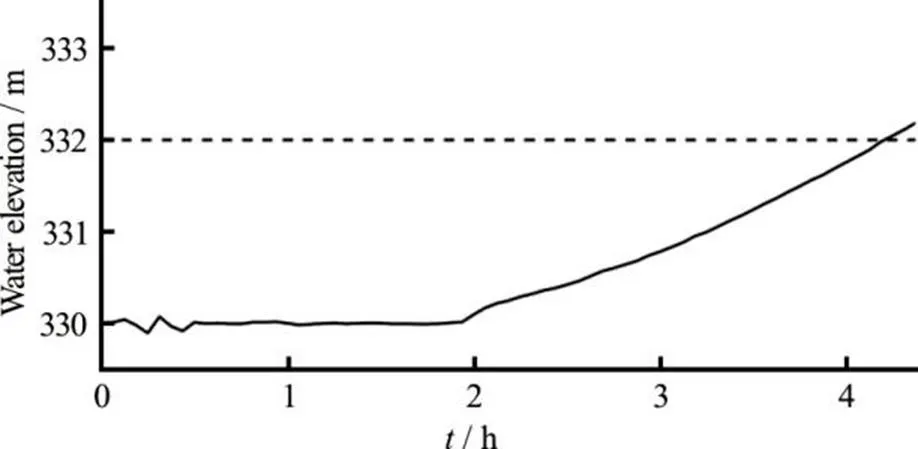
Fig.5Water elevation near the left spillway obtained in the first experiment using Iber. The dashed line represents the elevation of the real crest of the dam (332 m.a.s.l.)
Fig.6Inflow condition for the detailed simulation of the dam area
Once the water elevation was obtained, a second experiment was carried out considering only the area of the impoundment close to the dam. In this simula- tion the original bathymetry of the valley was re- constructed. The boundary condition (inflow) was obtained from the first experiment (Fig. 6). As we mentioned above, the second experiment was split into two steps: in the first one the gates of the spillways remained closed whilst in the second one the gates were opened.
Figure 7 shows the water elevation and the velocity of the flow through the left spillway obtained in the second experiment. Water elevation is observed to reach the crest a time close to 2.5 h. During that interval, the velocity of the flow was equal to zero. At that moment, the gates of the spillways were opened and water elevation near the dam started to decrease and velocity reached its peak value (close to 3.2 m/s), decreasing from then on. The peak value of velocity obtained in this experiment was used as a boundary condition for the simulation of the left spillway using DualSPHysics.
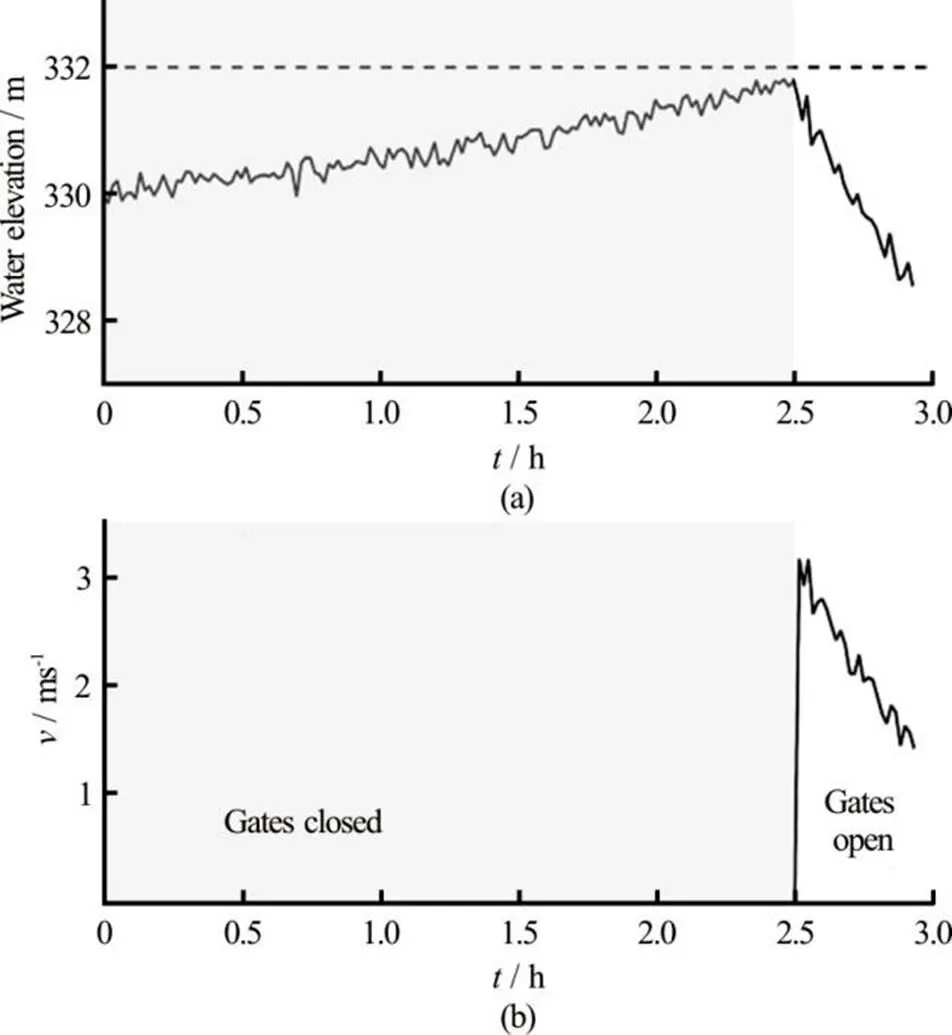
Fig.7Water elevation (upper panel) and velocity at the left spillway (lower panel) obtained in the second experiment. The shaded area represents the time interval when gates were closed. The dashed line in the upper panel repre- sents the crest elevation
3.2Simulations of the left spillway using Dual- SPHysics
3.2.1 Modelling simplified spillways
Prior to compute the behavior of a real spillway, different simulations using simplified 2-D spillways were carried out to verify the accuracy of Dual- SPHysics. The first one corresponds to a typical ogee spillway and the second one corresponds to a crested weir. Numerical simulations obtained with Dual- SPHysics were compared with experimental data (Fig. 8). In the upper panel, the 0-line represents the vertical wall of the ogee spillway and in the lower panel the red rectangle represents the lateral view of the broad crested weir, being the water profiles provided by DualSPHysics similar to those obtained in the experi- mental tests. These results shows that DualSPHysics is a suited tool to analyse flows on spillways. Additional details on the experiment can be found in the work by Husain et al.[20].
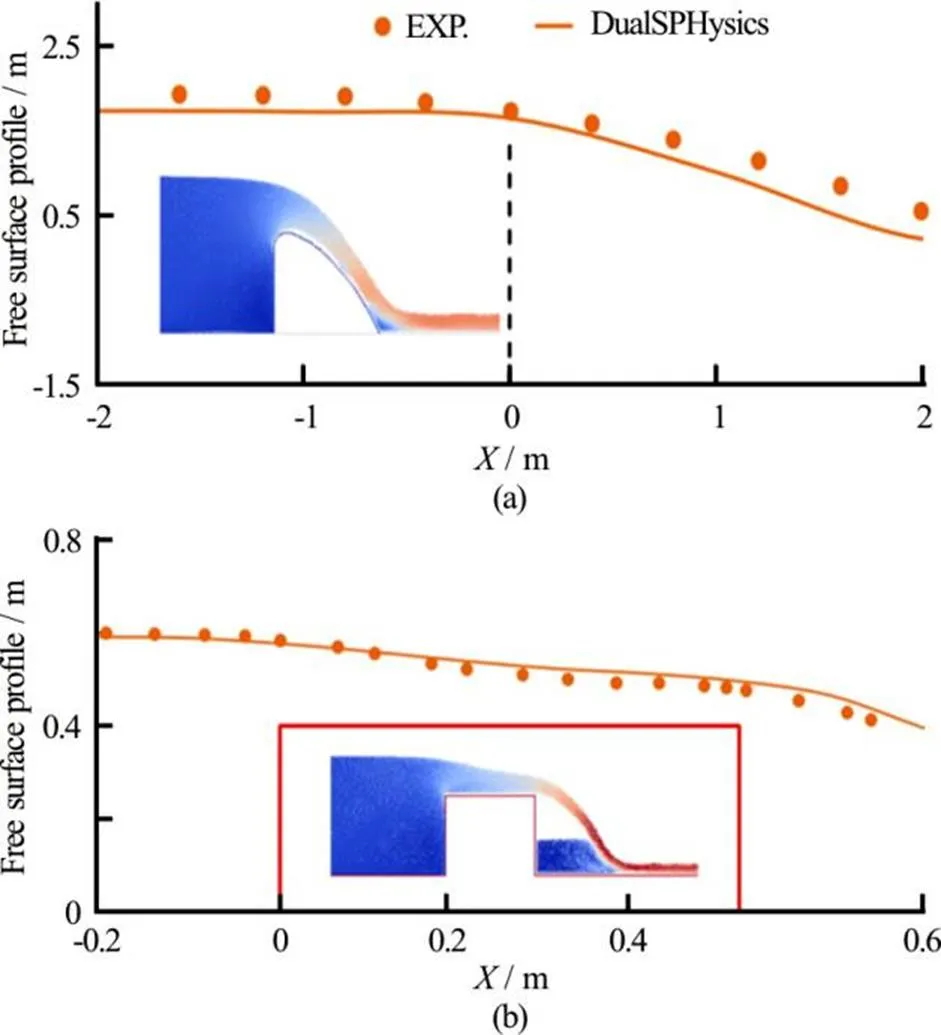
Fig.8 (Color online) Experimental free surface profile (dots) and obtained using DualSPHysics (solid line) for two different spillways: ogee spillway (upper panel) and broad crested weir (lower panel)
3.2.2 Simulation of the left spillway
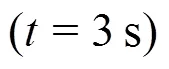
Once the results of DualSPHysics were checked for simplified geometries, the numerical simulation of the Belesar spillway was carried out. The inlet con- dition in DualSPHysics is defined using the peak velocity obtained from the Iber outflow (see Fig. 7, lower panel). Figure 9 shows three different snapshots of the spillway simulated with DualSPHysics.
Time series of water depth and velocity were computed at five different distances from the crest of the spillway. Two control points were defined for each distance, on the right and left side of the spillway. The location of the control points is shown in Fig. 10.
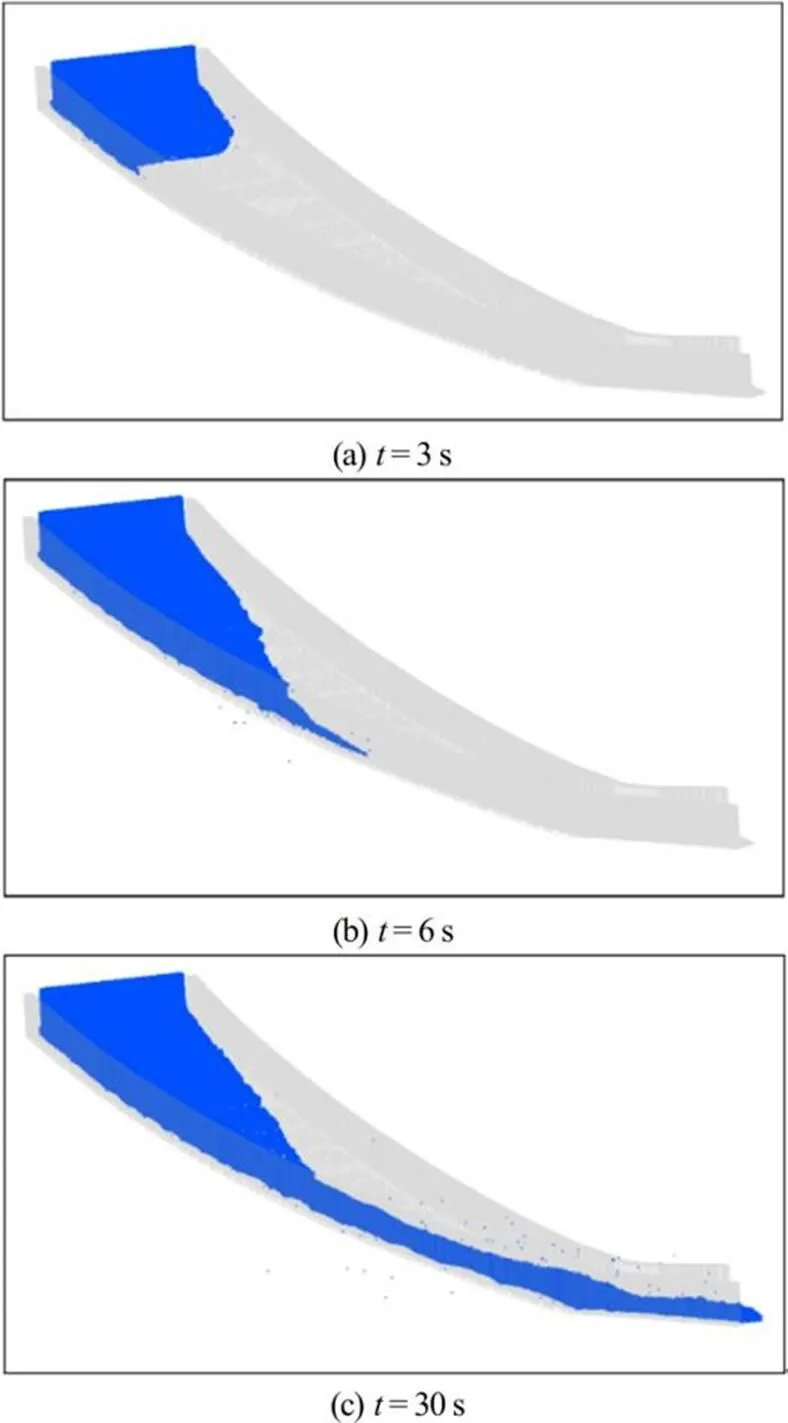
Fig.9 (Color online) Different snapshots of the numerical si- mulation of the left spillway of Belesar dam using DualSPHysics
Fig.10 Location of the control points on the spillway
The time series of water depth and velocity obtained at three points on the right side of the spill- way are shown in Fig. 11. A steady state is reached for times longer than 11 s.
The maximum values of water depth and velocity are shown in Fig. 12.
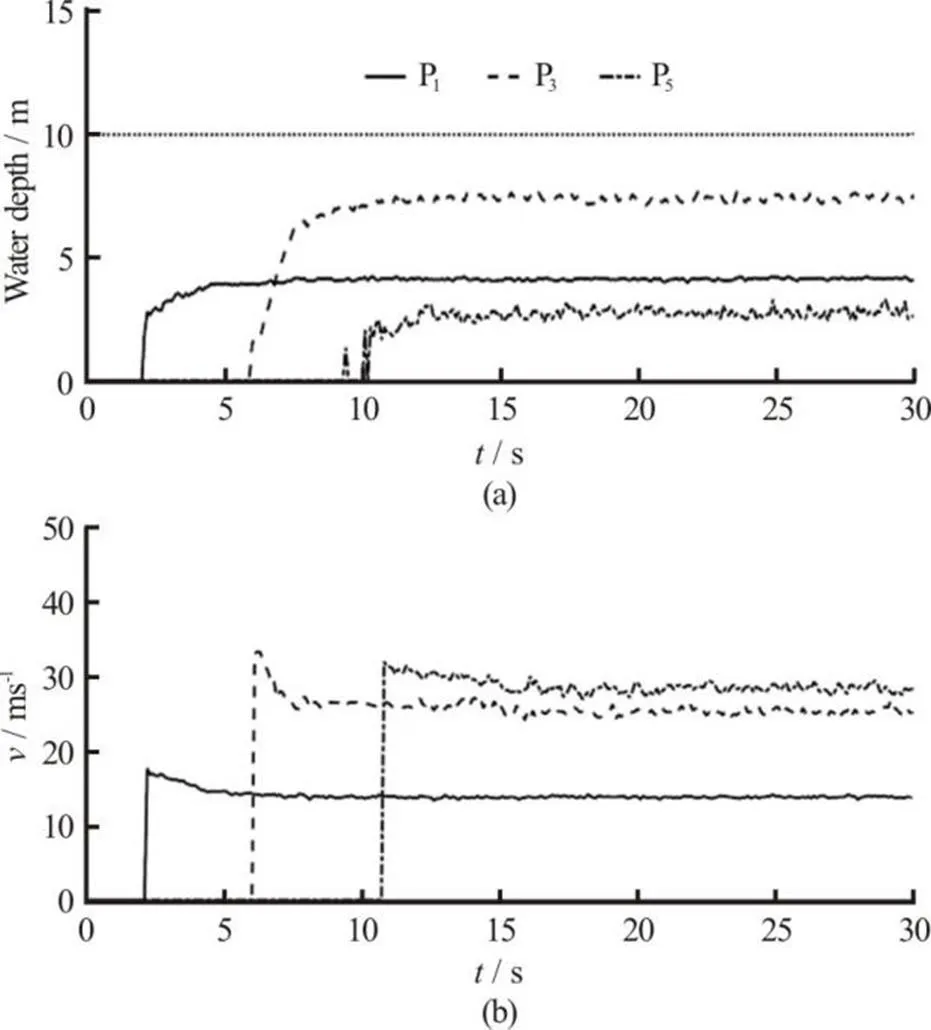
Fig.11 Time series of water depth (upper panel) and velocity (lower panel) obtained with DualSPHyics at three locations on the right side of the spillway. The dotted line in the upper panel represents the height of the lateral walls of the spillway
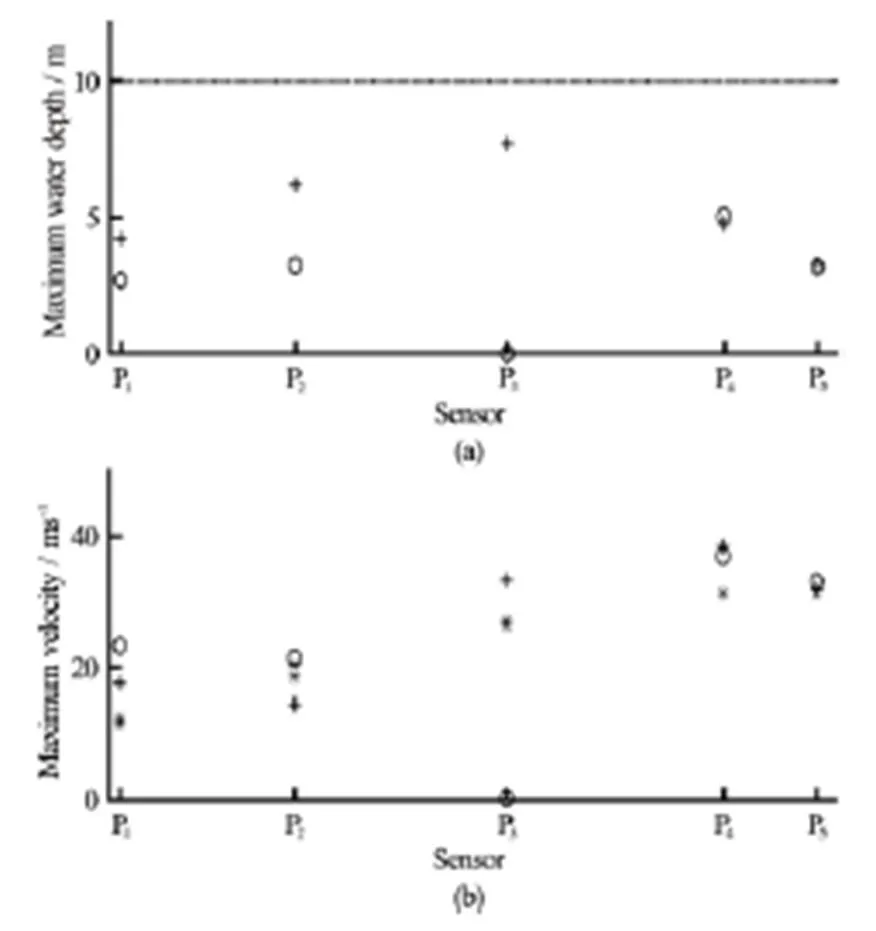
Fig.12 Maximum values of the water depth (upper panel) and velocity (lower panel) obtained on the right (cross) and left side (circle) of the spillway using DualSPHyics. The dotted line in the upper panel represents the height of the lateral walls of the spillway. Asterisks represent the theoretical values of velocity
Water depth is clearly asymmetric, at least until the middle part of the spillway (P3). Water tends to accumulate on the rightside, with depth increasing from P1to P3. On the other hand, water depth is lower on the left side. Actually, pointP3remains dry during the whole simulation. After the middle part of the spillway (points P4and P5), water depth attains a steady value near 4 m on both sides. Note that water depth is considerably lower than the lateral walls of the spillway (10 m high) and no overtopping was observed during the under the analysed conditions.
4. Conclusions
In this work a mesh-based code, Iber, and a mesh-less code, DualSPHysics, were used together to analyse the safety of Belesar dam.
The inlet conditions for DualSPHysics simulation were obtained from results previously obtained with Iber. DualSPHysics showed that the spillway works properly even under extreme conditions. Water depth was computed at five different positions inside the spillway, being the maximum water depth conside- rably lower than the height of the lateral walls of the spillway, so no overflow is observed.
In summary, the paper shows that the combina- tion of Iber and DualSPHysics constitutes a reliable methodology that can be applied by engineers, nume- rical modelers and public institutions to analyse the hydrological safety of a wide range of dams.
Acknowledgements
This work is partially supported under projects IMDROFLOOD (Water JPI-WaterWorks 2014), Pro- grama de Consolidación e Estructuración de Uni- dades de Investigación Competitivas (ED431C 2017/ 64) and Risc ML (Interreg Program, European Regio- nal Development Fund, ERDF). One of the authors, A. J. C. C., is funded by a Ramón y Cajal grant of the Ministerio de Economía y Competitividad del Gobier- no de Espa?a (RYC-2013-12617). One of us, J. G. C., wants to acknowledge Dr. Luis Cea for helpful dis- cussions.
[1] De Michele C., Salvadori G., Canossi M. et al. Bivariate statistical approach to check adequacy of dam spillway [J]., 2005, 10(1): 50-57.
[2] Tung Y.K. Some recent progress im uncertainty analysis for hydraulic design [R]. Laramie, USA: University of Wyoming, 1993.
[3] Brown C.A., Graham W. J. Assessing the threat to life from dam failure [J]., 1988, 24(6): 1303-1309.
[4] Betamio de Almeida A., Viseu T. Dams and valleys safety: A present and future challenge [C].,Lisbon, Portugal, 1996.
[5] Bladé E., Cea L., Corestein G. et al. Iber: Herramienta de simulación numérica del flujo en ríos [J]., 2014, 30(1): 1-10.
[6] Crespo A.J.C., Domínguez J.M., Rogers B.D. et al. DualSPHysics: Open-source parallel CFD solver on SPH [J].,2015, 187: 204-216.
[7] Bonasia R., Areu-Rangel O.S., Tolentino D. et al. Floo- ding hazard assessment at Tulancingo (Hidalgo, Mexico) [J]., 2017, https://doi.org/10.1111/jfr3.12312.
[8] Areu-Rangel O.S., González-Cao J., Crespo A.J.C. et al. Numerical modelling of hydrological safety assignement in dams with IBER [J]., 2017, (4): 1-12.
[9] Altomare C., Crespo A.J.C., Rogers B.D. et al. Nume- rical modelling of armour block sea breakwater with smoothed particle hydrodinamics [J].,2014, 130(1): 34-45.
[10] Altomare C., Crespo A.J.C., Domíguez J.M. et al. App- licability of smoothed particle hydrodinamics for estima- tion of sea wave impact on coastal structures [J]., 2015, 96: 1-12.
[11] Barreiro A., Domínguez J.M., Crespo A.J.C. et al. Inte- gration of UAV photogrammetry and SPH modelling of fluids to study runoff on real terrains [J]., 2014, 9(11): e111031.
[12] QGIS Development Team. QGIS geographic information system [R]. Open Source Geospatial Foundation Project, 2016.
[13] Blender. https: www.blender.org [EB/OL]. 2017.
[14]González-Cao J., García-Feal O., Crespo A.J.C. et al. Predicción de inundaciones originadas por precipitaciones extremas mediante el módulo hidrológico de Iber [C]., La Coru?a, Spain, 2017.
[15]Domínguez J.M., Crespo A.J.C. et al. New multi-GPU implementation for smoothed particle hydrodynamics on heterogeneous clusters [J]., 2013, 184(8): 1848-1860.
[16]Altomare C., Domínguez J.M., Crespo A.J.C. et al. Long- crested wave generation and absorption for SPH-based DualSPHysics model [J]., 2017, 127: 37-54.
[17]Canelas R.B., Crespo A.J.C., Domínguez J.M. et al. SPH-DCDEM model for arbitrary geometries in free surface solid-fluid flows [J]., 2016, 202: 131-140.
[18]Crespo A.J.C., Gómez-Gesteira M., Dalrymple R.A. Boundary conditions generated by dynamic particles in SPH methods [J]., 2007, 5(3): 173-184.
[19] Tafuni A., Dominguez J.M., Vacondio R. et al. Accurate and efficient SPH open boundary conditions for real 3-D engineering problems [C]., Orense, Spain, 2017.
[20] Husain S.M., Muhammed J.R., Karunarathna H.U. et al. Investigation of pressure variations over stepped spillways using smooth particle hydrodinamics [J]., 2014,66(2):52-69.
[21] Bureau of Reclamations. Design of small dams [M]. Third Edition, Denver, Colorado, USA: Bureau of Reclamations, 1987.
(October 30, 2017, Accepted December 19, 2017)
?China Ship Scientific Research Center 2018
J. González-Cao (1976-), Male, Ph. D.
J. González-Cao,
E-mail:jgcao@uvigo.es

- 水動力學研究與進展 B輯的其它文章
- Overview of SPH-ALE applications for hydraulic turbines in ANDRITZ Hydro*
- Impacts of bridge piers on water level during ice jammed period in bend channel–An experimental study *
- DualSPHysics: A numerical tool to simulate real breakwaters *
- SPH numerical investigation of the characteristics of an oscillating hydraulic jump at an abrupt drop *
- Five-equation and robust three-equation methods for solution verification of large eddy simulation *
- High-speed water impacts of flat plates in different ditching configuration through a Riemann-ALE SPH model *