
Orthogonal analysis of the influencing factors of gas-solid two-phase jet particles
2020-11-02 13:34SONGXinhuaLIUZhenfengLIXiaojieYANHonghao
實驗流體力學 2020年5期
SONG Xinhua, LIU Zhenfeng, LI Xiaojie, YAN Honghao
(State Key Laboratory of structural analysis for industrial equipment, Dalian University of Technology, Dalian Liaoning 116024, China)
Abstract:Since the gas-solid two-phase particle injection technology is widely used, it is of great engineering significance to study its influencing factors.Firstly, to inverstigate two factors, pre-ssure and mass, experiments are arranged by the orthogonal experimental design principle.Then, based on the CFD-DEM (Computational Fluid Dynamics / Discrete Element Method) model, the FLUENT software is used for numerical simulation, and the results are analyzed by range analysis and variance analysis.Finally, a set of jet experiments is designed to obtain the particle injection trajectory, and the photographs are processed by color histogram.The following conclusions are drawn: the influence of pressure is greater than that of mass by range analysis and variance analysis, and the mean value is the smallest when the pressure is 0.3 MPa and the mass is 2 g.When the pressure is 0.3 MPa and the mass is 2 g, the injection effect is optimized, and the shooting effect is the best, which is consistent with the results of numerical simulation.
Keywords:gas-solid two-phase;orthogonal analysis;CFD-DEM;numerical simulation;color histogram
0 Introduction
Gas-solid two-phase particle injection is widely used in agriculture, industry and engineering.Dintwa et al.[1〗described a simulation model of a spinning disc fertilizer spreader, developed for incorporation into an automatic control system, and obtained the movement track and distribution characteristics of fertilizer throwing.Villette et al.[2]defined a mathe-matical model of fertilizer particle motion on a spinning disc, and the study results in an analytical solution for a concave disc equipped with pitched straight vanes.Lei et al.[3]designed a screw combined centralized fertilizer-feeding device for granular fertilizer and determined the key structural parameters of inclined spiral hole.Najjar et al.[4]developed a flexible simulation framework, in which multiphase flow computations are performed that include three-way coupling among phases (mixture-droplet-smoke), conservative coupling approach, and full heat release for the burning mechanisms.Liu and Xing[5]used Euler-Lagrangian method to simulate the gas-solid two-phase flow field in the thrust vector nozzle of solid rocket motor, and studied the effect of solid particles on the thrust vector performance of the nozzle.Xie et al.[6]obtained the structural design formula of pneumatic conveying gas-solid ejector by using the hydrodynamics and empirical formulas of gas-solid two-phase flow, and studied the influence of structure and parameters on the performance of gas-solid ejector.In the primary air passage of a new type of once-through burner of a coal-fired boiler, Huang used a three-dimensional particle dynamic analyzer (3D-PDA) to measure the gas-particle two-phase flow.The gas-solid two-phase velocity distri-bution, turbulent kinetic energy distribution, particle diameter and particle concentration distribution were obtained in the primary air passage[7].Li et al.[8]characterized the effect of oxidation temperatures on the microstructure and micro hardness of Ni/Al2O3composite coatings, as-cold-sprayed and vacuum heat-treated.Hua et al.used discrete phase model and spray rate model to simulate the release and flow process of fire extinguishing agent particles, and analyzed the movement characteristics of ultra-fine particle fire extinguishing agent with particle size of 1~12 μm under obstacles.And the reference valueR(t) and evaluationAwere introduced to quantitatively evaluate the movement characteristics of 1~12 μm ultrafine particle fire extinguishers[9].Li et al.[10]proposed a hybrid (deterministic/stochastic) fundamental model for the major physico-chemical processes involved in an industrial HVOF thermal spray process (Diamond Jet hybrid gun, Sulzer Metco, Westbury, NY, USA).Zhang et al.simu-lated the gas-solid ejector based on the particle trajectory model.The ejection performance was analyzed by using the number of particles ejected from the ejector, the number of remaining particles and the trajectory of particles.It is found that the inlet diameter of the contraction nozzle in the gas-solid ejector has a certain influence on the injection performance[11].Wang et al.[12]used FLUENT software to simulate the hydrodynamic characteristics of gas-solid two-phase flow in a boiling bed of titanium slag spouted bed, and analyzed the flow characteristics and zoning characteristics of gas-solid two-phase flow under different blowing speeds.Wang et al.used a three-component particle-dynamics anemometer to measure the characteristics of two-phase gas-particle flows in a primary air nozzle using a gas/particle two-phase test facility.The jet trajectory of primary air velocities, Reynolds stress and particle concentration profiles were obtained.Based on this, the advantages and disadvantages of increasing the offset angle were analyzed to optimize performance[13].Wang et al.[14]had presented a measurement method to obtain the solid phase particle size and the concentration of gas-solid two-phase flow, based on optical principle and image processing, and an experimental system was built.
With the development of gas-solid two-phase particle injection technology, it is of great value to study the factors affecting particle injection.Many scholars have studied particle injection factors such as nozzle exit velocity, nozzle distance, nozzle size, injection angle[15-17].However, the factors of the injection pressure and particle quality are not studied.Therefore, based on previous research, this paper combines numerical simulation with orthogonal design theory, and analyzes the influence of spray pressure and particle quality on gas-solid two-phase particle injection.Moreover, it is proved by experiments that this method provides a theoretical reference for the practical application of injection technology.
1 Fundamental theory
1.1 Orthogonal experimental design principle
Orthogonal experimental design is a multi-factor and multi-level design method.According to the orthogonality, some representative points are selected from the comprehensive experiment to carry out the experiment.These points have the advantages of uniform dispersion, neatness and comparability[18-20].In this paper, there are two factors, the injection pressure and the particle mass, and each factor has four levels.The specified parameters of orthogonal table used is listed in Table 1.

Table 1 Specified parameters表1 具體參數的選取
1.2 CFD-DEM model
The CFD-DEM model uses the averaged Navier-Stokes equation to describe the motion of the gas phase, and uses Newton’s Second Law to describe the motion of the particle phase[21].The governing equation for the CFD-DEM model is[22]:
The equation of motion of the particles:
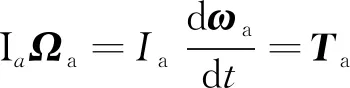
(1)
Where,mais the particle quality,rais the particle position,Vais the particle volume,pis the pressure,βis the interphase drag coefficient,εgis the gas phase concentration,ugis the gas phase macro speed,vsis the speed of a single particle,gis the acceleration of gravity,Fcont,ais the contact force from the particles collision.Fvdw,ais van der Waals force,Tais the moment,Iais the moment of inertia,Ωais the rotational acceleration, andωais the rotational speed.
The collision force between two particles is given by,
Fab,n=-knδnnab-ηnvab,n
δn=(Ra+Rb)-|rb-ra|
(2)
Where,Fab,nis the normal contact force when the particles collide,knis the direction stiffness coefficient,δnis the shape variable when the particles collide,nabis the normal unit vector,ηnis the normal damping coefficient,vab,nis the normal relative speed,RaandRbrepresent the particle radii of the particle a and b, respectively.raandrbare the positions of the particle a and b, respectively.
The mass conservation equation and the momentum conservation equation for the gas phase are as follows,
-εgp-Sp+·(εgτg)
(3)
Where,ρgis the gas phase density andτgis the gas phase stress.
The gas-solid phase drag force is given by,
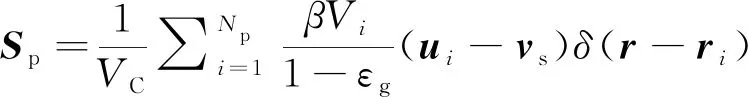
(4)
VCis the volume of the calculation grid, and the phase drag coefficientβis given by,
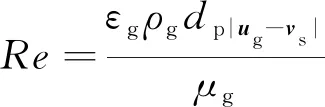
(5)
The ideal gas state equation is as follow,
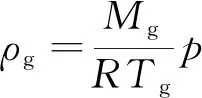
(6)
Where,dpis the particle diameter,Mgis the molar mass of the gas,Ris the molar gas constant, andTgis the gas phase temperature.
The gas phase stress constitutive relationship is as follow,

(7)
Where,μgis the shear viscosity of the gas phase, andIrepresents an identity matrix.
2 Numerical simulation
2.1 Fluid calculation model
In this study, the average diameter of granules used in numerical simulation and experiment is 10.67 μm, spherical starch-like granules.When the pressure is 0.2~0.5 MPa, according to the Bernoulli equation[23], the energy conservation equation of one-dimensional defined flow under isentropic conditions is[24-25]:

(8)
The isentropic equation is:
p=Aργ
(9)
According to Eq.(8) and Eq.(9), the jet velocity is:
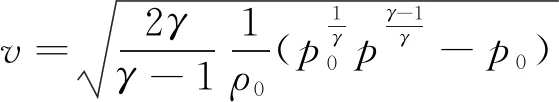
(10)
For air,γ=1.4[24],ρ0=1.185 kg/m3[26],p0=0.1 MPa.Whenp=0.2 MPa, the substitution formula (10) calculatesv0.2=359.7 m/s.Similarly, we can getv0.3=466.7 m/s,v0.4=535.7 m/s,v0.5=587.3 m/s.In addition, the diameter of the air compressor outlet piped1=0.008 m, and the diameter of the nozzled2=0.05 m.v′0.2≈v0.2×(d1/d2)2≈9.2 m/s, and the effective injection velocitiesv′ are 9.2, 11.9, 13.7 and 15.0 m/s, respectively.Since the flow rate is less than 0.6 to 0.8 times of the speed of sound, the air can be regarded as an incompressible fluid during the simulation[27], and the reference atmospheric pressure is one atmosphere.The FLUENT is used to calculate the transient jet flow field under each pressure, and the CFD-DEM coupling method is used for the simulation calculation.
In actual engineering, the air viscosity at room temperatureυ=15.06×10⁻⁶m2/s[28], and the equivalent diameterD=0.05 m.The Reynolds number is calculated:Re=vD/υ>4000, so the realizablek-εturbulence model equation is used[29].The kinetic energykand the turbulent dissipation transport equation are shown in Eq.(11):

(11)
2.2 Mesh and boundary conditions of model
2.2.1Meshgeneration
The trajectory of the particle jet into the box is studied.In order to facilitate the calculation, the model is calculated and analyzed by a two- dimensional model.The schematic diagram of the model is shown in Fig.1(a).The geometric model has two parts, the upper part is a rectangle of 1.0 m, and the lower part of the nozzle has a diameter of 0.05 m and a length of 0.1 m.

Fig.1 Schematic diagram of the model
In view of the uncomplicated characteristics of the particle injection model, a common grid structure is divided by the commonly used quadrilateral mesh, the mesh is divided by the workbench mesh, and the FLUENT software is imported for simulation calculation.The grid case is as follows: cell is 1268, face is 2611, and node is 1344.Fig.1(b) is a schematic diagram of the mesh division.
2.2.2Boundaryconditions
Each boundary condition is set according to the conditions of the sprayed particles.The initialization method selects “Standard Initialization” and selects “All-Zones”.The inlet boundary of the particle is set to “Velocity-Inlet”, and the boundary of the other face is set to “Wall”.The solid wall is no slip condition, the top wall is set to “Trap”, and the other walls are set to “Reflect”.
2.3 Analysis and discussion of simulation results
Particles were put into a rectangular frame with a diameter of 0.05 m and a length of 0.1 m.The simulation experiments were carried out according to the parameters in Table 1.The calculation steps were 500 and the particles were tracked.The simulation calculates the percentage of particle loss in each experiment, that is to say, the ratio of the number of tracked particles to the total number of tracked particles is the amount of particle loss in the simulation process.The data of the 16 computational simulations are shown in Table 2, and the percentage of loss is shown in Fig.2.

Table 2 Tracking the number of particles trapping and the total number of particles (500 steps)表2 追蹤顆粒逃逸的數量和追蹤總顆粒數量(500步)

Fig.2 Particle loss in orthogonal experiments
By performing the range analysis of the 16 experiments, the mean value of pressure and mass was the smallest when the pressure was 0.3 MPa and the mass was 2 g.The range of the pressure and the mass are 20.1% and 12.4%, respectively, indicating that the magnitude of the pressure has the greatest impact.Then the variance analysis was performed on the two factors of the pressure and the mass, as shown in Table 3.TheFratios of the pressure and the mass obtained from the variance analysis table were 1.431 and 0.569, respectively, indicating that the influence of pressure was greater.
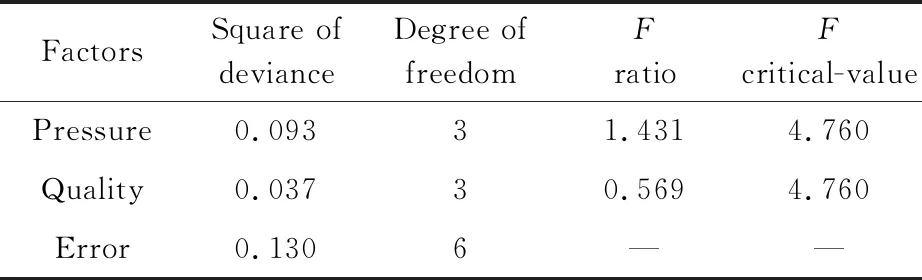
Table 3 Variance analysis of pressure and quality impact 表3 壓強和質量影響方差分析表
3 Experimental verification
3.1 Experimental device diagram
This experiment mainly observes the flow trajectory of particles under different injection pressures (The dimensions of main instruments in the experiment are shown in Fig.1).The experimental diagram is shown in Fig.3, where A is a compressed air mercury, B is a gas storage chamber, C is a pulse valve, and D is an imaging system, E is where the particles are stored.Using the pulse valve C to eject particles at E.And the instruments used in this experiment are shown in Table 4.
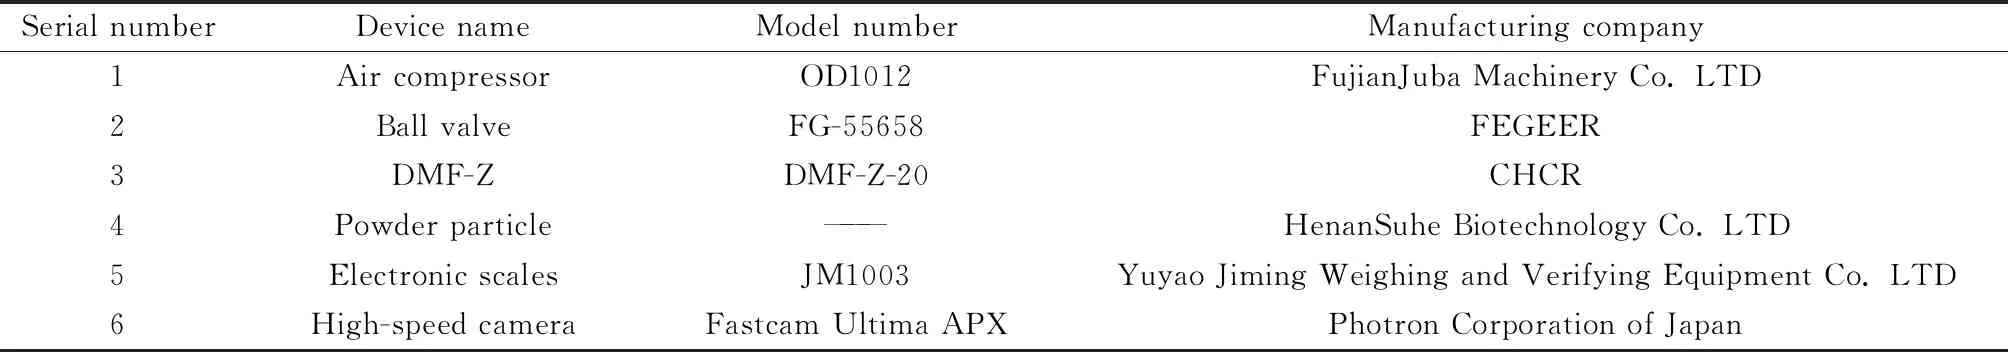
Table 4 Experimental measurement instrument list表4 實驗測量儀器清單

Fig.3 Schematic diagram of injection experiment
3.2 Analysis of experimental results
Through the above numerical simulation calcu-lation and experimental orthogonal analysis, the results are obtained.When the pressure is 0.3 MPa and the mass is 2 g, the loss optimization is achieved.The experimental parameters were taken as the above results, and the spray experiment was carried out with the designed particle ejection device, and then the image was taken by the imaging system.
Finally, the image color histogram processing was performed on the captured image[30-31], and the ejection trajectory diagram is shown in the left of Fig.4.Select the captured particle ejection images to perform image color histogram processing.Considering that the RGB color space does not conform to the human perception of color, the HSV space is visually sensed to quantify the HSV space and then its histogram is calculated to reduce the amount of calculation.The color space is converted from RGB to HSV by the rgb2hsv function in MATLAB.The HSV grayscale image obtained by processing the image is shown in the right of Fig.4.
From Fig.2, we can see that Exp.1, Exp.6 and Exp.8 are the three groups with the lowest particle loss, which are 12.46%, 9.76% and 8.88% respectively.However, the optimal combination obtained by variance analysis is Exp.6.Then the injection experiment was taken on the spot when the pressure was 0.3 MPa and the mass was 2 g.At this time, the whole process of particle injection from the beginning to the top of the box could be captured, so the shooting effect was considered to be the best.The results are in agreement with those obtained by orthogonal experimental simulation, as shown in Fig.4.

Fig.4 Numerical simulations of the sprayed particles and the trajectory of the shot (P=0.3 MPa, m=2 g)
4 Conclusion
The two factors, the pressure and the mass, which affect the gas-solid two-phase jet particles were studied and analyzed.The 16 simulation experiments were arranged based on the principle of orthogonal experimental design.Then, based on CFD-DEM model, FLUENT was used for numerical simulation, and the simulation results were analyzed by orthogonal test.Finally, a set of gas-solid injection device was designed to carry out the injection experiment, and the color histogram of the image was processed.The following conclusions are drawn:
The range of the pressure and the mass is 20.1% and 12.4%, respectively.TheFratios of pressure and mass are 1.431 and 0.569, respectively.Both methods show that the effect of pressure is greater than that of mass, and the mean value is the smallest when the pressure is 0.3 MPa and the mass is 2 g.
The image of the particle injection trajectory captured by the injection experiment was processed by color histogram and compared with the trajectory obtained by numerical simulation.The results show that when the pressure is 0.3 MPa and the mass is 2 g, the injection effect is optimized, and the shooting effect is the best.
Acknowledgements:This project was financially supported by the National Natural Science Foundation of China (11672068, 11672067).
猜你喜歡
現代儀器與醫療(2022年4期)2022-10-08
現代儀器與醫療(2022年4期)2022-10-08
現代儀器與醫療(2022年3期)2022-08-12
現代儀器與醫療(2022年2期)2022-08-11
材料與冶金學報(2022年2期)2022-08-10
河海大學學報(自然科學版)(2022年1期)2022-02-11
汽車零部件(2021年12期)2021-12-29
小學生學習指導(低年級)(2019年3期)2019-04-22
初中生世界·七年級(2017年2期)2017-01-20
小獼猴智力畫刊(2016年6期)2016-05-14