
Investigating the characteristic delay time in the leader-follower behavior in children single-file movement
2023-03-13 09:20ShuQiXue薛書琦NirajanShiwakotiXiaoMengShi施曉蒙andYaoXiao肖堯
Chinese Physics B 2023年2期
Shu-Qi Xue(薛書琦) Nirajan Shiwakoti Xiao-Meng Shi(施曉蒙) and Yao Xiao(肖堯)
1School of Modern Posts,Xi’an University of Posts and Telecommunications,Xi’an 710061,China
2School of Engineering,RMIT University Carlton,Victoria 3053,Australia
3Jiangsu Key Laboratory of Urban ITS,Jiangsu Province Collaborative Innovation Center of Modern Urban Traffic Technologies,School of Transportation,Southeast University,Nanjing 211189,China
4School of Intelligent Systems Engineering,Sun Yat-sen University,Shenzhen 510275,China
Keywords: speed matching,speed correlation,curvature,following behavior
1.Introduction
The one-dimensional pedestrian flow, in which pedestrians walk along a line and hardly overtake others,usually refers to single-file flow in the literature.It might be one of the most heavily investigated topics in pedestrian dynamics,and a vast amount of research works emerge from analyzing the singlefile flow from different aspects.
Among them, the fundamental diagrams, namely, the pairwise relationships among flow rate, speed, and density(headway),have been the central problem of these researches from the very beginning.[1]In the work of Seyfriedet al.,[1]they presented a single linear relationship between the speed and the inverse of the density.While in later research,[2]it was found that there were three linear regimes with different slopes that could be distinguished from the speed-headway plots when the observed density range expanded.This existence of three regimes for the speed-headway relationship was further confirmed by the following research.[3]However,it had been shown that the fundamental diagrams of single-file pedestrian flow presented nonnegligible variations depending on various external and internal factors.Chattarajet al.[4]investigated the cultural effects on the fundamental diagrams of single-file flow, and they conducted a comparison study between the German and the Indian participants.The results showed that the walking speeds of the Indian pedestrians were higher than those of Germans due to the smaller acceptable personal space for the Indian pedestrians.Further,in the work of Jinet al.,[5]they confirmed the cultural effect on walking characteristics.They found that their experiment’s flow rate with the Chinese pedestriansis closed to the Indian results and larger than the German results.The background music and rhythm were also influential factors for the fundamental diagram of single-file flow.Yanagisawaet al.[6]found that a suitable rhythm that is slower than the normal-walking pace of pedestrians in the free-flow situation could increase the flow rate in a congested situation.In a recent study by Zenget al.,[7]it observed that the effects of background music were associated with the kinds of music(namely,motivational music with a fast tempo and non-motivational music with a slow tempo) and the instructions on how to react to the music (to follow the beat of the music or not).
Besides, the individual characteristics, such as age,height, and gender, were all considered to impact the movement characteristics and thus affect the fundamental diagrams.Renet al.[3]conducted a single-flow experiment with the elderly group aged from 52 to 81 years old and compared the results with the results of the younger group in the work by Jeli′cet al.[2]Their findings suggested that the elderly generally walked more slowly than the younger,especially in highdensity conditions (headway is smaller than 1.1 m).The duration and times of stopping of the elders were increased to pursue a longer headway to restart their movements in those experiments.In the work of Wanget al.,[8]they suggested that male and female students required different personal spaces in walking under different walking conditions.In addition, the effect of gender on step frequency was significant for younger students.However,there are contradictive conclusions on the effects of gender and age in the research field.Paetzkeet al.[9]integrated the results of single participants appearing in different runs in their experiment, which was similar to the experiment mentioned in the work of Wanget al.[8]The individual fundamental diagrams were introduced and analyzed using multiple linear regression.Their results showed that gender has a weak effect on the speed-headway relations of the pedestrians in the experiment.Caoet al.[10]investigated the stepping behavior of pedestrians from different age groups(young adults aged from 16 to 18 years old and older adults aged from 45 to 73 years old).They indicated that gender and height have no significant influence on the fundamental diagrams for both age groups.Another experimental study conducted by Subaihet al.[11]with the Palestinian pedestrians found that with exclusively male or female groups, gender has no effect on the pedestrians’speed in the single-file movement,but when male and female pedestrians walked in a mixed-gender group,their speeds decreased due to social conventions.
Further, the fundamental diagrams are linked with the stepping characteristics of the pedestrians, including step length, step duration (frequency), and step synchronization.There is a lot of research dedicated to this field of study.Jeli′cet al.[12]revealed that the variation of the speed of the pedestrians is mostly induced by the adaption of step length rather than the step duration (step frequency), indicating pedestrians probably do not like to modify their stepping pace rapidly.In contrast, in the work of Caoet al.,[10]there was a notably monotonically decreasing trend for step duration with the increase of velocity,indicating that the pedestrians would increase speed by reducing step duration.Fanget al.[13]found that the step length, as well as step frequency,decreased with the increasing global density in their singlefile flow experiment.Besides, a linear relationship was identified between the step frequency and the spatial headway.In the work of Maet al.,[14]they confirmed the piecewise linear behavior between the step length(duration)and the spatial headway.The relationship between the step duration and the step velocity was nonmonotonous.In contrast, the relationship between step length and the step velocity is monotonous and can be described by a quartic function.Step synchronization, also referred to as locked steps in the literature, is frequently observed in the single-file movement of pedestrians.Jeli′cet al.[12]showed that the synchronization effects are notable at large densities (beyond 1.25 ped/m) due to the constrained waking space in front.In the work of Wanget al.,[15]they revealed two patterns of synchronization for two successive walking pedestrians in their experiments: one is that pedestrians stepped synchronously with the same side feet(left or right)as their predecessors,and another type is that the followers stepped synchronously with opposite feet with their predecessors.Besides,they also suggested an increasing trend in the proportion of step synchronization with the increase of density.In the work of Maet al.,[16]they revealed that spontaneous synchronization is most likely to be activated at a determined characteristic spatial headway of 1.15 m, at which the insufficient safety distance enables the pedestrians to synchronize their footstep with their predecessors to avoid the possible inter-person collisions.
1.1.Motivation and the objective of the study
The walking dynamics of pedestrians in the single-file experiment can be analyzed and understood from the perspective of follow-the-leader behavior,similar to the car-following theory in the vehicle flow.Rioet al.[17]designed an experiment to examine how a pedestrian visually controlled speed when following a leader, in which the participants were required to walk behind a leader who would randomly increase or decrease his walking speed.Based on the experimental results,they checked six models that were derived from the carfollowing models.It was found that the following behavior was best described by a simple speed-matching model.Interestingly, other models did not improve upon it despite more behavioral assumptions and free parameters being taken into consideration.Further, Lombardiet al.[18]proposed leadership metric with two time-dependent delayed indexes (directional correlation and speed correlation)to unveil and quantitatively describe the mechanisms of the leadership emergency in walking groups.However,in the works of Rioet al.[17]and Lombardiet al.,[18]only the follow behavior was tested with a few participants,and they were instructed to walk in pairs,not in a collective way as those in the single-file flow experiment.Therefore,in this study,we aim to investigate how pedestrian follows the leader in a collective movement and further how the curvature of the track,density,age,and gender affects the speed matching behavior in such a situation.
2.Experiment details
The single-file flow experiment was conducted at the school Gymnasium Bayreuther Stra?e in Wuppertal,Germany,in 2014.In total,118 students from the fifth grade(aged 11-12 years old) and the 11th grade (aged 17-18 years old) participated the experiment.As shown in Fig.1, the experimental track was a 0.8 m wide oval corridor with two straight paths(l=2.5 m) connected by two semi-circle paths.There were 31 trials of the experiment performed with a different number of participants.The participants were required to walk inside the corridor and forbidden to overtake others or walk side-by-side in the experiment.The trajectories of all participants in each experimental trial were extracted and recorded with a time interval of Δt= 1/25 s with the PeTrack software, and the dataset is accessible from the open access data archive of J¨ulich research center.[19]It should be noted that the trajectories in the original datasets were based on the general rectangular coordinate system,and to facilitate the analysis in single-file flow movement, they were transformed into a new coordinate system, as shown in Fig.1(b).The origin was at the start point of one straight path, thex-axis was along the middle line of the oval corridor denoted by the blue dash line in Fig.1(b), andy-axis was always set to be perpendicular to thex-axis.[20]As the current study focus on the longitudinal movement of the pedestrians, thus, only thexcoordinates of the trajectory were used in this study.

Fig.1.Illustration of the experimental scenario and the transformed coordinate system.
The trajectory dataset is processed with the following procedures:
(i) For each trial of the experiment, the trajectories of all participants were cut off at the time when the participants started to exit the corridor.
(ii)For each trial of the experiment,only the trajectories in the steady-state interval were selected based on the entire average speed of all participants during the whole duration of the given trial.The steady-state interval was defined as a time interval starting at the time when the average speed of the participants firstly reached the entire average speed, and ending at the time when the entire average speed was reached for the last time.[9]
(iii)Then for the trajectory of each pedestriani,xi(t)was smoothed over a time window of 0.4 s(10 frames)with a moving average filter.The longitudinal speedvxi(t) along thexaxis for each pedestrianiat timetwas calculated by
with dt=0.4 s.
3.Methodology
3.1.Characteristic delay time in speed matching
In the single-file flow experiment, a pedestrian is not allowed to overtake another or walk abreast.Therefore, it is a one-dimensional following movement, in which a pedestrian usually pursues to a comfortable walk by adapting his/her speed according to that of the predecessor’s.In the work of Rioet al.,[17]they tested a number of behavioral assumptions that derived from the classic car-following models.Some of the behavioral rules as well as the corresponding models were simple with only one free parameter involved,such as the follower tended to match the speed of leader, and the follower would maintain a fixed distance from the leader.There were composite behavioral rules in which the speed difference and the distance were all taken into consideration, and more free parameters were needed.However, their results surprisingly showed that the following behavior was best described by the simple speed-matching rule,and other composite rules had not significantly improve upon it.This suggested that the speedmatching behavior plays a key role in the follow-the-leader movement of pedestrian, which might further govern the dynamics of the single-file flow.Therefore,we first put forward a precondition that the follower pedestrian tends to match the speed of the leader at a characteristic delay timeτ(τ ≥0).Then the time-dependent delayed speed correlation proposed by Lombardiet al.[18]was adapted to determine the characteristic delay timeτfor each participant.
Now, consider two successive pedestrians in the experiment: pedestrianjfollows pedestrianiin a duration from timet=Tfjtot=TljwithTfjandTljare the first and last recorded timestamp of pedestrianj’s following movements,respectively.Then based on the time series of their speeds,the time-dependent delayed speed correlation is defined as
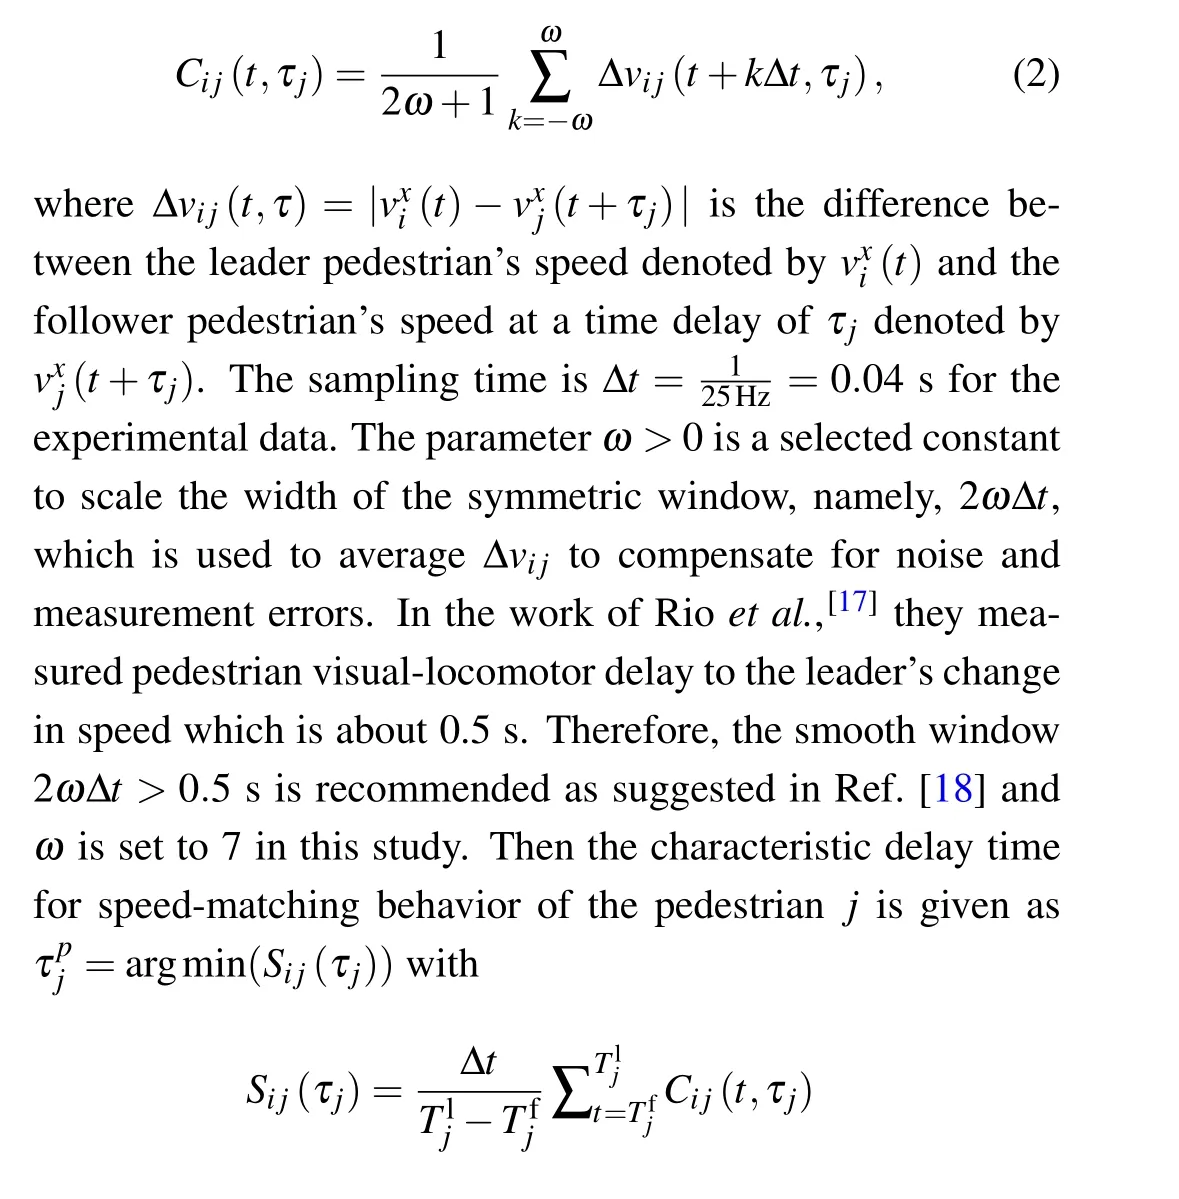
being the total mean value ofCij(t,τj)in the whole duration.
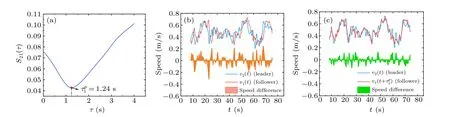
Fig.2.Examples of the personal related delay time in speed matching.
Figure 2 presents an example to show the effectiveness of the proposed method.Figure 2(a)illustrates the determination of the characteristic delay time for the follower pedestrian during the speed matching movement of two pedestrians(with pedestrian 1 the leader, and pedestrian 2 the follower) in the experiment.From Fig.2(a),it can be seen that the mean value ofCi j(t,τj)firstly decreases with the increases ofτand then increases with the increase ofτafter a critical value, therefore the characteristic delay timeτcan be found at the critical value.Figure 2(b)shows the speeds and the speed differences of the two pedestrians in the experiment, which also can be viewed as the situation thatτ=0 for the follower.Figure 2(c)shows the results by shifting the speeds of the follower with the characteristic delay timeτ=τp j=1.24 s.It can be found that the speeds of the leader and the follower match well,and the corresponding speed differences are remarkably reduced compared with the results in Fig.2(b).
3.2.Statistical analysis
In this section, the influences of the curvature of the experimental track,density,the age and gender of the individual,as well as the age and gender of the leader on the delay time were analyzed.
3.2.1.Curvature
From Fig.1, it can be seen that the oval corridor composed of two straight paths and two semi-circle paths.In several previous studies, it has been shown that the curvature of the track has an impact on the pedestrian’s movements.[21,22]Therefore, we first separate the trajectories of each leaderfollower dyad into two parts:(i)The trajectories in the straight section and (ii) the trajectories in the turning section and for each section, a characteristic delay timeτidentification with the method mentioned in Subsection 3.1 is followed.Thus,for each pedestrian in a given experimental trial, there will have two characteristic delay times for the straight part and the turning part,respectively.The nonparametric tests Mann-Whitney test is applied to investigate whether there are statistically significant differences between the two best delay times in each given experimental trial.
Figure 3 presents thepvalues of the Mann-Whitney test for each experimental trial (global density is defined as the number of participants divided by the length of the experimental track).From Fig.3, we can conclude that in the vast majority of cases,the curvature of the experimental setup has no significant influence on the characteristic delay time of the individuals at a significant level ofp=0.05,especially for the high-density ranges.As a consequence,in the following analysis,the used characteristic delay times are based on the whole trajectories of the leader-follower dyads.
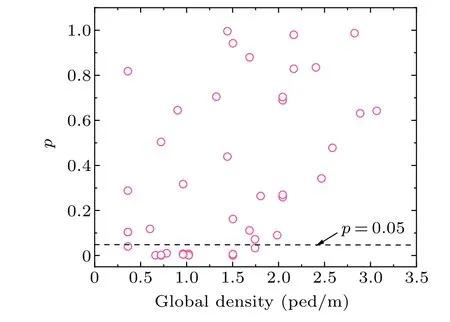
Fig.3.The p values of the Mann-Whitney test for each experimental trial.
3.2.2.Density
Figure 4 presents the mean value of the bestτandSij(τp j)under different global densities withSij(τp j) being the minimal value of the total mean value,Sij(τj) indicating the best matching for the speeds of the leader and the follower.From Fig.4(a), visual inspection suggests that the distributions of the bestτdiffer under different global densities.It can also be seen from Fig.4(a)that the mean value of the characteristic delay timeτfirst decreases with the increase of density in the range of 0.2 ped/m-1.25 ped/m,then it nearly levels off in the range of 1.25 ped/m-2.5 ped/m, finally it shows a slight increase trend when density is larger than 2.5 ped/m.This indicates a density-dependent state for the follow-the-leader behavior of the pedestrians in the experiment.In low-density ranges, the pedestrians are in a laggard following state indicated by a longer time delay, as in these densities pedestrians nearly walk freely without too many constraints from their leaders.When density increases,the restrictions from the leaders are frequent,and pedestrians need to make quick responses to the speed changes of the leaders, which is indicated by a smaller delay timeτ.When density further increases (larger than 2.5 ped/m in Fig.4(a)),a slight increase in the time delay is observed.This indicate that the pedestrians become inactive when the leaders highly restrict their movements,and they often have to stop and wait for an acceptable headway to restart their movements.This may increase the sluggishness and casualness in their movement decisions.In addition,though the experimental results show such a critical value 1.25 ped/m,it is hard to reveal the possible underlying mechanism in this study as it might involve the gait and psychology of pedestrians during their movement.Further detailed experiments and analysis are need to address this question.
Figure 4(b) presents the matching results at different global densities.It can be seen that the proposed method performs well under all densities, especially when density is larger than 1.25 ped/m.
Fig.4.Mean value of characteristic delay time and Sij(τpj)under different global densities(error bars show the 0.5 standard deviations).
Given the influence of density on the value of characteristic delay time, the characteristic delay timeτin the density range 1.25 ped/m-2.5 ped/m was chosen for further analysis to exclude the influence of density as much as possible.Then,the characteristic delay timeτwas grouped by different attributes,including gender (male and female) and age (younger (fifth grade) and older (11th grade)).We tested the values of characteristic delay timeτin different groups using Shapiro-Wilk tests and found that in most cases, the samples were not normally distributed.Therefore, the nonparametric tests Mann-Whitney test was applied to determine whether there were statistically significant differences between groups on the given attributes.
3.2.3.Age and gender of the followers
Figures 5(a) and 5(b) presented the distributions of the time delay as a function of age and gender, respectively.By applying the Mann-Whitney test, the gender and age differences in the characteristic delay time of pedestrians were tested.The statistical results suggested that both age and gender had no significant influence on the time delay,with a significant level of 0.05.
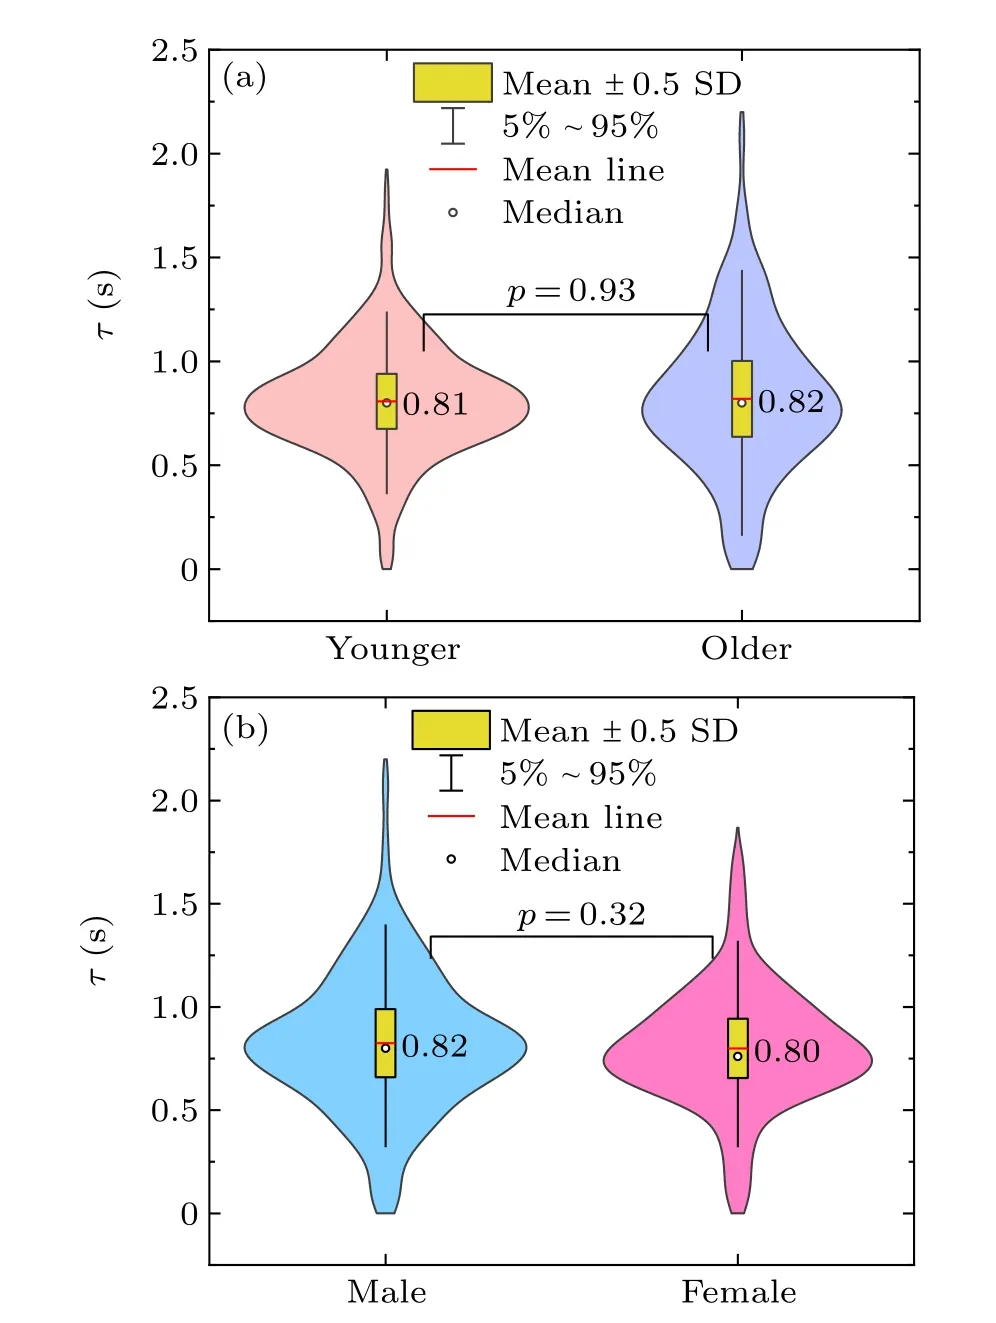
Fig.5.The distributions of the characteristic delay time as a function of age and gender.
3.2.4.Age and gender of the leaders
Further, whether the leader’s attributes would impact the characteristic delay time of the pedestrian following the leader was tested.Specifically,for younger/older pedestrians,whether the values of time delay would be significantly different between the situation when they followed younger leaders and when they followed older leaders were investigated.Figure 6 presented the distributions of the time delay as a function of the age composition of the follower-leader dyad.The statistical results suggested that the age of the leader had no significant influence on the values of the time delay of the pedestrians,both for the younger and older followers.

Fig.6.The distributions of the characteristic delay time as a function of the age composition of the follower-leader dyad.
In Fig.7, it is further investigated whether the gender of the leader will impact the characteristic delay time of the follower as intuitively.It is reasonable to assume that the female follower might keep a longer personal social distance from the male leader,and vice versa for the male follower,which might impact the time delay when following a male or female leader.However,the statistical results in Fig.7 suggest that there are no significant differences between different gender compositions of leader and follower.
3.2.5.A comparison with an adult group
We further made a comparison study on the characteristic delay time between the children group and adult group.The adult experiment was conducted under a similar setup to that of the children group,in which six runs of the single-file experiment were made with a different number of adult participants(N=15, 30, 47, 55, 52, 59).Figure 8 showed a snapshot of the experiment.A detailed description of the adult experiment could be found in Ref.[20].
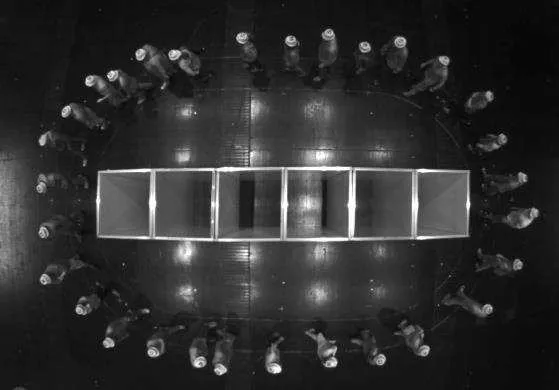
Fig.8.Snapshot of the adult experiment.
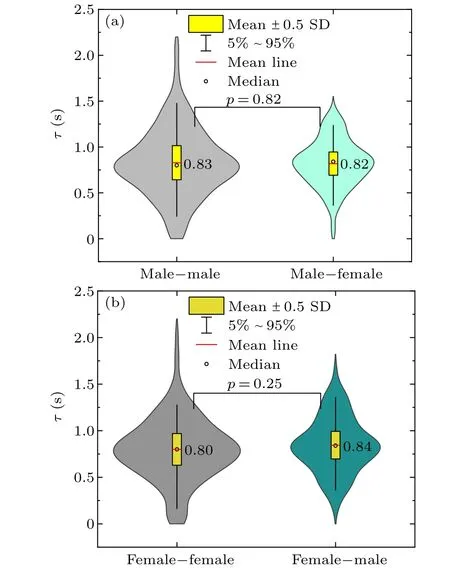
Fig.7.The distributions of the time delay as a function of the gender composition of the follower-leader dyad.
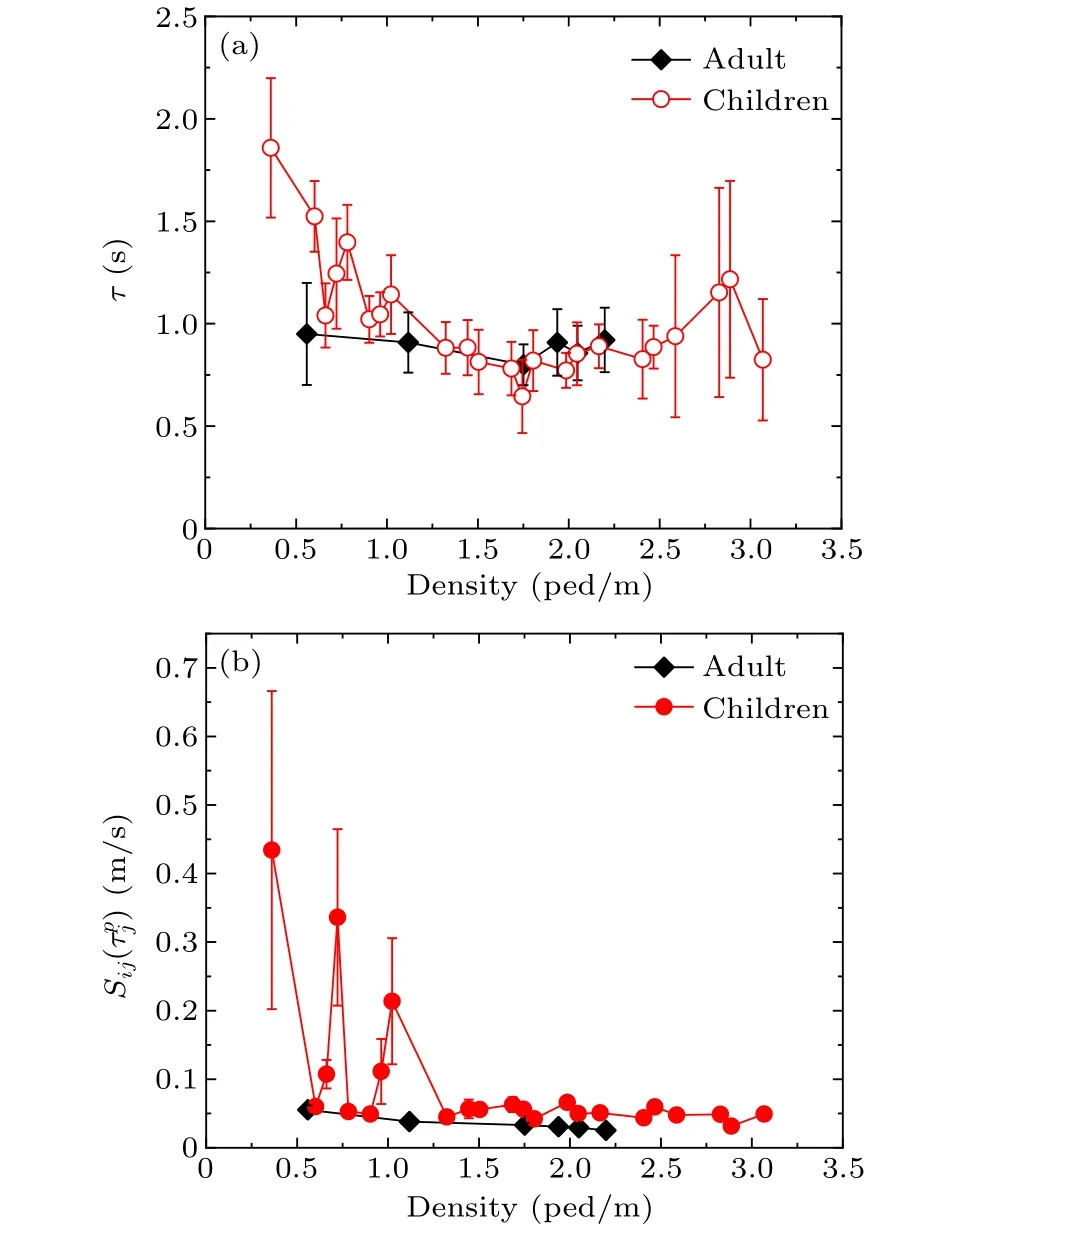
Fig.9.Comparison between the adult group and children group for the mean value of characteristic delay time and Sij(τp j)under different global densities(error bars show the 0.5 standard deviations).
The results are shown in Fig.9(a), from which it can be seen that the mean delay time of the adult group displays a similar trend to that of the children group.The mean value of characteristic delay time firstly decreases with the increase of density,and then a slight increase trend with the density is visible.The mean values of the characteristic delay time of the children group are a little bit larger than those of the adult groups at density lower than 1.5 ped/m,while no obvious difference is observed when density is larger than 1.5 ped/m.In addition,the results ofSi j(τp j)shown in Fig.9(b)demonstrate that the proposed method performs well for the adult experiment.
4.Discussion and conclusions
Speed matching is believed to be a fundamental rule for pedestrians during follow-the-leader movement.In this study,the characteristic delay time of children pedestrians in speed matching is investigated based on the time-dependent delayed speed correlation.The results suggest that the characteristic delay time can be viewed as a density-dependent property in speed matching.The curvature of the track, the age and the gender of the follower/leader have no significant influence on it.The results are meaningful for further understanding the behavioral nature of children pedestrians in follow-the-leader movement and for the development of related simulation models.
However, there still have several limitations that need to address in future work.
(i) The experiment only involve children from two age groups, which limite the extension of the results.In future works,more different age groups can be considered to examine further the age effect on the delay time in speed matching movement,especially those pre-school children and older adults.
(ii) The studies have been done on flat surface.In the work of Aghabayket al.,[23]they conducted individual walking experiments on inclined surface and observed gender and age effects.In addition, they also revealed that variation of the body mass index(BMI)of the pedestrian had an effect on pedestrian walking characteristics.Therefore, it would be an interesting topic to investigate the speed matching behavior of pedestrians with different BMIs on up-grade and down-grade surfaces.
(iii) Previous researches have shown that curvature has an impact on the walking dynamics of pedestrians.However,in this paper we only focus on a specific aspect of pedestrian walking dynamics, namely, the delay time during the followthe-leader movement,rather than a general analysis of pedestrian crowd movement in angled corridors.Though the statistical results suggest that the curvature has no significant influence on most experimental cases,we think it does not contradict the previous research.Detailed experiments and analyses are needed to further investigate the influence of curvature.
(iv) In this study, all the participants are asked to walk normally.However, the required response time and personal space might vary when pedestrians are jogging or running.Therefore, further research is needed to investigate the effect of normal walking, jogging and running on the characteristic delay time of pedestrians in speed matching.
(v) In this work, the characteristic delay time is identified and investigated based on the single-file movement experiment.It may pose a challenge to investigate it under normal walking conditions as one pedestrian might follow one or more leaders in a two-dimensional space to achieve group cohesion and walking comfort.Besides, in a two-dimensional followthe-leader movement, a pedestrian might shift his/her leader.Thus, will the characteristic delay time change in this shift process? Further,whether the characteristic delay time can be regarded as a key explanatory variable that accounts for such a shift process can be investigated in the future.
Acknowledgment
Project supported by the National Natural Science Foundation of China (Grant Nos.71901175, 71901060, and 72101276).

- Chinese Physics B的其它文章
- Matrix integrable fifth-order mKdV equations and their soliton solutions
- Comparison of differential evolution,particle swarm optimization,quantum-behaved particle swarm optimization,and quantum evolutionary algorithm for preparation of quantum states
- Explicit K-symplectic methods for nonseparable non-canonical Hamiltonian systems
- Molecular dynamics study of interactions between edge dislocation and irradiation-induced defects in Fe-10Ni-20Cr alloy
- Engineering topological state transfer in four-period Su-Schrieffer-Heeger chain
- Spontaneous emission of a moving atom in a waveguide of rectangular cross section