
Tracking Regulatory Mechanism of Trace Fe on Graphene Electromagnetic Wave Absorption
2024-03-01 11:05KailiZhangYuhaoLiuYananLiuYuefengYanGuanshengMaBoZhongRenchaoCheXiaoxiaoHuang
Nano-Micro Letters 2024年4期
Kaili Zhang, Yuhao Liu, Yanan Liu, Yuefeng Yan, Guansheng Ma, Bo Zhong, Renchao Che, Xiaoxiao Huang?
ABSTRACT Polarization and conductance losses are the fundamental dielectric attenuation mechanisms for graphene-based absorbers, but it is not fully understood in revealing the loss mechanism of affect graphene itself.For the first time, the reduced graphene oxide (RGO) based absorbers are developed with regulatory absorption properties and the absorption mechanism of RGO is mainly originated from the carrier injection behavior of trace metal Fe nanosheets on graphene.Accordingly, the minimum reflection loss (RLmin) of Fe/RGO-2 composite reaches - 53.38 dB (2.45 mm), and the effective absorption bandwidth achieves 7.52 GHz (2.62 mm) with lower filling loading of 2 wt%.Using off-axis electron hologram testing combined with simulation calculation and carrier transport property experiments, we demonstrate here the carrier injection behavior from Fe to graphene at the interface and the induced charge accumulation and rearrangement, resulting in the increased interfacial and dipole polarization and the conductance loss.This work has confirmed that regulating the dielectric property of graphene itself by adding trace metals can not only ensure good impedance matching, but also fully exploit the dielectric loss ability of graphene at low filler content, which opens up an efficient way for designing lightweight absorbers and may be extended to other types materials.
KEYWORDS Reduced graphene oxide; Fe nanosheets; Dielectric loss; Electromagnetic wave absorption
1 Introduction
With the development of microwave technology and the popularization of electronic products, electromagnetic wave (EMW) not only brings great convenience to people’s life, but also produces a lot of electromagnetic (EM) interference [1–3].EM radiation not only harms human health, but also affects the normal operation of electronic equipment.As the main barrier against EM interference, absorbing materials have been widely used in military and civil fields [4–8].In recent years, carbon materials with thin thickness, low density and excellent electrical properties (such as graphite [9], graphene [10], carbon black [11] and carbon nanotubes (CNTs) [12]) have shown extensive application prospects in the EMW absorption field.
Graphene, a newly emerging carbon material with unique layered structure and intrinsic metallic conductivity, has emerged as promising candidates for EMW absorption [13–16].Nevertheless, single-component graphene does not exhibit ideal EMW absorption ability due to the contradiction between impedance matching and high absorption strength.Previous studies have shown that designing chemical components and structural engineering of graphene are crucial for effectively improving the EMW absorption performance, particularly in combination with dielectric or magnetic components.For instance, the welldesigned 3D accordion-like CeO2-x/RGO composites can effectively improve the impedance matching and display the minimum reflection loss (RLmin) of - 50.6 dB at 15.9 GHz, and effective absorption bandwidth (EAB, RL ≤ - 10 dB) of 5.84 GHz with a filler content of 50 wt% [17].Huang et al.[18] prepared the rGO–Fe3O4absorbing material via hydrothermal reaction, amidation reaction and reduction process, and the EMW performance has been greatly improved due to the EM synergistic effect of rGO and Fe3O4.The resulting product exhibited the RLminof - 48.6 dB at 14.4 GHz and EAB of 6.32 GHz with 45 wt% filler loading.Furthermore, there are still many metals coated on RGO (such as Fe/LrGO [19], GA@Ni [20], Co/GN [21] and rGO/FeCo [22]) to achieve a better impedance matching and attenuation.Despite their improved performance, the application and development still exist significant bottlenecks.On the one hand, the reported RGO-based absorbers have the high filler content disadvantage, which inevitably leads to impedance mismatch due to high conductivity of RGO.Although the impedance matching can be optimized by reducing the filling content, efficient attenuation cannot be achieved.This limits its practical application to some extent.In addition, there are few reports of graphene absorbers filling less than 5 wt%.On the other hand, although the EMW absorbing properties of graphene-based materials have been improved through component optimization and structural design with multiple loss mechanisms, it faces unclear problems about how graphene further exerts itself dielectric properties to enhance the dielectric attenuation mechanism in composites.Thus, it is urgent the effect mechanism of graphene to further understand dielectric properties, which has important application value for obtaining ideal graphene-based absorbing materials with low loading and high loss attenuation ability.
To explore the dielectric mechanism of graphene-based absorbers, the electron-hopping (EHP) model, aggregative-induced-charge-transport and conductive-network equation were first established by Cao’s groups to reveal the relationship between temperature, conductivity and dielectric behaviors of graphene layers [23–25].This provides the theoretical basis for the dielectric loss of graphene.In addition, Fe/G nanocomposites exhibited obvious dielectric properties due to the interfacial coupling between graphene and metal and reached the bandwidth of 4.4 GHz with the thickness of 2.0 mm (40 wt%) [26].It is reported that the interfacial interaction between various dopants and graphene (such as GfeTCs [27], GO/graphene [28], Ru/graphene [29], Ag/graphene [30]) would generate charge transfer, thus resulting in new electrical properties of graphene.Furthermore, the important polarization phenomenon between heterogeneous interfaces in graphene-based composites (such as Co/CoO/RGO [31], Fe3O4@NPC@rGO [32], Co@N-doped carbon [33] and Fe3O4–Fe3O4@C [34]) has been demonstrated by off-axis electron hologram and charge distribution map.These studies provide feasible strategies for designing graphene absorbers with excellent properties.However, there is still the problem of high absorbent filling rate due to the high density of the metal.Transition metal materials (Fe, Co, Ni) and their compounds have been considered as the popular candidates due to their intrinsic ferro-magnetic resonance absorption capacity in EMW absorption [35–38].Moreover, due to its special atomic structural properties, metal Fe exhibits unique physical and chemical properties in many aspects.Special focus on iron oxide hematite (Fe2O3) is observed because it has the advantages of simple process, various methods, low price, high yield, good thermal stability and chemical stability [39].Importantly, Fe2O3is easily reduced to various morphologies of Fe.Metal Fe interior possesses abundant free electrons and the interfacial electronic interaction between metal and graphene would make graphene exhibit some novel electric properties [40].Therefore, it is a challenge to make full use of the free electrons in metals to exert dielectric dispersion property of graphene to achieve excellent EMW absorption performance under low loading.
Herein, we introduced trace Fe nanosheets to construct novel Fe/reduced graphene oxide (Fe/RGO) composite absorber based on the different electron gain and loss capabilities (The work function of Fe is 4.5 eV and that of graphene is 5.0 eV) to gain insight into the regulatory effects of trace Fe on the dielectric properties of RGO.The results revealed that Fe/RGO exhibited strong dielectric dispersion characteristic and high conductivity compared with RGO.To clarify the mechanism of dielectric properties of RGO, Fe/graphene field effect transistor (FG-FET) device was fabricated using chemical vapor deposition and vacuum thermal evaporation methods to further explore the micro-interface electronic interaction between graphene and Fe.The results of the Hall effect and carrier transfer characteristic curves indicated that the interface between graphene and Fe is ohmic contact form, and free electrons of Fe are injected into graphene by transforming from graphene hole transport (P-type) to electron transport (N-type), which can be inferred that this process directly enhances the conduction loss.The charge accumulation and rearrangement resulting from the carrier injection process further increased interfacial polarization and dipole polarization thereby synergistically promoting dielectric attenuation performance, which has been verified by holography technology.Compared with RGO, the absorption performance of Fe/RGO-2 is greatly improved, with the RLminvalue of - 53.38 dB and EAB of 7.52 GHz (10.48–18 GHz) at a lower filling loading of 2 wt%.This work not only provides new research evidence for the relationship between the electricity and dielectric properties of graphene, but also is expected to guide future exploration on designing high-performance graphene-based absorption materials.
2 Experimental Section
2.1 Preparation of Fe2O3 Nanosheets, Fe/RGO Composites and Fe/Graphene Field Effect Transistor (FG-FET)
2.1.1 Synthesis of Single-Crystal Hexagonal Fe2O3 Nanosheets
The α-Fe2O3nanosheets were synthesized via a simple solvothermal method of FeCl3in mixture solutions at suitable temperatures.The details are as follows.FeCl3·6H2O (1.10 g) was added into a mixture of ethanol (40.0 mL) and deionized water (2.8 mL) and stirred till solid powders were completely dissolved.With continuous magnetic stirring, CH3COONa (5.0 g) was added to the solution and stirred for 40 min.After the mixture was stabilized, the mixture was transferred to autoclave for solvothermal reaction at 180 °C for 18 h.The auburn product was washed by ethanol and distilled water for three times, respectively, and dried in a vacuum oven at 65 °C for 8 h.For the surface modification, hexagonal Fe2O3nanosheets (0.6 g) and hexadecyltrimethylammonium bromide (CTAB, 0.2 g) were dispersed in deionized water (50 mL) with magnetic stirring in a 60 °C water bath for 2 h.The product was washed with deionized water for several times and dried at 65 °C, and finally the modified hexagonal Fe2O3nanosheets were obtained.
2.1.2 Preparation of Fe/RGO Composites
First, GO was synthesized using a reported modified Hummers’ method [41].Second, GO suspension (100 mL and 10 mg mL-1) were mixed with a certain amount of modified Fe2O3(0, 2, 4, 6 and 8 mg), respectively, and the mixture was ultrasonic stirred evenly for 3 h by electrostatic adsorption process.Then, the mixtures were sealed and refrigerated in the refrigerator, and treated by freeze-drying method (- 65 °C, 0.1 Pa) for 24 h.The obtained precursors were named GO, Fe2O3/GO-1, Fe2O3/GO-2, Fe2O3/GO-3 and Fe2O3/GO-4, respectively.Finally, the above products were put into the tube furnace and heat treated at 350 °C for 2 h under H2atmosphere (60 mL min-1).The samples were named RGO, Fe/RGO-1, Fe/RGO-2, Fe/RGO-3, Fe/RGO-4, respectively.Furthermore, the preparation of Co/RGO and Ni/RGO was consistent with the above methods (Supporting Information).
2.1.3 Preparation of Fe/Graphene Field Effect Transistor (FG-FET)
Monolayer graphene was grown using CH4as carbon source, H2as carrier gas and 25 μm thick Cu foil (111) as a growth matrix by chemical vapor deposition method [42].The graphene film was transferred to SiO2/Si substrate by PMMA wet transfer process [43].Then, Fe/graphene film were prepared by deposition of Fe (20 nm) on the surface of monolayer graphene.The Fe/graphene field effect transistor (FG-FET) was fabricated by thermal evaporation of Cr/Au (5/30 nm) electrodes on the surface of Fe/graphene films through a mask reticle to form source and drain electrodes.The preparation of graphene field effect transistor (G-FET) was consistent with the above method.
2.2 Characterization
The micromorphology was investigated by scanning electron microscopy (SEM, SUPRA55, ZEISS MERLIN), and corresponding energy dispersive spectroscopy (EDS) mapping analyses were used for collecting elemental signals and mapping images.Transmission electron microscopy (TEM, Philips-FEI, Tecnai G2 F30) was carried out using Tecnai F30 electron microscope operating at 200 kV.The structure of as-synthesized materials was characterized by X-ray diffraction (XRD) collected on a DX-2700 X-ray diffractometer.Fourier transform infrared (FTIR, Nicolet is50) spectra were measured over the range of 4000–500 cm-1.The Raman spectra (532 nm) was collected with inVia-Reflex.The elemental composition of the sample surface was determined by X-ray photoelectron spectroscopy (XPS) measurements using a Thermal Escalab 250, with a monochromatic Al Kα X-ray source.The magnetic properties of hybrid materials were tested with a vibrating sample magnetometer (Quantum Design, Dynacool-14T).The composition content of the material was tested by ICP-MS (NexION 350X, PerkinElmer).The electrical properties of the materials were tested by scanning probe microscope (SPM, Bruker, Dimension Fastscan) with C-AFM, KPFM and EFM functions, and the conductive probe is Pt/Ir coated probes (Table S1).The electrical conductivity was measured by four probe methods (ST2742B).The current output curve of the composite was measured on the semiconductor characteristic system (Keithley 4200-SCS).The toroidal samples (Φin:3.04 mm,Φout:7.00 mm) were made of the hybrid material uniformly mixed with paraffin at 1–5 wt%.Its complex permittivity and permeability were characterized by using an Agilent N5230A vector network analyzer (VNA).The RL values were calculated based on the transmission-line theory as follows [44, 45]:
whereZinandZ0represent the input impedance of the absorber and free space,dis the thickness of the sample,cis the velocity of light in free space.
2.3 Calculation Details
All plane-wave within the density functional theory (DFT) calculations of atomic and electronic structures were performed using the CASTEP program provided in the Materials Studio 2020 package.The generalized gradient approximation (GGA) with Perdew–Burker–Ernzerhof (PBE) function was used to represent the exchange–correlation effects.The energy convergence criterion was 1 × 10⁻⁵eV atom-1, the maximum force was 0.03 eV ?-1, the maximum stress was 0.05 GPa, and the energy cutoff was 400.0 eV.The Brillouin zone integration was sampled by using 2 × 2 × 1 k-point mesh density.TS method for DFT-D correction was used to accurately describe the van der Waals forces.The vacuum gap was set to be about 20 ?, which should lead to negligible interactions between the system and their mirror images.
3 Results and Discussion
3.1 Synthesis and Characterization of Fe/RGO Composites
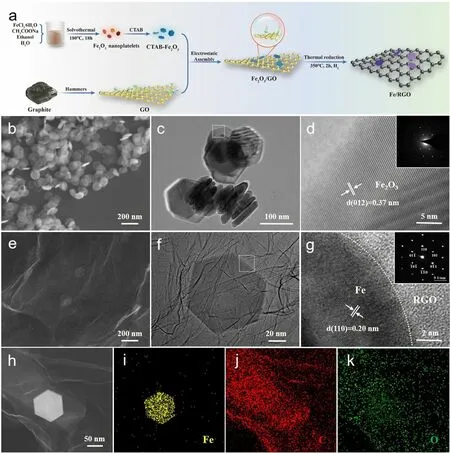
Fig.1 Synthetic process, microstructural characterization.a Schematic illustration of the preparation process of the Fe/RGO composites.b and e SEM images, c, f TEM images and d, g HRTEM images of Fe2O3 nanoplatelets and Fe/RGO-2 (Inset: the corresponding SAED pattern results).h–k STEM image and TEM-EDS map of Fe/RGO-2
Fe/RGO composites were synthesized via a facile electrostatic adsorption reaction and low temperature thermal reduction method (Fig.1a).Firstly, Fe2O3hexagonal nanosheets were synthesized by solvothermal method.And, GO (negatively charged) and modified Fe2O3nanosheets (positively charged) were firmly combined by electrostatic adsorption method.Finally, Fe/RGO composite was prepared by freeze-drying and thermal reduction.By controlling the addition amount of modified Fe2O3nanosheets (0, 2, 4, 6, and 8 mg), the effect of the content of Fe nanosheets on the electronic structure of RGO was investigated (labeled as RGO, Fe/RGO-1, Fe/RGO-2, Fe/RGO-3, and Fe/RGO-4).The microstructure of the composite was characterized by SEM/TEM.Fe2O3presents a thin and uniformly distributed hexagonal nanoplate structure (Fig.1b).It can be clearly seen that Fe2O3crystallizes into a hexagonal nanosheet with a width of about 100 nm, a thickness of about 10 nm and an aspect ratio of about 0.1 (Fig.1c).Moreover, as can be seen from the HRTEM image in Fig.1d, the lattice spacing is 0.37 nm corresponding to the (120) crystal plane of α-Fe2O3and the SAED pattern shows that the as-synthesized Fe2O3nanosheet is single-crystalline.The morphology of Fe/RGO composite is shown in Fig.S1.The RGO sheets show translucent and abundant wrinkles which are conducive to the loading of Fe nanosheets.With the increase in Fe content, Fe nanosheets are obviously increased and evenly distributed on the RGO sheets.Meanwhile, we can also obtain the accurate content of Fe in Fe/RGO samples by ICP measurement, the percentage of Fe is 0.32, 0.68, 0.94, and 1.22 wt% in Fe/RGO-1, Fe/RGO-2, Fe/RGO-3, and Fe/RGO-4, respectively.Specifically, for the Fe/RGO-2 composite, Fe nanosheets are uniformly dispersed on the RGO sheets with wrinkles, showing a face-to-face contact pattern to increase the contact area as shown in Fig.1e.In addition, TEM image shows that Fe maintains the hexagonal nanosheet microstructure (with a slightly reduced size) after thermal reduction (Fig.1f).In order to investigate the Fe/RGO-2 in detail, the HRTEM and SAED images (Fig.1g) are obtained from the Fe/RGO-2 edge.Fe with lattice spacing of 0.20 nm corresponding to the (110) crystal plane is monocrystalline, while RGO is amorphous carbon.The elemental distribution of Fe/RGO-2 is determined through the STEM image and TEM-EDS mapping in Fig.1h–k, in which the C and O elements are uniformly distributed within the RGO sheets and Fe element shows a hexagonal distribution.
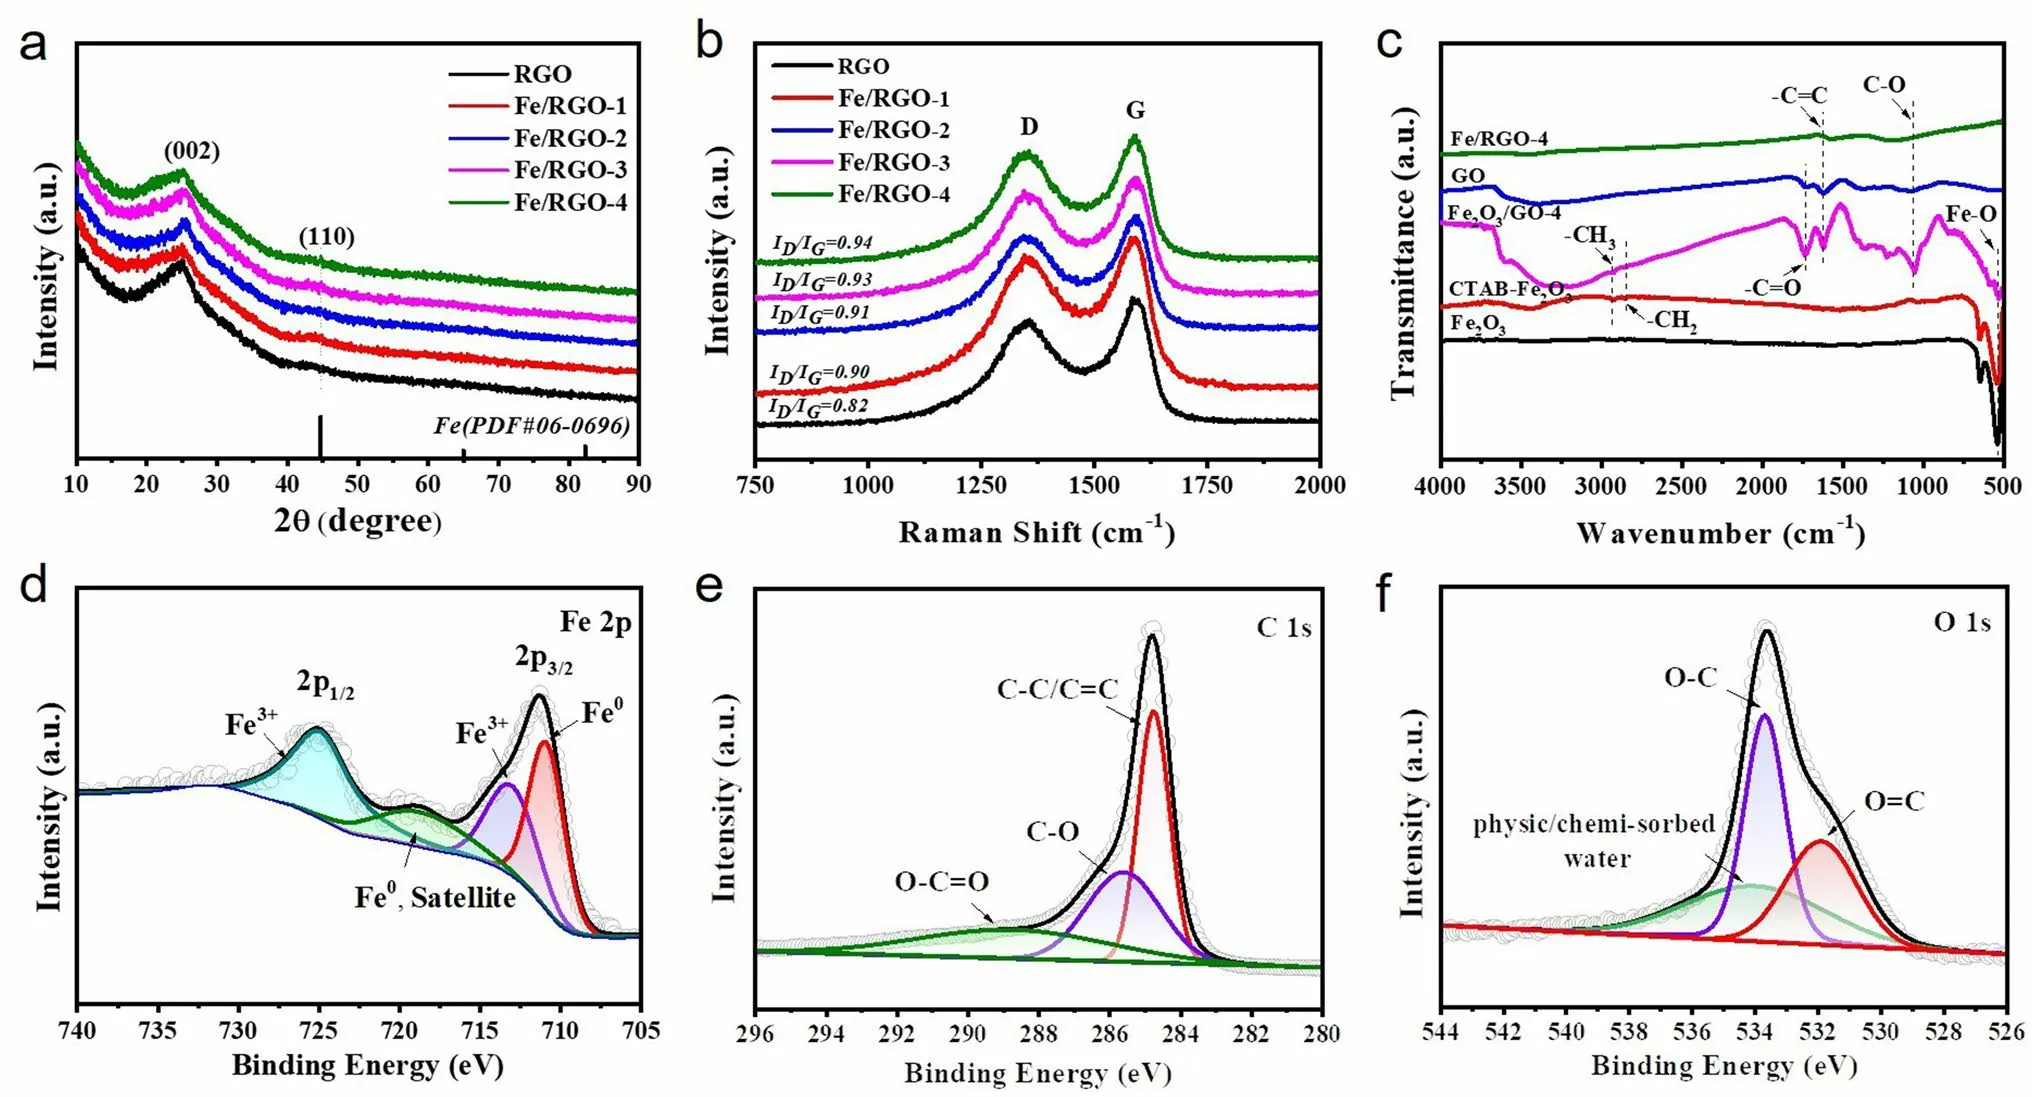
Fig.2 Structure characterization of Fe/RGO composites.a XRD patterns and b Raman spectra of RGO, Fe/RGO-1, Fe/RGO-2, Fe/RGO-3 and Fe/RGO-4.c FTIR spectra of Fe2O3, CTAB-Fe2O3, GO, Fe2O3/GO-4 and Fe/RGO-4, respectively.d–f XPS Fe 2p spectra, C 1s spectra and O 1s spectra of Fe/RGO-4
The crystal structure of the samples is characterized by XRD pattern.From Fig.2a, all samples show amorphous carbon with a wide diffraction peak at around 26°, consisted with the result of HRTEM image (Fig.1g).The typical diffraction peak of GO disappeared at 9.8°, indicating the GO was successfully reduced (Fig.S2a).In addition, compared with the strong diffraction peaks of pure Fe2O3and Fe, the characteristic diffraction peaks of Fe2O3and Fe nanosheets in Fe2O3/GO and Fe/RGO samples are not obvious, which is attributed to the minimal addition content of Fe2O3(Fig.S2b).The samples were further analyzed by Raman spectrum.The three characteristic peaks correspond to the D band, G band and 2D band in Figs.2b and S2d.The D band peak (1351 cm-1) and the G band peak (1590 cm-1) represent defects and disorder of graphitic carbon, and 2D band is related to the degree of graphene stacking.The intensity ratio (ID/IG) of the D and G band peaks reflects the degree of in-plane and edge defects of carbon skeleton [46].As shown in Fig.2b, theID/IGratios of RGO, Fe/RGO-1, Fe/RGO-2, Fe/RGO-3, and Fe/RGO-4 are 0.82, 0.90, 0.92, 0.93, and 0.94, respectively, indicating that the introduction of Fe is unfavorable to the reconstruction of carbonization.But more defects will lead to more dipole polarization, which is beneficial for dielectric loss.In this work, GO was reduced to RGO by thermal reduction method.At low temperature (350 °C), the degree of RGO lamellar stripping is lower and there is stack, resulting in weak 2D peaks (Fig.S2d).Figure 2c shows the FTIR spectrum of Fe2O3, CTAB-Fe2O3, GO, Fe2O3/GO-4 and Fe/RGO-4.The absorption peak of 536 cm-1is attributed to the Fe–O stretching vibration in Fe2O3, proving that Fe2O3has been successfully prepared [47].CTAB was successfully grafted onto the Fe2O3surface due to the presence of –CH3and –CH2stretching vibration peaks at 2930 and 2846 cm-1[48].Compared with GO and Fe2O3/GO-4, Fe/RGO-4 shows C=C and C–O stretching vibration peaks at 1623 and 1060 cm-1, indicating that its oxygen-containing functional groups are significantly reduced after thermal reduction.The electronic structure and composition of the Fe/RGO-4 were characterized via XPS as shown in Fig.2d–f.The curve-fitting of high-resolution Fe 2pspectrum observes the two typical peaks at 711.2 and 724.8 eV, assigning to Fe 2p3/2and Fe 2p1/2(Fig.2d).And the two peaks at 710.8 and 718.9 eV of Fe 2pspectrum reflect the existence of the metallic state of Fe0, which indicates the formation of α-Fe after thermal reduction.The characteristic peaks correspond to the Fe3+2p3/2and 2p1/2at 713.2 and 725.0 eV and the appearance of Fe3+could be ascribed to the oxidation of Fe on the surface of the material during testing [49].The C 1sspectra of Fe/RGO-4 in Fig.2e display the three peaks at 284.8, 286.0 and 289.7 eV, corresponding to the C=C/C–C, C–O and C=O, respectively.Moreover, the O 1sspectra of Fe/RGO-4 show the peaks at 531.9, 532.8 and 534 eV, corresponding to O=C, O–C and the adsorbed water via physic/chemistry method on the surface (Fig.2f) [50].Compared with the GO (Fig.S3), most oxygen-containing functional groups of Fe/RGO-4 were removed during the thermal reduction process.
3.2 Analysis of EMW Absorption Performance and Loss Mechanism of Fe/RGO
In general, the absorption properties of EMW are closely related to the complex permittivity (?r=?′ - j?″) and complex permeability (μr=μ′ -jμ″).The real part (?′ andμ′) can be represented as the storage capacity of electrical and magnetic energy, while the imaginary part (?″ andμ″) represents the loss capacity, respectively.The tangent of dielectric loss and magnetic loss (tanδεand tanδμ) represent the degree of EM energy loss capacity [51–53].In order to explore the absorption mechanism of EMW, the EM parameters of RGO and Fe/RGO-2 were measured by VNA with 1–5 wt% filler loading as shown in Fig.3.Figure 3a shows the variation ofε′ andε″ curves of RGO and Fe/RGO-2 composites with the frequency of the incident EMW.RGO has the lowest value of theε′ andε″ at the low addition of 1 wt%, and the values of both theε′ andε″ show an increasing trend with the increase in the filling ratio, and a decreasing trend with the increase in frequency, showing dielectric dispersion characteristics.This is mainly to establish a strong conductive network structure.Interestingly, compared with RGO, Fe/RGO-2 exhibits higherε′ andε″ of dielectric constant and more obvious dispersion characteristic at the same filling content.Theu′ andu″ of the permeability of RGO and Fe/RGO-2 are 1 and 0 without magnetic loss in Fig.S4.The absorption performance of samples were calculated by the RL value based on the transmission-line theory (Fig.S5).The RGO composite gradually shows significant absorption performance, while Fe/RGO-2 performance is poor with the increase in filling ratio.Surprisingly, compared to RGO, Fe/RGO-2 shows superior absorption performance with RLminvalue reaching - 46.71 dB at 14.39 GHz (2.5 mm) and EAB of 6.73 GHz (11.27–18 GHz) in 2% filler loading.Under 4 wt%, the EAB of RGO reaches 4.84 GHz (11.42–16.26 GHz) at a thickness of 2.0 mm and the RLminof - 36.96 dB is achieved at 8.59 GHz (3.0 mm), while Fe/RGO-2 has no effective absorption.Compared with RGO, the attenuation constants (α) of Fe/RGO-2 composites increase significantly, indicating the obvious improvement of absorption performance by the addition of Fe for RGO, while the variation trend of the impedance matching ratio (Z) of Fe/RGO-2 is opposite (Fig.S6).Therefore, to achieve high efficient EMW absorption, both α andZshould be considered.In order to understand the reason for the obvious change in the absorption performance of RGO and Fe/RGO, the dielectric loss mechanism are further analyzed, as shown in Fig.3b, c.Due to the addition of low content (0.68 wt%) of Fe, the dielectric loss capacity (tan δε) and conductivity (σ) of Fe/RGO-2 is more significant and increase with the increase in filling ratio.Based on the Debye relaxation theory and Cole–Cole model, the polarization and conductivity loss play important roles in the changing of permittivity [46].Theε′ and ε″ can be expressed as follows [54, 55]:
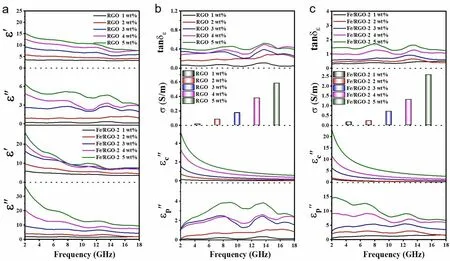
Fig.3 Analysis on EMW absorption mechanisms of RGO and Fe/RGO-2 composites.a ε′ and ε″.tanδε, σ, εc″ and εp″ of b RGO and c Fe/RGO-2 composites with 1–5 wt% loading
Theεc″ andεp″ curves represent the contribution of conductance loss and polarization loss toε″, which is mainly conductance loss at low frequency and polarization loss at high frequency.It is inferred that the Fe nanosheets could enhance the polarization behavior and dielectric loss ability of RGO.
3.3 Electronic Transport Mechanism of Fe/Graphene
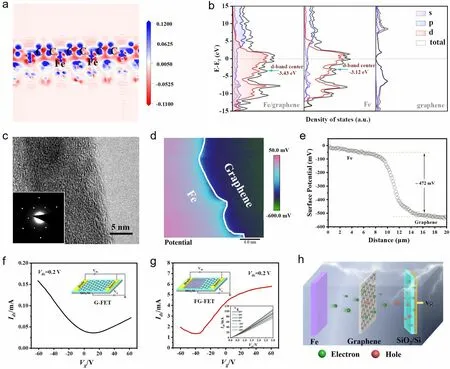
Fig.4 Electrical performance of the Fe/graphene.a Charge density difference plots of monolayer graphene adsorbed on Fe (110).The positive and negative charges are shown in blue and red (isovalue: 0.1).b DOS and PDOS results of Fe/graphene, Fe and graphene.c HRTEM image and SAED pattern of graphene.d Surface potential image and e the corresponding contact potential difference marked with white line of Fe/graphene.The transfer characteristic curves of f G-FET and g FG-FET at drain bias of 0.2 V (the insets show schematics of models and output characteristics at variable gate voltage).h Schematic diagram of working principle of N-type doping effect in FG-FET channel layer
In order to understand the effect mechanism of metal Fe on graphene electrical property in detail, the optimized geometric structure of Fe/graphene was constructed using perfect monolayer graphene as shown in Fig.S7.The charge density difference, electron localization function (ELF) and density of states (DOS) of Fe (110)/graphene (001) are calculated by DFT to analyze the electronic interaction between Fe and graphene.The charge accumulation (blue region) on graphene surface and charge depletion (red region) around Fe surface prove the close electronic interaction between Fe and graphene.Meanwhile, the detailed electron transfer within Fe/graphene can be reflected by isosurfaces obtained from ELF and Bader charge (Fig.4a).The results indicate that 4.03 electrons are transferred from Fe atoms to C atoms and the interfacial charge distribution is mainly confined to the interface between graphene and Fe.Moreover, the density of states (DOS) and partial density of states PDOS of Fe/graphene, graphene and Fe are shown in Fig.4b.The bandgap of graphene monolayer is 0 eV, and the valence and conduction bands are mainly contributed by the 2porbital of C atom.Compared with Fe, the d-band center of the Fe/graphene moves to a low level around the Fermi level, indicating the charge transfer between Fe and C atoms.This is mainly due to the strong hybridization in Fe-3dand C-2porbitals after the introduction of Fe atoms, which promotes the effective electron transport at the interface to achieve graphene carrier injection.From the theoretical calculation results, it can be concluded that Fe can stably combine with graphene by tight electronic interactions, and improve the electrical performance of graphene by changing the electronic states.To further verify the electron transport behavior of Fe/graphene structural model, FG-FET was constructed to explore the carrier injection type and contact mode of Fe/graphene by CVD and vacuum thermal evaporation methods.From HRTEM, SAED and Raman images, it can be shown that the growing graphene is monolayer and single crystal, and Fe is polycrystalline under experimental conditions (Figs.4c and S8).First of all, the surface potential of Fe in contact with graphene and graphene was analyzed to evaluate the barrier height using KPFM.From Fig.4d, it was obviously observed that the contact potential difference change between Fe and graphene layers, and inferred that the barrier height is about 472 mV, which proves that there is effective charge transfer between Fe and graphene (Fig.4e).Subsequently, the Fe/graphene interface carrier transport behavior was characterized at room temperature by constructing FET.From Fig.4f, g, the G-FET shows typicalP-type (hole) carrier-dominated transfer characteristic behavior and FG-FET shows typicalN-type (electron).Meanwhile, the Hall coefficient (RH) of graphene and Fe/graphene also verified the change of carrier type by Hall effect measurement (RH(graphene) = 6.03 × 10⁻⁷m3/C, RH(Fe/graphene) = - 4.36 × 10⁻⁶m3/C).Moreover, the output characteristic curves of the FG-FET show that the output current increases continuously with the increase in the positive gate voltage and presents an obvious linear relationship, indicating that the carrier transport type is mainly electron and a good ohmic contact is formed between the graphene and the Fe interface.According to the free electron theory of metals [56], free electrons inside Fe (as an electron donor) can form directional transport to graphene (as an electron acceptor) in the external electric field (Fig.4h).Therefore, it can be inferred that the ohmic contact form formed by Fe/graphene can better promote the electron transport of Fe to graphene to achieve carrier injection, thus improving the electrical properties of graphene.
3.4 EM Parameters Analysis and EMW Absorption Ability
To further clarify the EMW absorption mechanism of Fe/RGO, the dielectric properties of Fe/RGO composites containing different Fe contents are studied with the filler loading of 2 wt% as shown in Fig.5.In general, theε′ andε″ curves of RGO, Fe/RGO-1, Fe/RGO-2, Fe/RGO-3 and Fe/RGO-4 composites show an increasing trend with the increase in Fe content, and a decreasing trend with the increase in frequency, which has an obvious dielectric dispersion behavior (Fig.5a, d).At 2 GHz, theε′ value increase from 5.78 to 14.56 andε″ increase from 0.88 to 6.21.Metallic Fe possesses good electrical conductivity and abundant free electrons inside according to the free electron theory [57].Electrons are transferred to RGO more quickly along the interface of Fe/RGO in the form of ohmic contact, which plays a crucial role in increasing the imaginary part of the complex permittivity.In addition, the introduction of Fe nanosheets also leads to stronger polarization.Fe/RGO-2 and Fe/RGO-3 show significantε″ resonance fluctuations around 8 and 13 GHz, which may be due to the enhanced interfacial polarization.Due to the low Fe content (0.32–1.22 wt%) in Fe/RGO composites, theu′ andu″ values of all samples are ≈ 1 and ≈ 0 (Fig.S9).The absorbing properties of Fe/RGO composites change significantly with the difference of Fe content.Figures 5b-f and S10 describe the EMW absorption performances of RGO, Fe/RGO-1, Fe/RGO-2, Fe/RGO-3, and Fe/RGO-4 composites with the thickness of the samples varying from 1 to 5.5 mm at 2–18 GHz.The RLminof RGO is - 12.76 dB at 10.91 GHz (3.47 mm).In contrast, the strongest RLminof Fe/RGO-1, Fe/RGO-2, Fe/RGO-3, and Fe/RGO-4 are - 17.08, - 53.38, - 49.57, and - 15.86 dB at 4.31, 2.45, 3.04 and 2.02 mm, respectively, which are higher than those of RGO (Fig.5g).Compared with RLmin, the EAB is more convincing for the absorption performance (the corresponding color image map).For the RGO, the maximum EAB is 2.15 GHz (9.92–12.07 GHz).In detail, the maximum EAB of Fe/RGO-2, Fe/RGO-3, and Fe/RGO-4 achieves the fullKuband absorption, which is 7.52 GHz (10.48–18 GHz), 7.03 GHz (10.97–18 GHz), and 7.45 GHz (10.55–18 GHz) corresponding to the thickness of 2.62, 2.49, and 2.41 mm, respectively (Fig.5h).In particular, Fe/RGO-2 and Fe/RGO-3 composites exhibit high loss strength and wide-band absorption properties compared to other samples, which can be attributed to the synergistic dielectric polarization effect of Fe and RGO in the system.Figure 5i depicts the RL variation curves of RGO, Fe/RGO-1, Fe/RGO-2, Fe/RGO-3, and Fe/RGO-4 at 2.45 mm.At the same thickness, the EMW absorption performance of Fe/RGO shows a trend of increasing first and then decreasing, and moves to low frequency with the increase in Fe content.Compared with RGO, Fe/RGO-2 and Fe/RGO-3 have better EMW absorption performance (Fig.S11).It should be pointed out that the optimal RLminpeaks are shifted toward lower frequencies with increasing sample thickness which could be expressed by the quarterwavelength cancelation law [58]:
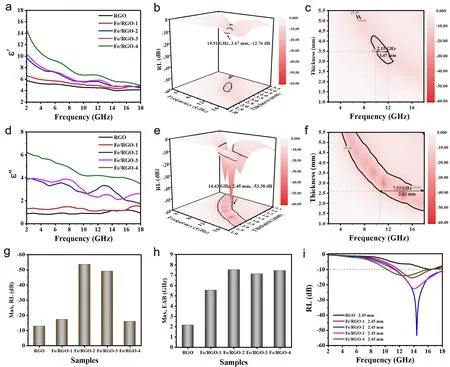
Fig.5 Analysis on EMW absorption performance of Fe/RGO composites with 2 wt% loading.a, d ε′ and ε″ of permeability.3D and 2D colormapping of calculated theoretical RL values with different thickness of b, e RGO and e, f Fe/RGO-2.Summarizations of g maximum RL and h EAB at different thickness for RGO, Fe/RGO-1, Fe/RGO-2, Fe/RGO-3, and Fe/RGO-4 composite samples.i RL value versus frequency for specific thickness values of samples
wheretmis the matching thickness,λrepresent the wavelength of the EMW,texpm is the actual absorber thickness andfmis the matching frequency.It is obvious that thetmvalues of Fe/RGO composites are completely consistent with the curve of quarter-wavelength attenuation law.When the matching thickness of the sample satisfies formula (6), incident wave will reflect 180° on each interface with inverse phases, leading to energy attenuation of EMW.In addition, impedance matching properties should be demanded for an ideal EMW absorber.The EMW absorber with well-matched impedance can decrease the reflection of the EMW and facilitate the absorption.The impedance match value ( ||Zin∕Z0|| ) approaching 1 indicates that the great mass of EMWs enter the absorber to attenuate [59].It can be seen that the impedance matching of RGO at different thicknesses is far away from 1 to varying degrees, indicating that its impedance matching is poor and the RLminvalue is also worse.The impedance matching values of Fe/RGO-2 and Fe/RGO-3 at different thicknesses are very close to 1.The best impedance matching degree and RLminwere corresponding to theλ/4, implying that the preferable performance is due to the outstanding impedance matching.
3.5 Analysis of EMW Absorption Mechanism
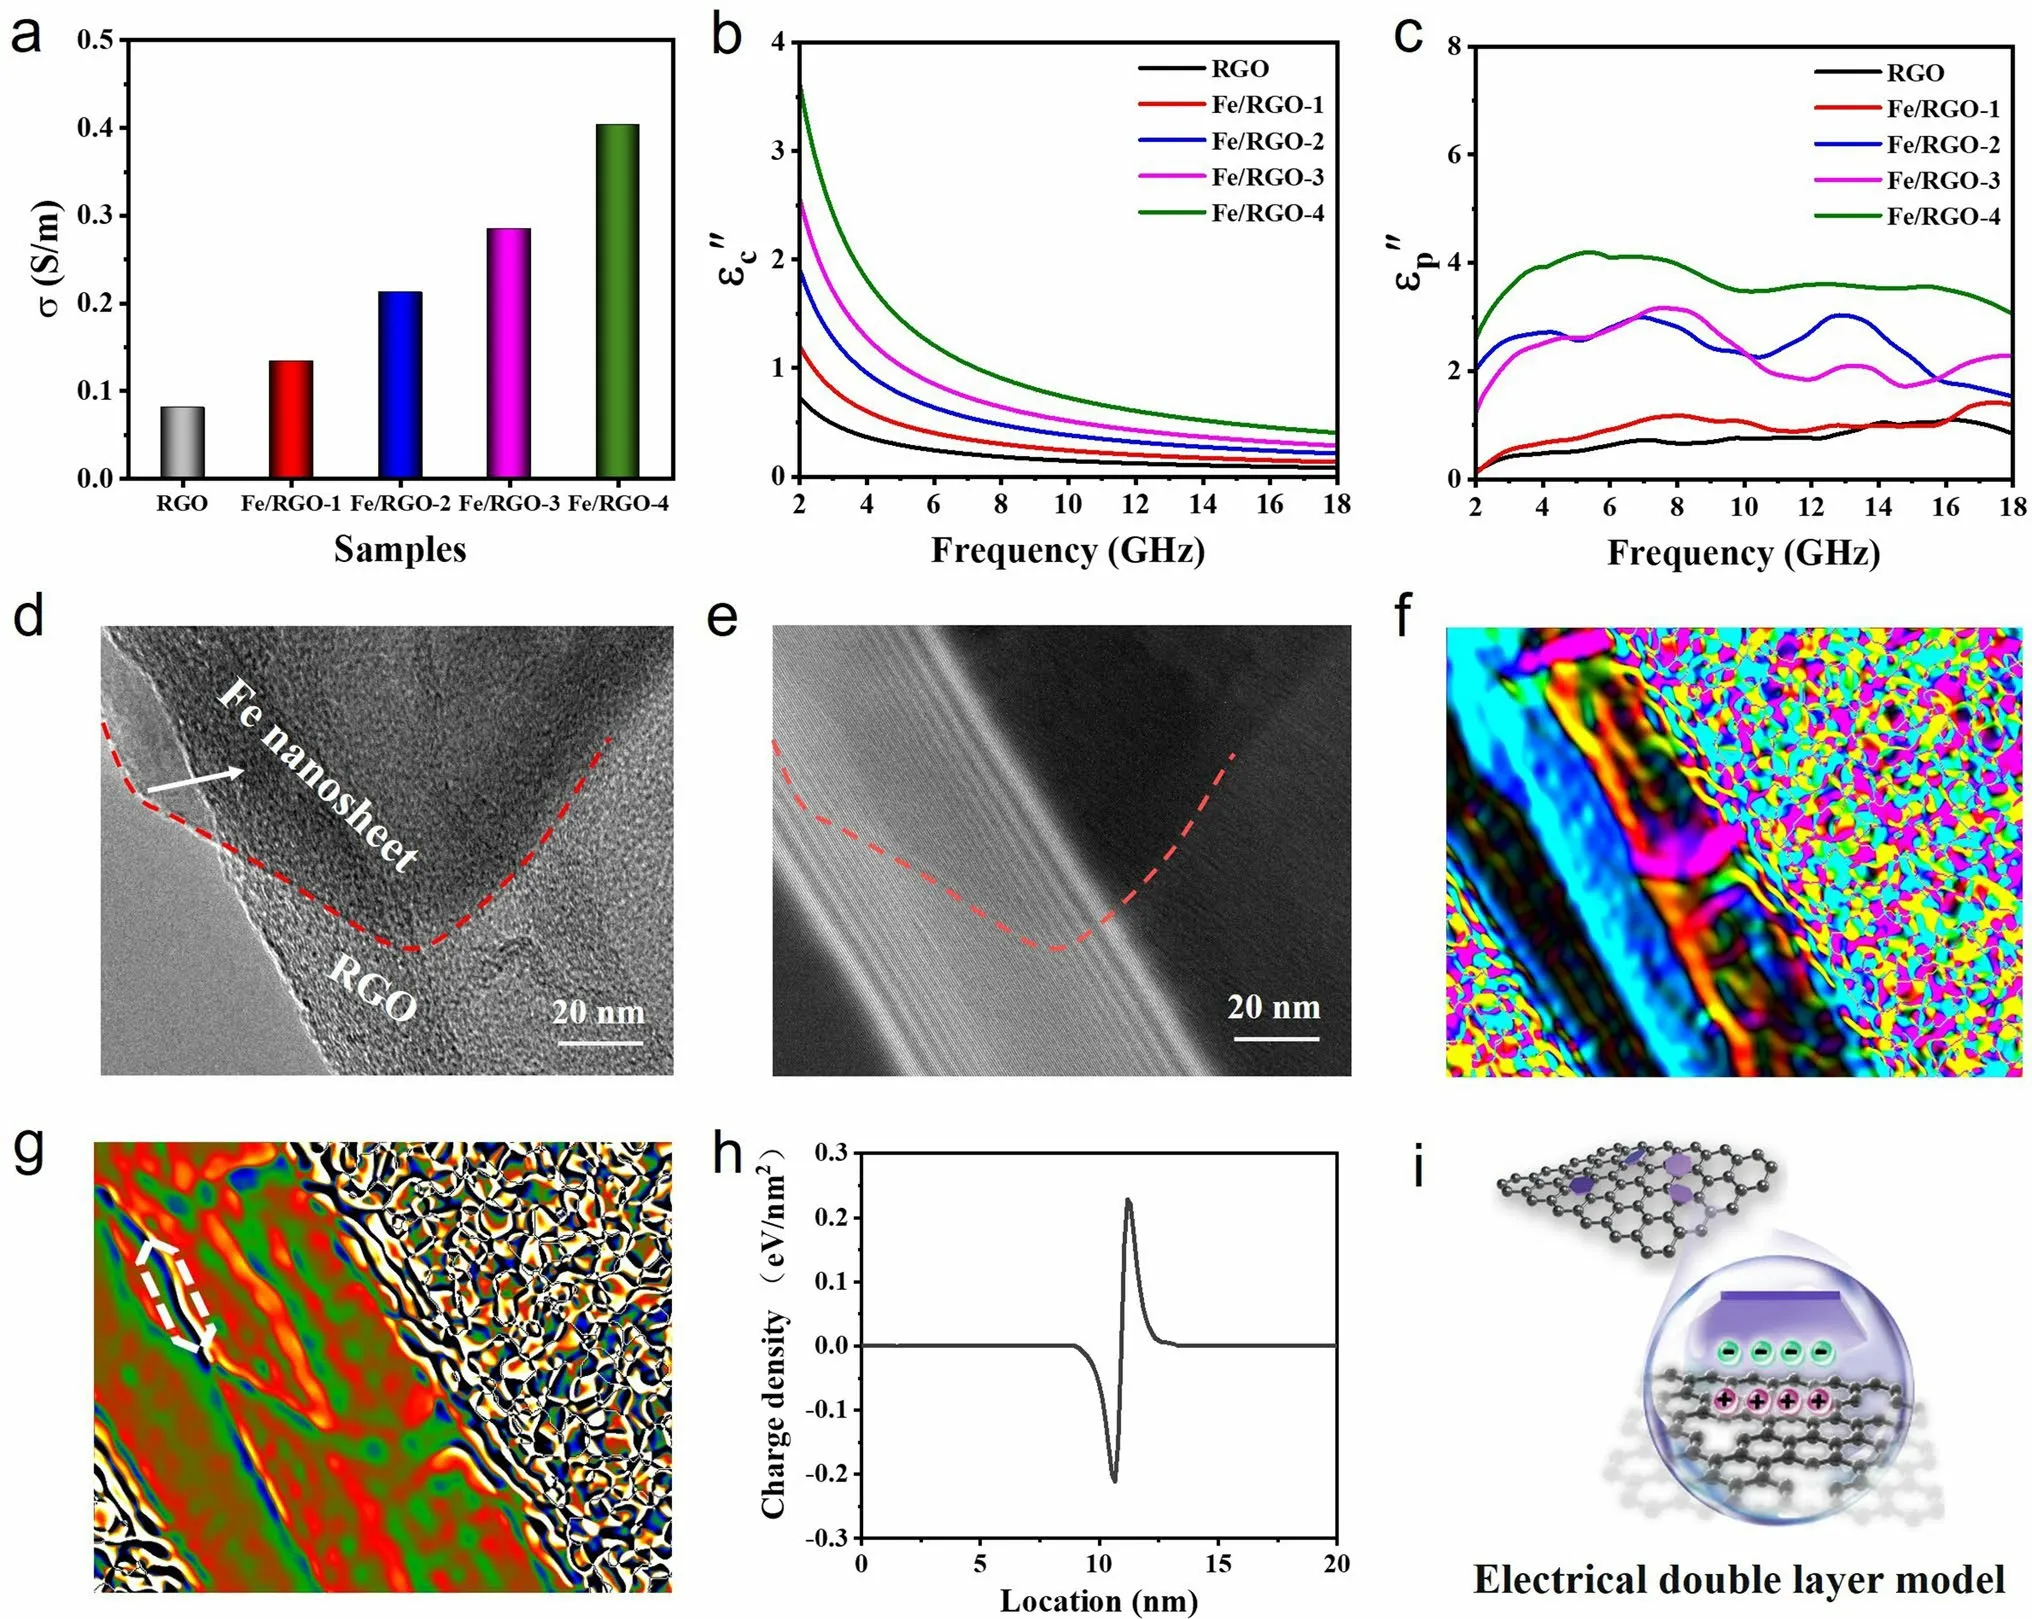
Fig.6 Analysis on EMW absorption mechanisms of Fe/RGO composites.a σ, b εc″, c εp″ of RGO, Fe/RGO-1, Fe/RGO-2, Fe/RGO-3, and Fe/RGO-4.d, e TEM and corresponding off-axis electron holography image, f Electric field distribution, g Charge density map, h Charge density profile along the white region, i The electrical double layer model of Fe/RGO
In order to analyze the effect of Fe content on the EMW absorption performance of RGO, the dielectric loss mechanisms of Fe/RGO are studied, as shown in Fig.6.The free electrons inside the metallic Fe are transferred along the Fe/RGO interface to the RGO in the form of migration and hopping, which play a crucial role in increasing conductivity due to the carrier injection mechanism, as shown in Fig.6a.And the conductance loss is the main factor and decreases with the increase in frequency at low frequency, while the polarization loss plays a leading role at high frequency (Fig.6b, c).With the increase in Fe, the additional injected electrons at the heterogeneous interface increase the conduction loss (εc″) in the EM field.The highεp″ confirms that the charge accumulation and heterogeneous interface of RGO and Fe generates space charge polarization loss.Based on the Debye relaxation theory, the existence of polarization can be proved by the Cole–Cole semicircle, each semicircle of Cole–Cole expresses a Debye relaxation process [60].Figure S12 and Table S2 show theε′–ε″ curves of RGO, Fe/RGO-1, Fe/RGO-2, Fe/RGO-3 and Fe/RGO-4, it can be seen that the number of semicircles increases with the increase in Fe, indicating an enhanced relaxation process compared with RGO.And the conductive loss increases with the increase in conductivity and the polarization loss intensity decreases (theε′–ε″ curve becomes smooth).From the first-principle calculation and carrier transfer characterization, it can be seen that the interfacial electron aggregation and electric field-derived flowing dominated the polarization loss by the carrier injection mechanism of Fe/graphene.We focused on exploring the Fe/RGO interface structure and plotted its electric field and charge density distributions using electron holography (Fig.6d–i).It is obviously observed that there are positive and negative charge distribution around the interfacial region of carbon layer and Fe nanosheet forming an out-plane electric field within the carrier collector interface, leading to an enhanced interfacial polarization relaxation.Unbalanced charge distribution due to electron migration can accumulate around the heterogeneous interface.Under the EM field, the electric dipole turns repeatedly to promote the interfacial polarization so as to considerably consume the EM wave energy.More importantly, increasing attenuation capacity and improving impedance matching characteristics are key factors to achieve excellent EMW absorption performance.The tanδεandαvalues of the Fe/RGO composites increase with the increase in Fe content (Fig.S13).The partial electrons of Fe injected into the graphene vibrate and produce polarization relaxation under microwave, significantly affecting the interface polarization loss and conductance loss.However, more interfaces can obtain high dielectric loss, but the absorption performance is not further improved mainly due to impedance mismatch (the lowZvalues), which is consistent with our previous work [61].Therefore, Fe/RGO-2 and Fe/RGO-3 have excellent absorbing performance due to its suitable attenuation characteristics and impedance matching.For comparison, the absorption properties of Fe/RGO′ composites without heterogeneous interfacial interaction were investigated by mechanical mixing in the same ratio as above with 2 wt% filler loading.Theε′ andε″ curves of Fe/RGO-1′, Fe/RGO-2′, Fe/RGO-3′, and Fe/RGO-4′ change weakly and does not exhibit dielectric dispersion behavior with the increase in Fe content (Fig.S14).Therefore, there exists an interfacial electronic interaction between RGO and Fe in Fe/RGO composites, which would affect the dielectric properties of RGO and thus have excellent absorption properties.
Based on the above mechanism analysis, in order to further clarify the mechanism of graphene’s electronic structure and dielectric property response behavior, this work explored the electrical transport properties of Fe/RGO at micro–nanoscale.Electrostatic interactions have been widely used to characterize the conductivity, potential distribution, surface charge distribution and dielectric properties of various samples by C-AFM, KPFM and EFM measurements, etc.The surface topography and the corresponding current distribution images of Fe/RGO can be obtained by scanning the micro-area surface with C-AFM, and theI–Vcurves can be further obtained at specific points.As shown in Fig.7a–d, the conductivity has a significant difference in different regions as marked by the white lines.The current is lower in the RGO area (dark area) and higher in the close contact area of the Fe/RGO interface (light area).In addition, theI–Vcurves of Fe/RGO surface region show that the current of Fe/RGO increases with the increase in contact area and binding tightness, indicating that the electron migration and hopping jointly determine the conductivity of RGO, which is consistent with the electrical properties analysis results of first principles calculation, FG-FET and powders conductivity analysis (Fig.S15).It can be seen from the topographical height and surface potential distribution images of Fe/RGO that RGO layers show uniform surface potential at the same location, which indicates that the electronic properties of RGO is not significantly affected by air doped charges or substrate defects (Fig.7e, f).The surface potential of Fe/RGO region increases with the position bulge of Fe, indicating that the degree of charge transfer between Fe and RGO increases due to the interface continuity.Figure 7g shows the relative Fermi level offset of Fe/RGO with the interface contact position according to the Fermi level formula, whereVFand?represent Fermi velocity and Planck constant.It can be calculated that the carrier densities of Fe/RGO in different regions are about 0.18 × 10¹³, 1.69 × 10¹³and 2.18 × 1013cm-2, respectively (Fig.7h).The surface charge distribution and dielectric properties of Fe/RGO in different regions are investigated under the influence of conductive probe by EFM.The measured phase change is defined as the difference between the actual and the free vibration phase of the probe.The influence of the interaction between the probe and the sample surface on the probe motion is explained by introducing a force constant, and the formula is as follows [63]:
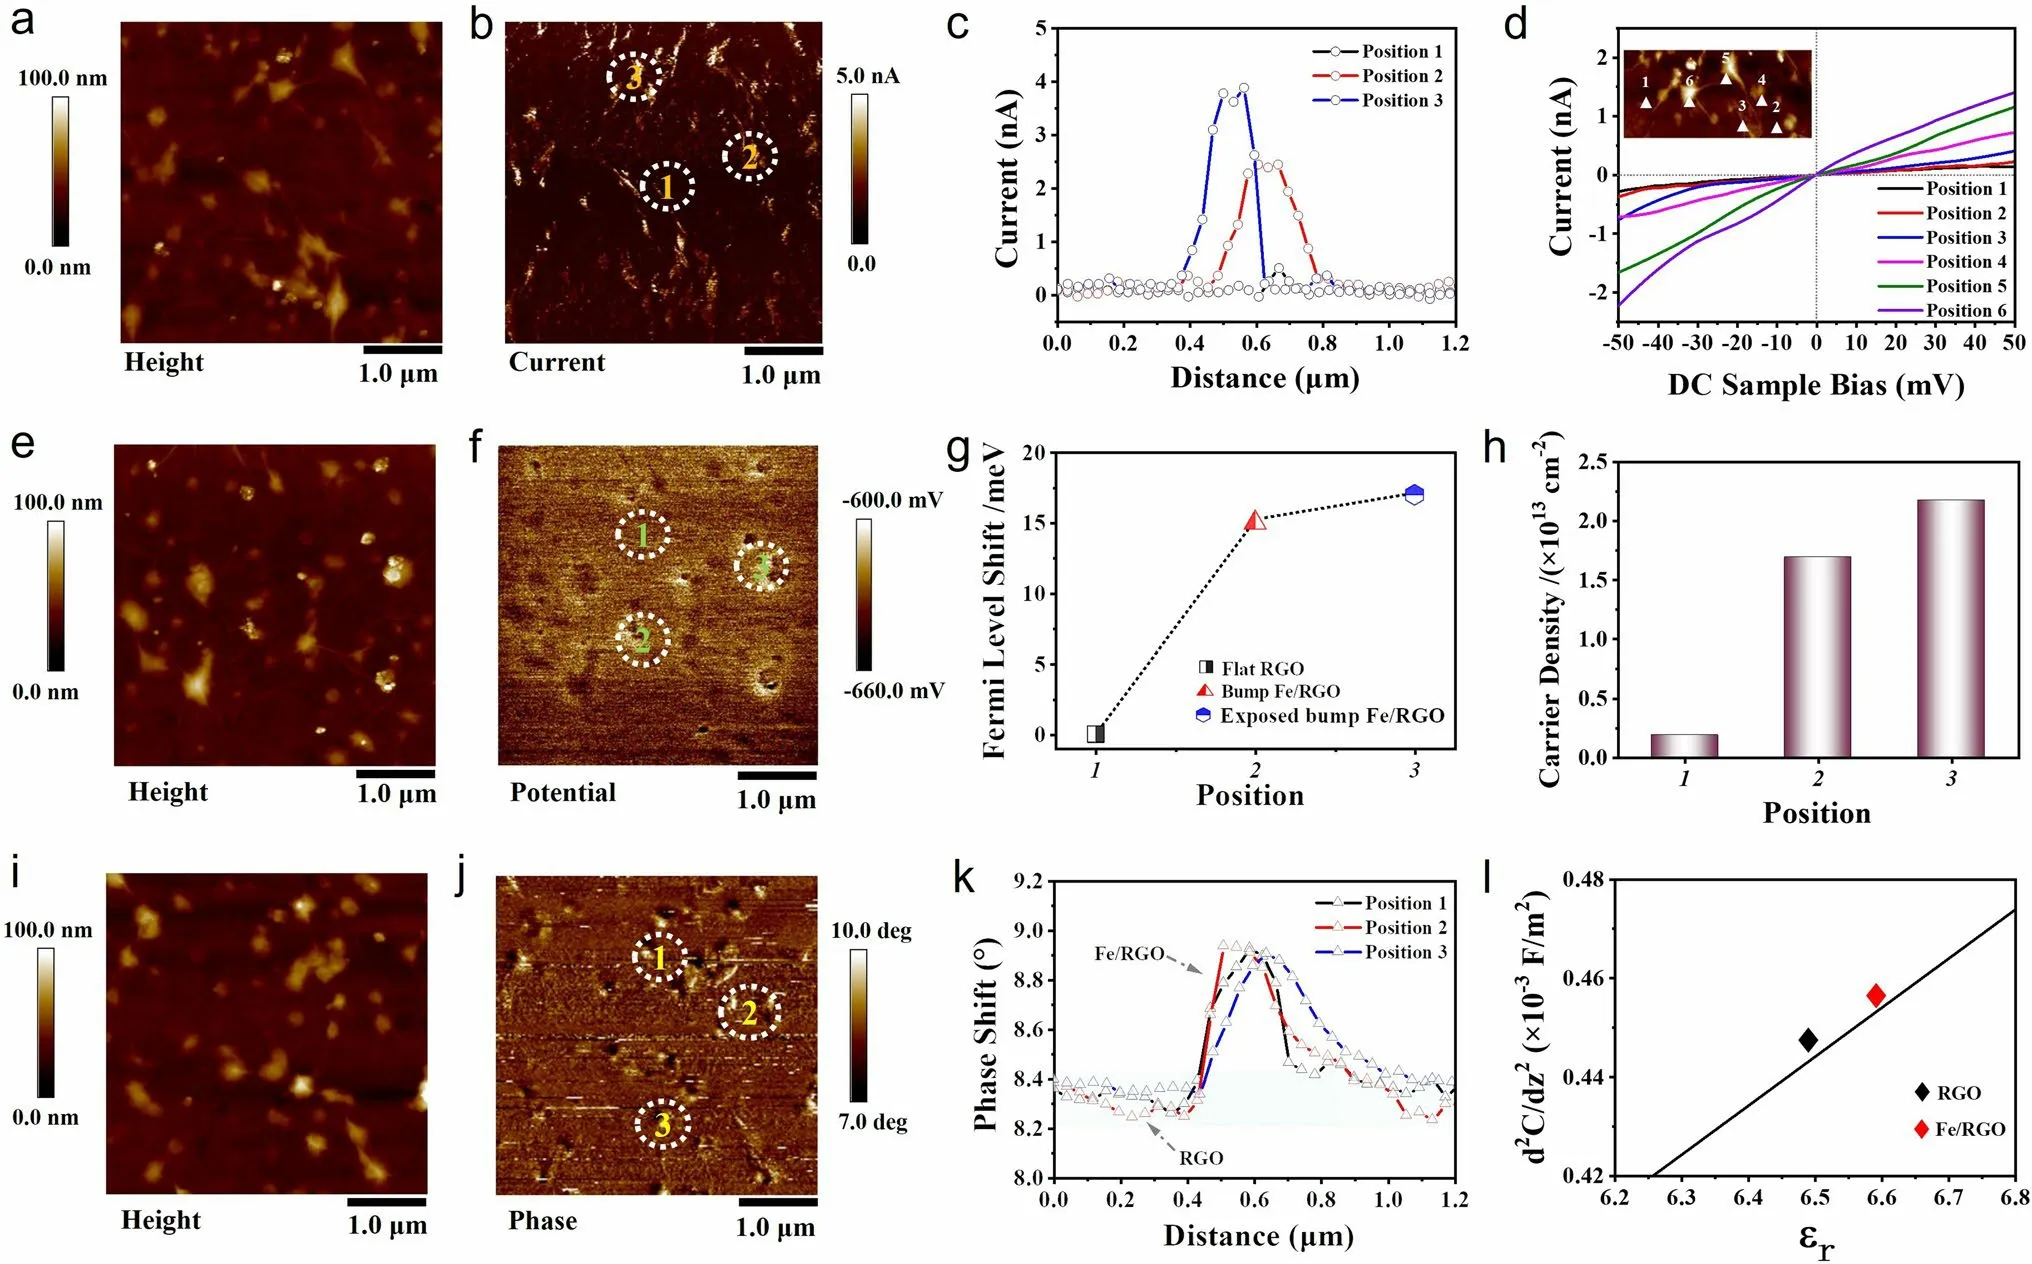
Fig.7 Electrical measurement of the Fe/RGO.a, e, i AFM topographic images of Fe/RGO.b C-AFM current distribution image.The current distribution curves c and I–V curves d of the calibration position region.f KPFM surface potential image.g The shift of the RGO Fermi level and h carrier density values varies with position.j and k Δφ distribution images and curves of calibration position region of Fe/RGO, l dielectric response curve of EFM
where Δφrepresents the phase difference,Qandkare the quality factors and force constants of the probe,k′is the electrostatic force constant, andqtipandqsurfrepresent the surface charges of the probe and sample.It can be seen from the above equation that the phase difference increases with the increase in the surface charge density of the sample.Therefore, it can be seen from Fig.7i–k that the charge is mostly distributed in the convex part of RGO coated Fe surface, while the charge is less distributed in the flat part of RGO, indicating that the presence of Fe increases the conductivity of RGO.Considering only electrostatic force effect, the capacitance model can be considered between the probe and the sample, and the relationship between the phase difference ( Δφ(2ω) ) and permittivity (εr) can be expressed as [64]:
whereθ0andRare the conical tip angle and tip radius of the probe.ε0is the permittivity of the vacuum, andCis the capacitance between substrate and probe.handεrare the local thickness and relative permittivity, andVACis constant during scanning.The parameters of the local dielectric detection are shown in Table S1.From Fig.7l, the average permittivity of RGO and Fe/RGO in different regions can be roughly calculated according to thefitting formula, and the calculated results are 6.49 and 6.58.The permittivity of Fe/RGO region is higher than that of RGO, which is consistent with the changing trend of dielectric parameters in Figs.3 and 5.Therefore, it can be inferred that Fe/RGO heterogeneous interfaces with work function differences and orbital hybrid interactions promote carrier injection and redistribution in the form of ohmic contact, which enhances conductance loss, interface and dipole polarization loss and provides infinite possibilities for the tunability of dielectric and absorption properties.At the same time, we also explored the influence of trace transition metal elements (Co and Ni) on the dielectric properties of graphene, as shown in Fig.S16.The results showed that the dielectric dispersion characteristic of graphene was improved greatly by the carrier injection mechanism resulting in significant absorption performance, which indicates that the mechanism is of universal adaptability to the improvement of graphene dielectric properties.
To have a better understanding of EMW absorption mechanism for Fe/RGO, a schematic diagram exhibiting is shown in Fig.8.The excellent absorption properties of Fe/RGO composites can be attributed to conduction loss, polarization relaxation and better impedance matching.Firstly, the polarization relaxation related to the heterogeneous interfaces formed between RGO and Fe is beneficial in enhancing the interface polarization.Secondly, the improved conductivity caused by the carrier injection mechanism (including electron migration and hopping) effectively enhances the conductance loss, and the resulting charge aggregation and rearrangement further increases the interface polarization loss.This phenomenon is mainly attributed to the ohmic contact form between the RGO and Fe interface based on the difference of work function, which allows the free electrons in Fe to be better injected into the graphene.Thirdly, the unique lamellar structure of RGO can effectively improve the electron transport efficiency, resulting in high conductive loss.Fourthly, the dipole polarization caused by defects in the edge and in-plane regions of Fe/RGO increases the dielectric loss.Furthermore, the proper complex permittivity of Fe/RGO adjusted by Fe content provided an optimal impedance matching, which helps incident microwaves to enter the Fe/RGO composite.Consequently, multiple loss mechanisms and good impedance matching in Fe/RGO can be obtained significant EMW absorption performance.Figure S17 summarizes the EMW absorption properties of RGObased composites reported in the recent literature (Table S3).Compared with other RGO absorbers, the Fe/RGO composite in this study has lightweight and broadband microwave absorption properties at a low fill loading (2 wt%), proving the feasibility of our strategy.
4 Conclusion
In summary, this work designed and developed a carrier injection strategy for fully exploiting the dielectric properties of graphene based on the theoretical guidance of the different electron gain and loss capabilities.By regulating the amount of Fe nanosheets in Fe/RGO, the optimizing dielectric dispersion properties of graphene are achieved through carrier injection mechanism formed by ohmic contact between RGO and Fe interface.It is revealed that electron migration directly increases the conductivity of graphene at the Fe/RGO interface and the resulting charge accumulation and rearrangement effectively increase the conductivity loss, dipole polarization and interfacial polarization loss, and the electron holography confirmed that the Fe/RGO possessed significant charge distribution around the interface location compared to RGO.As a result, the Fe/RGO-2 exhibits excellent EMW absorption performance at a low loading of 2 wt% that the RLminvalue can reach - 53.38 dB at 13.56 GHz (2.45 mm) and the EAB is 7.52 GHz (10.48–18 GHz, covering the fullKuband) at 2.62 mm.This present work elucidates an intrinsic insight into the dielectric polarization behavior of graphene-based materials and provides a reliable strategy for the controllable fabrication of novel lightweight EMW absorbing materials.
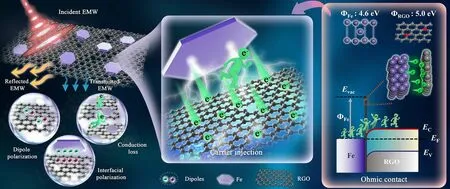
Fig.8 Schematic diagram of EMW absorption of Fe/RGO
AcknowledgementsThis work was supported by National Natural Science Foundation of China (NSFC 52372041, 52302087, 51772060, 51672059 and 51621091), Heilongjiang Touyan Team Program, the Fundamental Research Funds for the Central Universities (Grant No.HIT.OCEF.2021003) and the Shanghai Aerospace Science and Technology Innovation Fund (SAST2022-60).
Declarations
Conflict of interestThe authors declare no interest conflict.They have no known competing financial interests or personal relationships that could have appeared to influence the work reported in this paper.
Open AccessThis article is licensed under a Creative Commons Attribution 4.0 International License, which permits use, sharing, adaptation, distribution and reproduction in any medium or format, as long as you give appropriate credit to the original author(s) and the source, provide a link to the Creative Commons licence, and indicate if changes were made.The images or other third party material in this article are included in the article’s Creative Commons licence, unless indicated otherwise in a credit line to the material.If material is not included in the article’s Creative Commons licence and your intended use is not permitted by statutory regulation or exceeds the permitted use, you will need to obtain permission directly from the copyright holder.To view a copy of this licence, visit http:// creat iveco mmons.org/ licen ses/ by/4.0/.
Supplementary InformationThe online version contains supplementary material available at https:// doi.org/ 10.1007/ s40820- 023- 01280-6.
- Nano-Micro Letters的其它文章
- A Review on Engineering Design for Enhancing Interfacial Contact in Solid-State Lithium–Sulfur Batteries
- Hierarchically Structured Nb2O5 Microflowers with Enhanced Capacity and Fast-Charging Capability for Flexible Planar Sodium Ion Micro-Supercapacitors
- Superhydrophobic Surface-Assisted Preparation of Microspheres and Supraparticles and Their Applications
- Proof of Aerobically Autoxidized Self-Charge Concept Based on Single Catechol-Enriched Carbon Cathode Material
- Bioinspired Multifunctional Self-Sensing Actuated Gradient Hydrogel for Soft-Hard Robot Remote Interaction
- Decade Milestone Advancement of Defect-Engineered g-C3N4 for Solar Catalytic Applications