
Development of Dα band symmetrical visible optical diagnostic for boundary reconstruction on EAST tokamak
2024-03-19 02:36MingCHEN陳明BiaoSHEN沈飊ShinichiroKADOBihaoGUO郭筆豪DalongCHEN陳大龍FuruiCAI蔡福瑞andBingjiaXIAO肖炳甲
Plasma Science and Technology 2024年2期
Ming CHEN (陳明),Biao SHEN (沈飊),Shinichiro KADO,Bihao GUO (郭筆豪),Dalong CHEN (陳大龍),Furui CAI (蔡福瑞) and Bingjia XIAO (肖炳甲)
1 Hefei Institutes of Physical Science,Chinese Academy of Sciences,Hefei 230031,People’s Republic of China
2 Science Island Branch,Graduate School of University of Science and Technology of China,Hefei 230026,People’s Republic of China
3 Institute of Advanced Energy,Kyoto University,Uji 611-0011,Japan
4 Graduate School of Energy Science,Kyoto University,Uji 611-0011,Japan
Abstract To investigate the potential of utilizing visible spectral imaging for controlling the plasma boundary shape during stable operation of plasma in future tokamak,a Dα band symmetric visible light diagnostic system was designed and implemented on the Experimental Advanced Superconducting Tokamak (EAST).This system leverages two symmetric optics for joint plasma imaging.The optical system exhibits a spatial resolution less than 2 mm at the poloidal cross-section,distortion within the field of view below 10%,and relative illumination of 91%.The high-quality images obtained enable clear observation of both the plasma boundary position and the characteristics of components within the vacuum vessel.Following system calibration and coordinate transformation,the image coordinate boundary features are mapped to the tokamak coordinate system.Utilizing this system,the plasma boundary was reconstructed,and the resulting representation showed alignment with the EFIT (Equilibrium Fitting) results.This underscores the system’s superior performance in boundary reconstruction applications and provides a diagnostic foundation for boundary shape control based on visible spectral imaging.
Keywords: visible optical diagnostic,plasma,boundary reconstruction,EAST
1.Introduction
The reconstruction and control of plasma shape are crucial for tokamak devices,serving as the fundamental condition for stable plasma operation.Presently,the magnetic probes and equilibrium fitting (EFIT) code are employed universally in tokamak devices for magnetic equilibrium reconstruction and determining the last closed flux surface (LCFS)position as the plasma boundary.Nevertheless,this method has several limitations.(1) The complex internal structure of the vacuum chamber induces eddy currents,leading to hysteresis and distortion of the magnetic probe signal.(2) In electromagnetic signal processing,the bias of the operational amplifier and the leakage current of the capacitor in the integrator can induce a long-term drift of the integrated value.(3) Future tokamak devices will expose the magnetic probes to a larger neutron flux,potentially damaging the probes.These limitations contribute to the deterioration or even loss of magnetic measurement signals over time [1].
Visible light-based visual measurement is an absolute measurement technique,which yields results unaffected by the complex electromagnetic environment within the vacuum vessel.Furthermore,as this method’s diagnostics are performed within the port,it offers superior maintainability compared to magnetic probes installed within or outside the vacuum chamber [2].Hence,visual measurement leveraging visible light exhibits significant potential for plasma shape detection.With the advancements in computer vision measurement technology,spectroscopic diagnostics have been employed for various applications in tokamak devices.The method of utilizing infrared camera images to acquire the temperature and heat load of the first wall in tokamak devices has been implemented in various devices,including EAST [3],JET [4],and WEST [5].The line-integrated electron density profiles are measured on HL-2A using visible bremsstrahlung diagnostics [6].Plasma filaments are analyzed on MAST utilizing fast visible imaging techniques [7].
Research on plasma boundary optical imaging systems has been conducted on various devices,including JET [8],KSTAR [9,10],MAST [11],and TCV [12].JET team reconstructed the high field side boundary using phase consistency,and the reconstructed result from a single frame exhibited good agreement with that of EFIT [8].On KSTAR,the plasma radius and vertical position were reconstructed using a combination of manual labeling and automatic detection,and the reconstructed results aligned with the trend of magnetic reconstruction [10].On MAST,the entire boundary was reconstructed offline,achieving spatial agreement within 19 mm compared to EFIT [11].The TCV team employed an optical imaging system to deliver feedback control of vertical displacement for a duration of approximately one second [12].In conclusion,significant progress has been achieved in the research on plasma boundary reconstruction using optical imaging,demonstrating the promising potential of optical imaging for plasma shape and position control.
To assess the feasibility of the boundary reconstruction method using visible spectrum imaging in an ITER-like fusion reactor,a new optical system was developed specifically for boundary reconstruction on EAST.Section 2 primarily presents the optical requirements and the design of the optics.Section 3 presents the performance evaluation and test results of the newly developed optical system on EAST.Section 4 verifies the feasibility of utilizing this optical system for boundary reconstruction.Section 5 provides a summary of the entire text and outlines future research plans.
2.Optical design
2.1.Design requirement
Currently,deuterium and tritium isotopes of hydrogen are used as fuel for fusion devices,and deuterium is the main plasma component in EAST experiment.Inside a tokamak,the plasma is confined within the LCFS by a magnetic field to maintain a relatively high electron density and temperature without directly contacting the solid material.Conversely,when plasma particles and energy diffuse from the confined region to outside of LCFS,they will lose to the divertor target rapidly due to the large particle flux and heat conductivity parallel to magnetic field,resulting in a low electron density and temperature outside LCFS.The electron density and temperature difference between the two sides of LCFS forms a pedestal region with large gradients[13].Hence,neutral deuterium atom,with an ionization energy of 13.6 eV,is localized outside the LCFS and hardly exists inside the high temperature confined region to have a sharp atom density decrease on the LCFS.Since photon emission power from deuterium is proportional to deuterium atom density and positively related to electron density and temperature,the emission distribution pattern from deuterium atom usually has a response to the shape of LCFS that a bright illumination surface is usually observed on or near the LCFS [14].This research employs the Dα(656.1 nm) line,which is within the visible light spectrum,to measure the surface illuminated by deuterium and estimate the location of the LCFS.Therefore,the design wavelength of the optics is 656.1 nm.
The plasma discharge in the EAST device’s tokamak encompasses three phases: rump-up phase,flat-top phase,and rump-down phase (figure 1).The plasma is situated within the vacuum chamber’s poloidal cross-section.Notably,during the flat top stage,the plasma’s poloidal cross-sectional area is at its maximum,with the plasma boundary situating near the device’s inner wall.For comprehensive observation of the complete plasma boundary in the flat-top phase,the optical system needs to observe the plasma tangentially,ensuring that the optical field of view(FOV) encompasses the entire poloidal cross-section of the device’s inner wall.
The plasma shape control method based on GAP (the distance between the plasma boundary and the vacuum vessel) in EAST can achieve the shape control accuracy within 10 mm [15].In order to serve as a means of plasma shape reconstruction and control,the reconstruction accuracy of the optical system should be better than the current shape control accuracy.Consequently,to serve as the signal source for the plasma control system,the minimum spatial resolution of the optical system should be less than 10 mm across the entire plasma boundary region.To adequately account for potential installation and calibration errors,as well as errors in the reconstruction model,the optical system’s minimum resolution should be less than 5 mm [16].
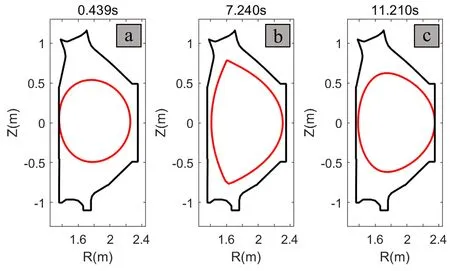
Figure 1.Poloidal cross-sectional of plasma at different phases of 12 s discharge.The black line represents the wall of the vacuum vessel,and the red line represents LCFS.(a) Rump-up phase,(b)flat-top discharge phase,(c) rump-down phase.
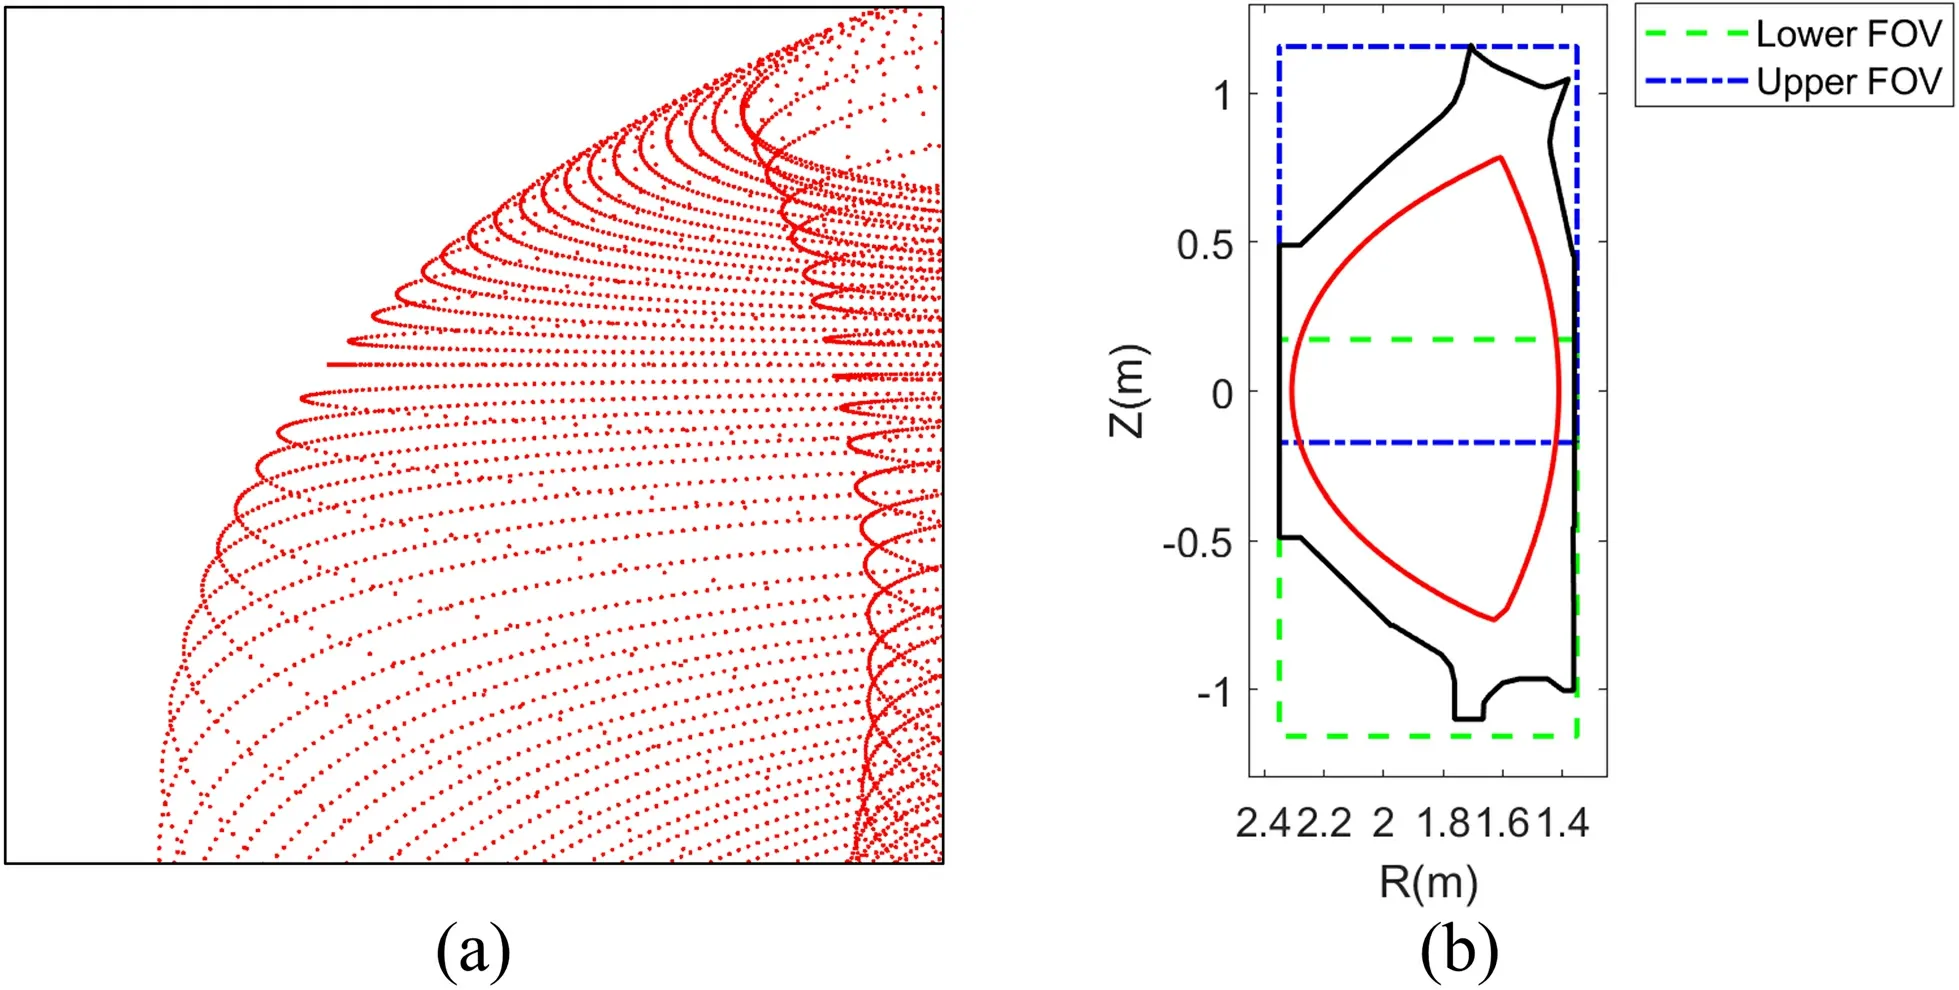
Figure 2.FOVs of the optics.(a) FOV simulation of upper optical system.The black box represents the simulated FOV area covering the upper half of the plasma,while the red dots are evenly distributed on the surface of the plasma.(b) FOVs of both optics.The blue dashed line area depicts the upper FOV,while the green dashed line area signifies the lower FOV.
2.2.Optical design
According to the spatial emission characteristics of the EAST device,two symmetrical optics about theZ=0 m plane are designed to image the upper and lower parts of the plasma,respectively.Figure 2(a) presents a simulation of plasma imaging within the upper FOV.Figure 2(b) illustrates the FOVs of the two optics.Each FOV covers a rectangular area of 1330 mm × 1000 mm.The optical systems corresponding to the two FOVs operate independently,yet their FOVs intersect near the mid-plane,allowing for crossverification of the reconstructed plasma shape and position near the mid-plane using both optical systems.Moreover,each optical system’s FOV corresponds to a fraction of the observation area,achieving a higher spatial resolution than a traditional single optical system.
Each optical system is composed of eight lenses and two mirrors,forming a periscopic transmission system.Figure 3 illustrates the optical structure used to image the upper portion of the plasma,where two planar mirrors (labelled 2 and 3 in the figure) are utilized to guide the light beam.This optical system situates the object plane at the device’s poloidal cross-section,and positions the focal plane (camera sensor) outside the vacuum vessel.The optics of the lower FOV is completely symmetrical to that of the upper FOV.Figure 4 provides a detailed illustration of the optics.Located at the forefront of the optical assembly is the light beam refraction module,delineated by the green pentagonal dotted line in figure 4(a).This module,comprising a quartz glass window,lens (L1),and mirror,is designed to deflect the light beam to an angle parallel to optical axis of front-end optics.The quartz glass window in this module can be replaced when subjected to plasma deposition,thereby extending the operation life of the optics.This module can be adjusted during installation,allowing fine-tuning of the photographed plasma area.Subsequently,the field lenses(L2,L3) and collimating lens (L4) form a relay system that directs the light towards the rear mirror as depicted in figure 4(b).After the light beam is deflected 90° by the mirror,it travels through a vacuum glass isolation flange made of fused quartz.It then traverses four converging lenses (L5-L8)and a Dαfilter before forming an image on the camera’s imaging surface.The optics contain two imaging planes: the first one is located before L2,and the second one is located at the camera sensor position.In the current implementation,an 2 mm thick Hαfilter with a center wavelength of 656.28 nm and a full width at half maximum of 7 nm is used.At a maximum incidence angle of 12°,the center wavelength of this filter has blue shifted by about 3.5 nm,and the actual center is 652.8 nm.This will result in a significant decrease in light intensity,which will be improved by optimizing the central wavelength and bandwidth of the filter in the future.In this design,the distance from the center of the mirror to the plane mirror at the vacuum flange measures 178 mm,the total distance from the imaging surface to the center of the mirror is 550.3 mm,and the distance between the centers of the two mirrors is 1625 mm.
3.Performance evaluation and system installation
3.1.Performance simulation
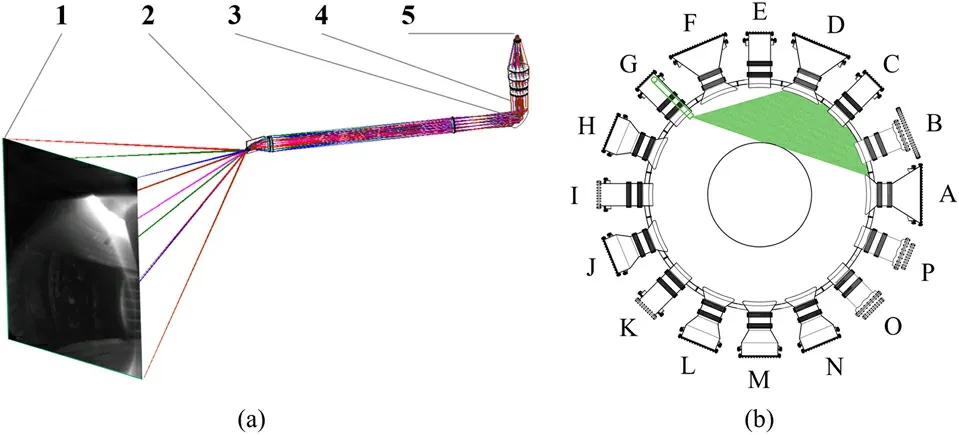
Figure 3.(a) Structure of optics.1 is the poloidal cross-section in the vacuum vessel; 2 and 3 are two flat steering mirrors used to refract the beam; 4 is the position of the vacuum flange,the optics above it is located on the atmospheric side,the optics below it is located in the vacuum vessel,and 5 is the position of the focal plane.(b) Horizontal cross section of the vacuum chamber.The optics is installed in port G,the green area is the corresponding horizontal FOV of this optics.
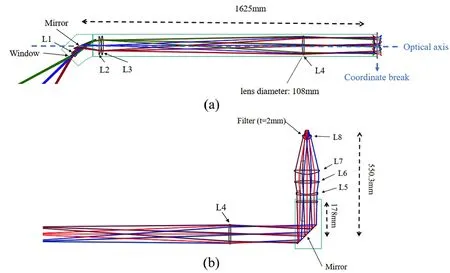
Figure 4.Detailed structure of optics,L1-L8 are lenses.(a) Front-end optics,(b) back-end optics.There is a coordinate break at the end of(a),corresponding to the center of mirror in (b),the optics after mirror in (b) has been hidden in (a).
In general,an optical system acts as a linear,low-pass spatial filter,skilled at transmitting low-frequency information representing the object’s brightness contours,but less efficient in conveying high-frequency details of the object.To assess the designed optical system’s capability to discern plasma details,the Modulation Transfer Function (MTF)curve of the system at varying positions within the FOV was determined through software simulation,as shown in figure 5.The MTF serves as a quantitative index for evaluating the image quality of an imaging system.It characterizes the transmission ability of the imaging system for image details with different spatial frequency components.The camera parameters utilized for the testing are detailed in section 4.1.At the camera’s spatial resolution (62.5 cycles/mm),all FOV positions have MTF values exceeding 0.5,indicating high enough spatial resolution suitable to selected camera.
In high-precision imaging applications like plasma boundary reconstruction,distortion can significantly impact imaging range,image quality,and accuracy,thus necessitating an accurate evaluation of the optical system’s distortion.Optical distortion denotes the discrepancy between the actual and ideal images,resulting from the spherical aberration and other optical elements during the imaging process of the system.The simulation of optical distortion is depicted in figure 6.This optical system exhibits negative distortion,with the image center position remaining unchanged and the image proportion decreasing as the distance from the center increases (figure 6(a)).Due to the presence of negative distortion,the actual field of view will contract inward on the imaging plane (figure 6(b)).Within the required imaging plane range,the optical system’s maximum distortion is less than 10%,and the distorted FOV can be fully captured on the camera sensor.
Simulation results indicate that the optical system exhibits high-quality imaging at the camera’s spatial resolution.Given that the camera sensor comprises 1710 pixels in the vertical direction,the theoretical resolution of the imaging surface corresponding to 1330 mm is 0.8 mm.The distortion remains less than 10%,with simulation results indicating that it will not diminish the actual imaging range.In conclusion,the system can fulfill the requirements for the plasma FOV and imaging clarity.
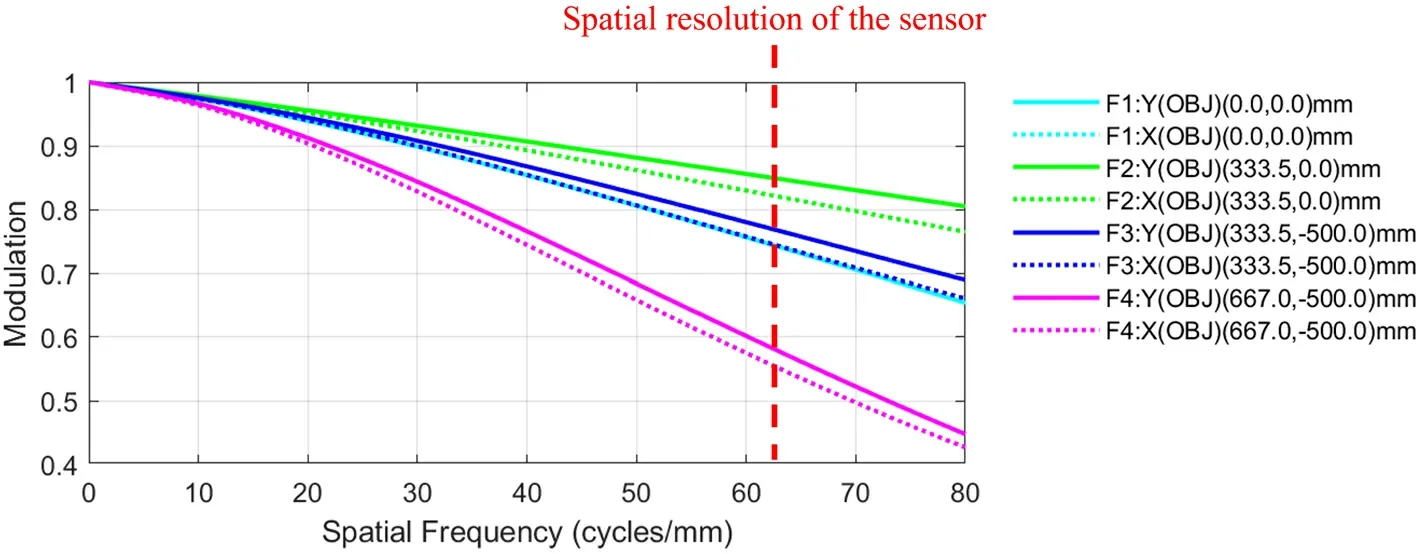
Figure 5.MTF curves corresponding to different positions in the FOV.(0.0,0.0) mm corresponds to the center of the FOV described in section 2.2,the solid line (e.g.F1: Y ) represents the MTF curve in the vertical direction,while the dashed line (e.g.F1: X) represents the MTF curve in the horizontal direction,the red vertical dashed line represents the spatial resolution position of the sensor (62.5 cycles/mm)
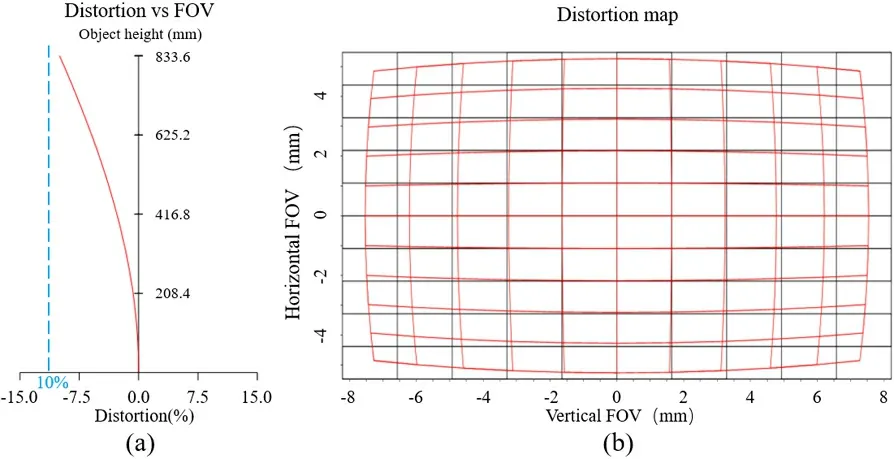
Figure 6.Optical distortion analysis.(a) The relationship between distortion and object height,(b) distortion map.Due to negative distortion,all positions in the required FOV can be imaged on the sensor
3.2.Performance test
The resolution of the optical system relies not solely on the optics,but also on the pixel size and layout of the acquisition sensor.As the pixels of the CMOS sensor are square and have different distances between pixel centers in different directions,the pixel density will change with the angle along the CMOS,resulting in varying system resolution across different sensor directions.To evaluate the resolution of the whole optical system,the ISO 12233 resolution test card was captured using a test camera.The test setup is shown in figure 7(a),and the results are depicted in figure 7(b) [17].In region 1,the demarcation between the accurately resolved and unresolved areas falls between 8 and 9,considering the 100X scale of the test card,which results in a reading of 850.Similarly,in region 2,the demarcation falls between 5 and 6,resulting in a reading of 550.As per equation (1),the respective resolutions for these regions should be 1259 LW/PH and 814 LW/PH,respectively.
LW/PH,an abbreviation for Line Width per Picture Height,is a common metric in photography.It denotes the number of distinguishable lines within the FOV corresponding to each image height.The resolution corresponding to the horizontal direction of 1259 LW/PH is 1.1 mm,slightly higher than the 0.8 mm in simulation analysis,which is caused by manufacturing and installation errors.The resolution corresponding to 814 LW/PH in the 45 degree oblique direction is 1.7 mm,which is lower than the 1.1 mm in the horizontal direction.This is due to the different pixel densities in different directions of the sensor.
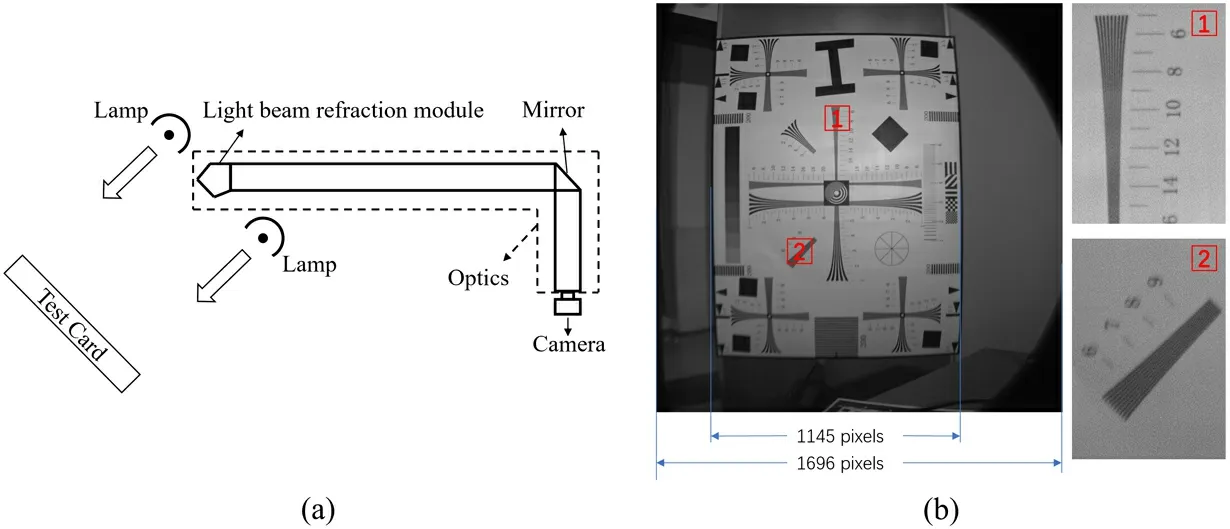
Figure 7.(a) Sketch of the test setup: a test card is positioned in front of the optical system’s end.Two lamps are used to illuminate the test card,and images are captured using a camera installed at the opposite end of the optics,(b) ISO 12233 resolution test chart captured by optical system
The relative illumination of an optical system refers to the disparity in brightness between the image’s center and its edges.Low relative illumination can result in a dark angle at the image’s periphery,making it challenging to recognize the image’s details and boundary features.The relative illumination of the optical system was assessed using an A6 size(140 mm × 91 mm) LED flat light source,serving as a uniform surface light source (figure 8(a)),which can achieve uniformity of the brightness greater than 95% on the surface.The illuminated flat light source was positioned in front of the optics window,and images were captured with a camera of 4/3 inch sensor size and a resolution of 4414×2882(figure 8(b)).The gray distribution of the A-A position is presented in figure 8(c).The brightness of the image’s middle area exceeds that at the edge.For the sensor area used by EAST,which measures 13.68 mm in length,the highest gray value is 184 and the lowest is 167,yielding a relative illumination of about 167÷184 ≈91%.Although the spatial resolution has decreased compared to the simulation results due to errors introduced during manufacturing and installation,the actual accuracy still meets the requirements of the boundary reconstruction system.With a relative illumination of 91%,the small brightness difference between the image’s center and edge satisfies the requirements of plasma boundary detection.
3.3.Installation on EAST
After the installation and debugging of the system,the plasma image of the EAST device during discharge was captured stably.Figure 9 presents images of the flat top stage of shot #105240 during discharge.The FOV of the optical system can completely cover the area where the plasma is located.
Figure 9(a) allows observation of the strike point’s position outside the upper divertor,a portion of the area beneath the vacuum vessel’s horizontal port,and the inner wall area of the vacuum vessel on both sides of the image.The observable vacuum vessel area aligns with the design FOV.The image distinctly presents features of the vacuum vessel such as tile corners and joints,tile bolts,and window antennas,indicating the system’s satisfactory performance in clearly imaging the characteristics of the vacuum vessel and the plasma boundary.The figure also illustrates the location of the plasma characteristics.The plasma boundary features on the high field side appear distinctly as a clear bright band,while the characteristics of plasma boundary on the low field side are slightly fainter,which is a slightly wide bright band.

Figure 8.Relative illumination test.(a) Flat-panel light source placed in front of window,(b) images captured by test camera,the sensor size is 19.19 mm by 13.07 mm,(c) gray distribution of the A-Aposition.The horizontal axis is the pixel index,and the vertical axis is the grayscale value.The horizontal axis of 4424 pixels corresponds to the sensor’s 19.19 mm length,and the area with a magenta corresponds to a length of 13.68 mm.Within the magenta area,it is the area that the EAST camera can capture.

Figure 9.Images captured at 3.0 s of shot #105240.(a) Image captured by upper optical system,(b) image captured by lower optical system
The image from the lower optical system shows some tilt,which is caused by unexpected rotation of the camera during installation.This tilt changes the FOV,but the lower half of the plasma can still be fully observed in the figure.Therefore,as long as the system calibration and coordinate transformation consider the tilt of the image,the lower optical system can still accurately reconstruct the plasma boundary.
4.Reconstruction result
4.1.Camera
The image acquisition hardware adopts Mikrotron 3085 highspeed monochrome camera,equipped with a global shutter CMOS sensor.The sensor size measures 13.57 mm × 13.68 mm,and a pixel size is 8 μ m × 8 μm.The high-speed camera model can capture 1696×1710 pixels of 8-bit grayscale real-time images at the acquisition frame rate of 566 FPS,and can reach the acquisition frame rate of 4620 FPS at the acquisition resolution of 640×480 pixels.At full resolution,the size of the captured single frame is 2369 kB,resulting in an effective data transmission rate of about 1.31 GB per second to the image acquisition server.The performance of the camera makes it very suitable for fast and low delay acquisition of high-quality discharge images for plasma boundary reconstruction and analysis purposes.
4.2.Calibration
The purpose of camera calibration is to map images acquired by the optical system to real world objects,in order to achieve accurate recognition,measurement,and tracking of plasma boundary.It is a very important step in plasma boundary reconstruction,which refers to the process of determining the internal and external parameters of the camera.Internal parameters include focal length,pixel size,distortion,etc,while external parameters include camera position and orientation.The accuracy of camera calibration results will directly affect the accuracy of image-based plasma shape reconstruction.
Pinhole imaging model with second-order radial distortion was used to model the imaging system.Upon completing the installation of the system,the camera intrinsics can be calibrated using Zhang’s method [18].The calibration procedure is as follows:
(i) Make a calibration target plane.
(ii) Take a few images of the target plane under different orientations by moving the plane.
(iii) Detect the feature points in the images.
(iv) Estimate camera parameters other than distortion.
(v) Refine all parameters,including distortion parameters,by minimizing the sum of re-projection error (function (2)).
Where assuming there arenimages of a target plane and there arempoints on the target plane.mijis a feature point on the image coordinate in imagei,Mjis the corresponding points ofmijin tokamak coordinate system.Arepresenting the camera internal parameter matrix,Ri,tiare representing rotation matrix and translation matrix of imagei,respectively.is the coordinate of pointMjreprojected onto the image plane of imageiusing camera parameters.
During the calibration process,a 19×11 checkerboard target plane,each square measuring 30 mm per side,served as the calibration target.The overall mean reprojection error across the 20 calibration images is only 0.22 pixels,indicative of high calibration accuracy (figure 10).The distortion of the optics derived from calibration is shown in the figure 10(c).This optical system exhibits negative distortion,with a maximum distortion value less than 10%,consistent with the simulation results.
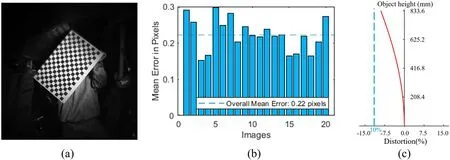
Figure 10.Camera calibration process.(a) A representative sample from the 20 calibration images,(b) mean reprojection error per image,(c) distortion versus FOV derived from calibration
The Coordinate Measuring Machine was used to measure the three-dimensional spatial position of the feature points(corner points of vacuum chamber wall tiles) in the vacuum vessel.The camera parameters were refined through minimizing the sum of re-projection error,derived from the relationship between image points and spatial points.When temperature and vibration cause slight changes in camera position,etc.,this method can be used to update parameters and reduce errors,thereby achieving high reconstruction accuracy.
4.3.Coordinate transformation
After system calibration,the boundary curve in the image can be projected onto the poloidal cross-section plane.In the camera-captured image,each pixel represents a line integral measurement of the light emitted by the plasma along the sight line.Therefore,the brightest boundary position in the image is the position where the line of sight is tangent to the plasma boundary interface,rather than the intersection line between the plasma boundary and the tokamak poloidal cross-section plane [16].This leads to a discrepancy between the plasma boundary coordinates obtained from the image and the actual position coordinates of the plasma boundary in the tokamak coordinate system.To address the above discrepancy,a method called OFIT was proposed based on the assumption of plasma toroidal symmetric emission profile to achieve mapping from the poloidal cross-section curve to the plasma boundary [11].Equation (3) lists the conversion relationship from boundary curve on poloidal cross-section plane to plasma boundary position in OFIT method.
In the equation,(xc,yc,zc) is the position of the camera in the Cartesian coordinate system,(ye,ze) is the position coordinates of the boundary on the poloidal cross-section plane,(Re,φe,Ze)is the position coordinate of the boundary in the tokamak cylindrical coordinate system.
4.4.Reconstruction result analysis
In order to test the feasibility of the optical system in this paper for visible light boundary reconstruction,some features were manually selected for reconstruction verification.The brightest position of the boundary curve in the image is selected as the plasma boundary for both high field side and low field side,and the line with the greatest gray gradient from bright to dark is selected as the position of the high field side inner wall of the vacuum vessel (figures 11(a)and (b)).By applying the camera calibration results detailed in section 4.2 and the coordinate transformation method outlined in section 4.3,the positions of the plasma boundary and the high field side’s inner wall were successfully reconstructed,as depicted in figure 11(c).Notably,slight displacements caused by vibration during the discharge process were corrected by aligning the reconstructed position of the vacuum vessel wall with its actual position.
The figure 11(c) reveals that the boundary curves of the high field side plasma reconstructed by the upper and lower optical systems are essentially overlapped,and the reconstruction results near the midplane are highly consistent.This outcome suggests that both the upper and lower independent optical systems offer good reconstruction accuracy,and tilt in the lower image does not compromise this precision.As a result,the reconstruction results from the upper and lower systems can serve as mutual validations.The boundary curves reconstructed by the optical system at the low field side were shorter,attributed to the wider distribution of the light-emitting band compared to the high field side,making manual marking of the longer boundary harder.Comparing with the EFIT code results,the optical boundary at the high field side aligns closely,with a deviation of about 9 mm at the high field side midplane.The most significant discrepancy between the two reconstruction results is in the lower half of the low field side,at about 17 mm.These results reveal the high consistency in shape and position between the two reconstruction methods.Due to the fact that these two are different boundaries with a certain correlation,the differences between the two may vary with factors such as temperature and density.Therefore,we believe that their differences in the range of a few millimeters to several tens of millimeters are consistent with the facts.
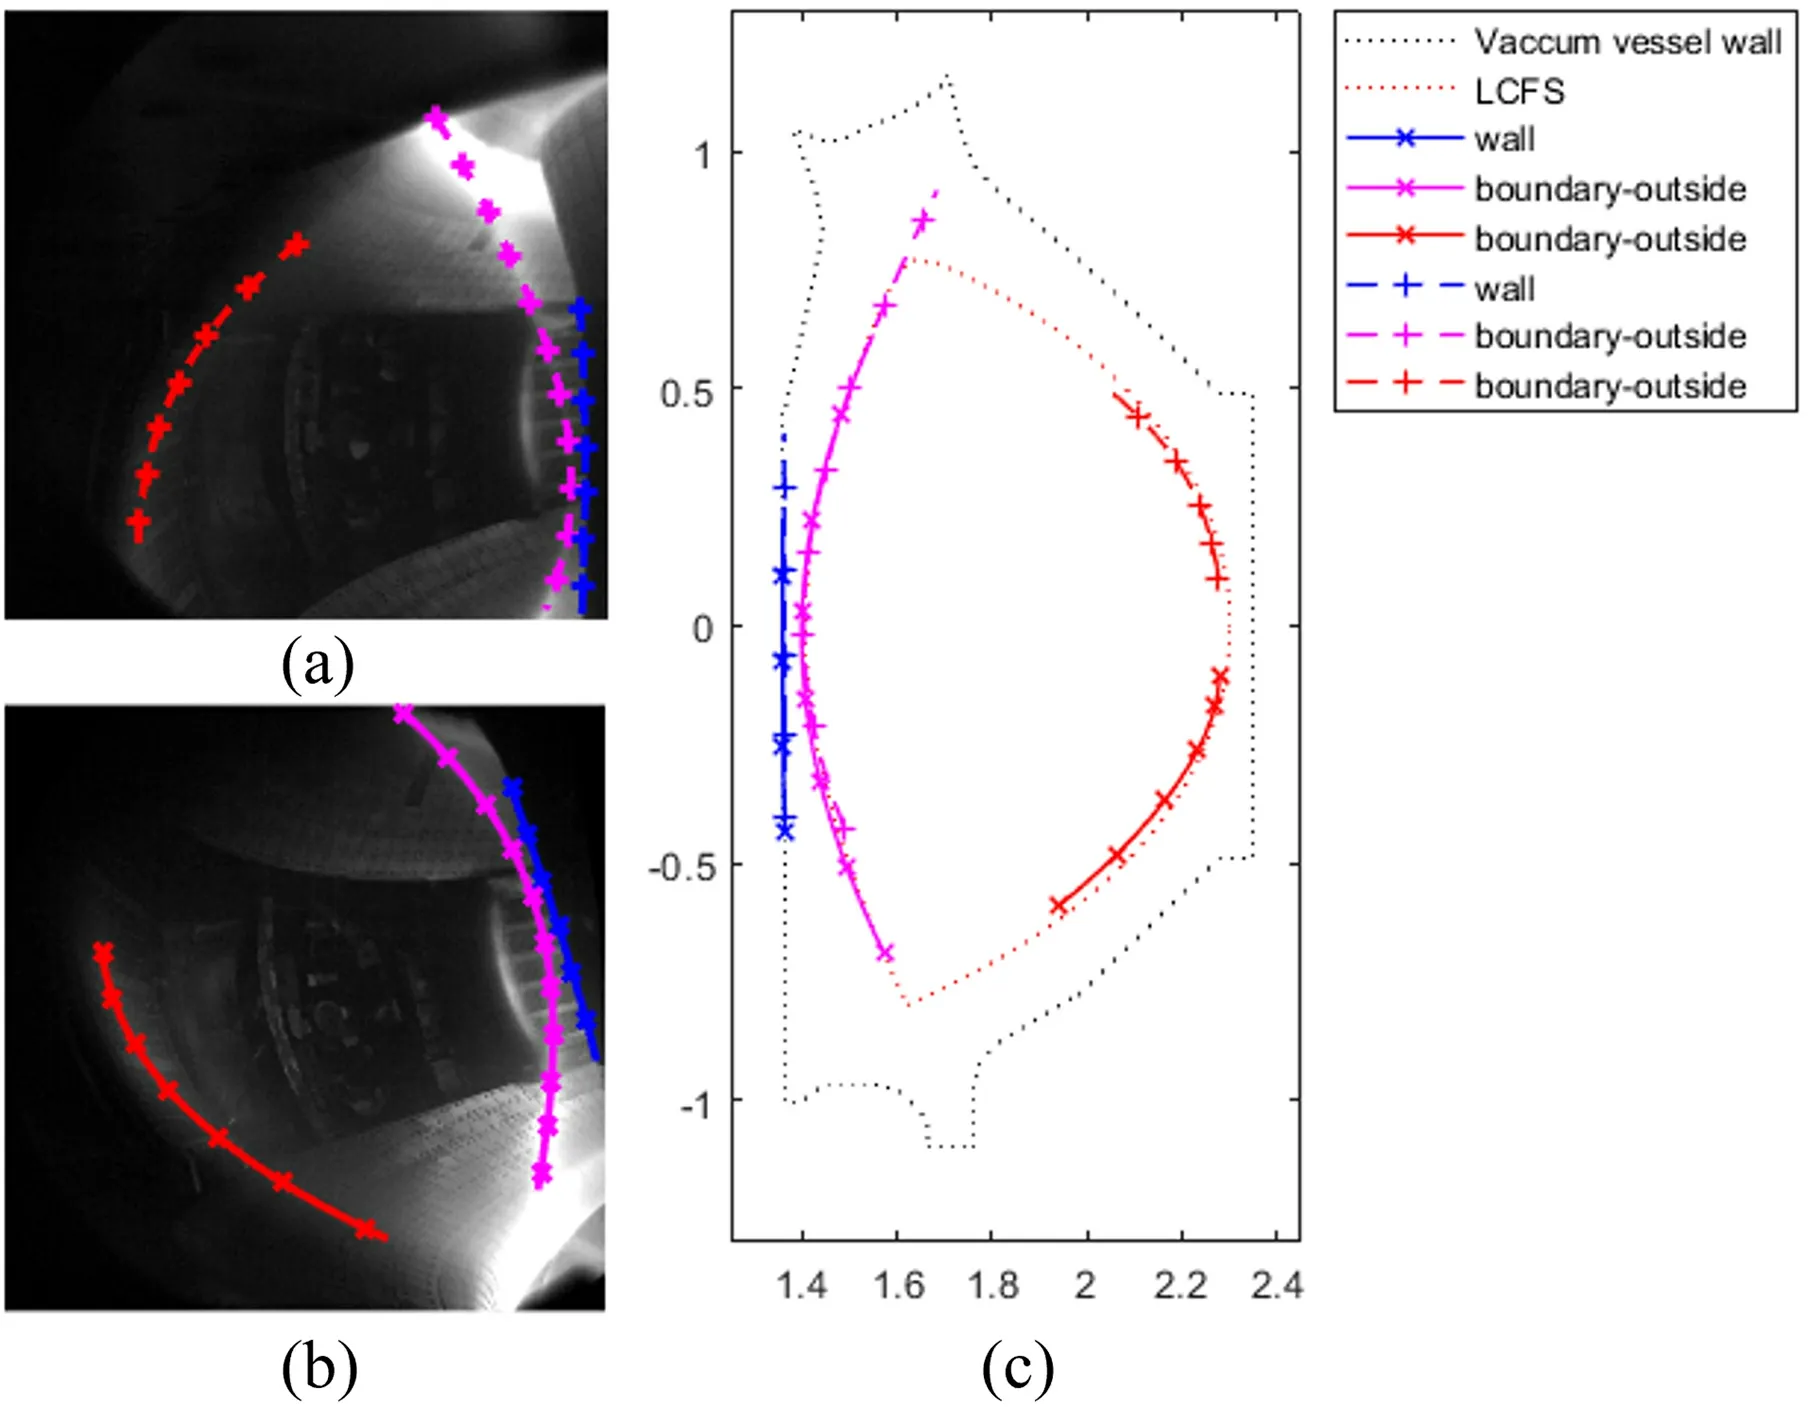
Figure 11.Reconstruction result after calibration and coordinate transformation.(a) Upper optical system images of plasma boundary and vacuum vessel wall position marked with dashed lines.The red line with marker ‘+’ is the low field side plasma boundary location,the magenta line marker ‘+’ is the high field side plasma boundary location,and the blue marker ‘+’ line is the high field side vacuum vessel inner wall location.(b) Lower optical system images of plasma boundary and vacuum vessel wall position marked with solid lines.The color correspondence is the same as in subfigure (a),and the mark changes to ‘x’.(c) Reconstruction result compared with LCFS calculated from EFIT code.The correspondence of colors and markers is the same as in subfigures (a) and (b).
5.Conclusion
As tokamak devices evolve,with increasing discharge time and parameters,traditional boundary reconstruction methods based on magnetic diagnostics face significant challenges.Therefore,novel methods must be cultivated to reconstruct plasma boundaries in future tokamak.Boundary reconstruction based on optical systems emerges as a promising alternative.A novel set of visible optical diagnostic systems for boundary reconstruction has been developed and experimentally verified,employing two symmetric optical systems for joint plasma imaging.Based on the luminescent characteristics of the working gas deuterium in the EAST device’s plasma and the plasma shape control requirements,the wavelength of the optical system has been set at 656.1 nm,the optical FOV is required to cover the entire poloidal cross-section,and the optical spatial resolution should be maintained at less than 5 mm.Simulations and tests focused on imaging quality were conducted to assess the capacity of the designed optical system in fulfilling plasma boundary reconstruction requirements.The results demonstrated that the optical system’s FOV effectively covers the entire plasma boundary area throughout discharge.Optical distortion was maintained under 10%within the FOV,and a spatial resolution of less than 2 mm was achieved on the tokamak poloidal cross-section.Both the plasma boundary and vacuum vessel features were clearly discernible,validating the quality and effectiveness of the optical system.Following the calibration of the optical system,selected boundary features were used to reconstruct the plasma boundary through coordinate transformation.The shape of the reconstructed boundary shows high consistency with EFIT code results,suggesting the potential applicability of this optical system for plasma boundary reconstruction research in tokamak devices and for experimental studies of plasma shape control based on optical diagnostics.The upcoming work will focus on improving boundary recognition algorithms to accurately identify more boundary features,enhancing the capability to reconstruct more plasma boundary.Future studies will involve the implementation of real-time boundary detection and reconstruction algorithm,alongside utilizing the ability derived from visible imaging reconstruction for plasma position and shape control experiments,which will provide an alternative position and shape control scheme for future fusion reactor devices such as ITER and DEMO.Furthermore,we will explore the properties of the plasma’s optical boundary through simulations and conduct a comparative analysis with the magnetic boundary.
Acknowledgments
This work is supported by the National MCF Energy R&D Program of China (Nos.2018YFE0302103 and 2018YFE 0302100) and National Natural Science Foundation of China(Nos.12205195 and 11975277).
猜你喜歡
故事會(2022年2期)2022-01-19
華人時刊(2020年17期)2020-12-14
——記山東省特級教師陳明
小學時代(2020年20期)2020-08-04
大眾文藝(2018年19期)2018-07-13
創新作文(5-6年級)(2017年10期)2018-07-06
創新作文(小學版)(2017年30期)2017-02-25
前衛文學(2016年3期)2016-07-01
民間故事選刊·上(2015年9期)2015-09-10
小小說月刊(2015年7期)2015-05-14
新高考·高一物理(2014年1期)2014-09-18
 Plasma Science and Technology2024年2期
- Plasma Science and Technology的其它文章
- Phase field model for electric-thermal coupled discharge breakdown of polyimide nanocomposites under high frequency electrical stress
- Characteristics of laser-induced breakdown spectroscopy of liquid slag
- Airfoil friction drag reduction based on grid-type and super-dense array plasma actuators
- Non-thermal atmospheric-pressure positive pulsating corona discharge in degradation of textile dye Reactive Blue 19 enhanced by Bi2O3 catalyst
- The characteristics of negative corona discharge and radio interference at different altitudes based on coaxial wire-cylinder gap
- Experimental study on the effect of H2O and O2 on the degradation of SF6 by pulsed dielectric barrier discharge