
Genome-wide association of 10 horticultural traits with expressed sequence tag-derived SNP markers in a collection of lettuce lines
2013-03-13 09:01SoonjeKwonIvnSimkoBrrHellierBeiqunMouJinguoHu
The Crop Journal 2013年1期
Soonje Kwon,Ivn Simko,Brr Hellier,Beiqun Mou,Jinguo Hu,*
aUS Department of Agriculture–Agricultural Research Service,Western Regional Plant Introduction Station,59 Johnson Hall,Washington State University,Pullman,WA 99164,USA
bUS Department of Agriculture–Agricultural Research Service,Crop Improvement Protection Research Unit,1636 East Alisal Street,Salinas,CA 93905,USA
1.Introduction
Marker-assisted selection (MAS) has proven to be an effective tool in crop improvement.A prerequisite for successful MAS is to identify markers in close proximity to the genetic factors or genes controlling simple qualitative and complex quantitative traits of interest.Two approaches have been developed and applied to mapping genes in numerous plant species[1]:linkage mapping approach,which uses segregating populations derived from two parental lines,and association mapping that exploits biodiversity observed in germplasm collections of landraces,cultivars,and breeding lines[2].The linkage mapping approach is limited to the variation between the two parents.Also,development of segregating populations may take several years if recombined inbred line populations are used for mapping[3,4].The association mapping approach,which is based on linkage disequilibrium(LD),uses a collection of germplasm with a wide range of phenotypic and genetic variation [1].Association mapping was initially developed to identify genes associated with human diseases,but was later applied to mapping genes in animal and plant populations [5–10].In plants,LD-based association mapping started with the model plant Arabidopsis and was later extended to various crops such as rice(Oryza sativa L.) [11],grapevine (Vitis vinifera L.) [12],wheat(Triticum aestivum L.)[13],soybean(Glycine max(L.)Merr.)[14]and maize (Zea mays L.) [9,15].In cultivated lettuce,association mapping has been used for mapping disease resistance genes[16,17].
Single nucleotide polymorphisms (SNPs) are the most abundant type of genetic variation.Theoretically,SNPs can have four alleles,but in practice,they have been used as bi-allelic markers since in over 99% of cases only two alleles have been observed at a given locus[18].SNPs were estimated to occur once every 500 bp to 1 kb in the human genome and once every 1 kb in the rice genome when indica-japonica types were compared [19,20].Besides being abundant in genomes,additional advantages of SNP markers are their co-dominant nature and amenability to high-throughput automation that allows rapid and efficient genotyping of large numbers of samples[21].Therefore,SNP markers are frequently used in genetic analyses,such as phylogenetic analysis,detection of population structure,construction of genetic linkage maps,and genome-wide association studies[22–24].
Lettuce,Lactuca sativa L.,2n = 2x = 18,is an important vegetable crop in the Asteraceae (Compositae) family.It is almost exclusively used as a fresh vegetable in salads and as an ingredient of various foods in the western marketplace [25,26].However,in the eastern world lettuce is grown for its delicious stem[27].Lettuce is one of the most valuable vegetable crops in the U.S.with an annual farm gate value of over $2.1 billion in recent years[28].Different systems have been used in classifying lettuce cultivars into horticultural types based on morphological characteristics and/or end-user properties.We adopted the five-type system,i.e.,crisphead (iceberg),butterhead,romaine(cos),leaf,and stem [29] because most of the accessions are documented under these types in the National Plant Germplasm System's Genetic Resource Information Network (GRIN) database.For high-throughput genotyping of lettuce germplasm,we recently developed the LSGermOPA,a custom Oligo Pool Assay targeting 384 expressed sequence tag-derived SNP loci(255 with known mapped positions) using the Illumina's GoldenGate assay platform [30].High quality genotypic data were obtained from 354 of the 384 SNPs (success rate = 92.2%) for 148 lettuce accessions.The phylogenetic relationships and population structure based upon the LSGermOPA-generated SNP data were consistent with previous results using other marker systems[27,31–33].
Assessing genetic diversity and population structure within germplasm collections provides an important resource to end users and a management tool for curators.In addition,germplasm collections that possess a full range of genetic diversity and phenotypic expressions have the potential to serve as platforms for association studies to identify statistically significant relationships between polymorphic markers and genes of economic and biological merit[34].In the current study,we focused on distilling the molecular diversity and genetic structure of 298 homozygous lettuce lines and using this information to assess genome-wide marker-trait associations between SNP markers and 10 horticultural traits.
2.Materials and methods
2.1.Plant materials,genomic DNA extraction and SNP genotyping assay
Three hundred and eighty-four individual plants sampled from 356 accessions were used in this study.For some accessions,more than one plant per accession was sampled based on observed differences in morphology.These accessions were collected worldwide during 1930s–2010s and are maintained at the USDA-ARS Western Regional Plant Introduction Station(WRPIS)in Pullman,Washington.Genomic DNA was extracted from single plants using the DNeasy 96 Plant Kit (Qiagen,Valencia,CA,USA).Quality and quantity of extracted DNA samples were evaluated with Fluoroskan Ascent FL (Thermo Scientific,Hudson,NH,USA).The SNP genotyping assay was carried out at the UC Davis Genome Center using 250 ng of genomic DNA per sample and the LSGermOPA panel targeting 384 EST-derived SNP loci.A more detailed description of the genotyping procedure can be found in our previous study [30].Seeds of the genotyped plants were harvested and planted in 2011 and 2012 at the WRPIS Central Ferry Research Farm,Central Ferry,WA,for confirming homozygosity within accessions and for phenotypic evaluation.
2.2.Phenotypic evaluation
The phenotypic traits surveyed in the field from June to November,2011 and 2012,included horticultural type,leaf color,bolting date,flowering date,leaf anthocyanin,stem anthocyanin,stem fasciation,leaf margin undulation,leaf blistering,and seed coat color.Bolting and flowering dates were recorded when the plant rachis was 10 cm and the terminal flower of the main axis was fully open,respectively.Leaf color,anthocyanin,margin undulation and blistering and horticultural type were recorded before the bolting stage;stem anthocyanin,and fasciation were recorded after bolting.Seed coat color was observed after harvest.
2.3.Data analysis
A cluster analysis was conducted using the UPGMA(unweighted pair group method with arithmetic mean) based on the allele-sharing distance by PowerMarker version 3.25 [35] and the resulting tree was displayed using the software Mega4[36].
Population structure was assessed using the software package STRUCTURE 2.3.3[37]that utilizes a Bayesian algorithm to assign accessions to putative populations (K).Inferred information about population structure and the degree of admixture can subsequently be used as a co-factor in association mapping.The average estimated log probability of the data Pr(x|k),ideally should plateau at the most appropriate level of K.Values of K = 2 to 10 are reported here and represent the average probability of 20 runs.The appropriate lengths of the program's burn-in (initiation) period and run time (actual number of simulations) were 20,000 and 100,000,respectively.The default model of the program that uses admixture and correlated allele frequencies was applied to SNP data.In addition to the estimated log probability calculated by STRUCTURE,the ad hoc statistics of Evanno et al.[38] were used to determine the most likely population structure.
The hypothesis of association of molecular markers with phenotypic data was tested using the software program TASSEL 3.0.1[39,40].First,a single factor analysis(SFA)of variance that does not consider population structure was performed using each marker as the independent variable.The mean performance of each allelic class was compared using the general linear model(GLM)function in TASSEL.Next,a Q GLM analysis was carried out using the same software.This analysis applies population structure detected by STRUCTURE (Q matrix) as co-factors.To obtain an empirical threshold for marker significance and an experiment-wise P-value,10,000 permutations of data were performed.The final analysis was performed using the Q + K MLM method.This approach considers both the kinship matrix and the population structure Q matrix in the marker-trait association test.The K matrix of pairwise kinship coefficients for all pairs of lines was calculated from SNP data by the SPAGeDi software[41].
3.Results
3.1.Polymorphism of SNP markers
Genotyping with the LSGermOPA panel provided high-quality SNP markers for the tested lettuce accessions.For the 384 tested SNPs,363(94.5%)had a GenCall score(a designability rank score,which theoretically ranges from 0 to 1.0 as determined by GenomeStudio ver 1.0) greater than 0.6,and 41 SNPs were discarded because they were monomorphic,had more than 1%missing data points,or had more than 1% heterozygous genotype calls.For the remaining 322 SNPs,189 distributed across all nine linkage groups each with 9(on LG9)to 32(on LG2)markers.The remaining 133 SNPs have not yet been placed on any molecular linkage map.A detailed description of the marker distribution is shown in Kwon et al.[30].Of the 384 plants,82 had more than 1%missing data points or were heterozygous at more than 1% of the 322 targeted loci; four plants were control duplicates used for checking reproducibility.To avoid potential negative effects of the missing data points and heterozygous genotypes on genetic differentiation and marker-trait association,we analyzed only the plants with more than 99%homozygosity using the SNPs with more than 99% of the data points.As a result,the final data set contained 298 homozygous plants,including 122 butterhead,53 romaine,63 crisphead,53 leaf and 7 stem-type lines,genotyped with 322 SNPs.
3.2.Genetic diversity
Pairwise genetic similarity coefficients (GS) were calculated to assess the genetic diversity among the 298 homozygous lettuce plants using the 322 informative SNP markers.The average GS of 44,253 pairwise comparisons was 63.9%with a range of 40.6%to 99.8%.There were 43,273 pairs (97.8%) of accessions with GS greater than 50%,whereas 980 pairs (2.2%) showed GS lower than 50%,indicating that a large amount of variation exists in this set of lines.However,71 pairs had GS of 100%,suggesting germplasm redundancy in the genotyped set.These pairs include 66 plants in 26 groups or pairs (Fig.1).The largest redundant group contains nine plants sampled from seven butterhead type accessions collected from four different countries.Five accessions in this group had similar cultivar names(May Queen),albeit in four different languages.The second largest redundant group consists of six plants from six crisphead type accessions from the U.S.The next group has four plants sampled from two crisphead accessions acquired from the Netherlands.There are three redundant triplets: one contains three crisphead plants from three accessions from the U.S.and for the other two,each has a pair of plants sampled from the same accession plus another plant from a different accession.Among the remaining 20 pairs,10 have plants from different accessions and 10 with plants from the same accession.
The numbers in the horizontal bar at the bottom represent the genetic similarity at the corresponding nodes.Asterisk indicates the 26 genotypes shared by more than one line.
There were 258 unique genotypes in the 298 genotyped plants including 101 butterhead,50 romaine,53 crisphead,48 leaf,and 6 stem-type lines.A phylogenetic tree based on 322 SNP markers grouped the 258 homozygous plants into six major clades at 0.171 genetic distance(Fig.1).This analysis revealed a substantial association between SNP markers and horticultural types in cultivated lettuce because each clade contained accessions from one predominant horticultural type.All 53 crisphead lines were grouped into two clusters,Clade I(24)and Clade II(29),49 of the 50 romaine type lines in Clade III,22 leaf type lines in Clade V,and 98 of the 101 butterhead lines were in Clade VI.Leaf type lines were scattered in Clades II,III,VI,V,and IV.The stem types were clustered together in Clade III.
Genetic differentiation between horticultural types was tested using the Fst statistics estimated from pairwise comparisons.The lowest genetic differentiation was found between butterhead and romaine types(Fst = 0.078)(Table 1),whereas the highest genetic differentiation was between crisphead and butterhead types(Fst = 0.318).
3.3.Population structure
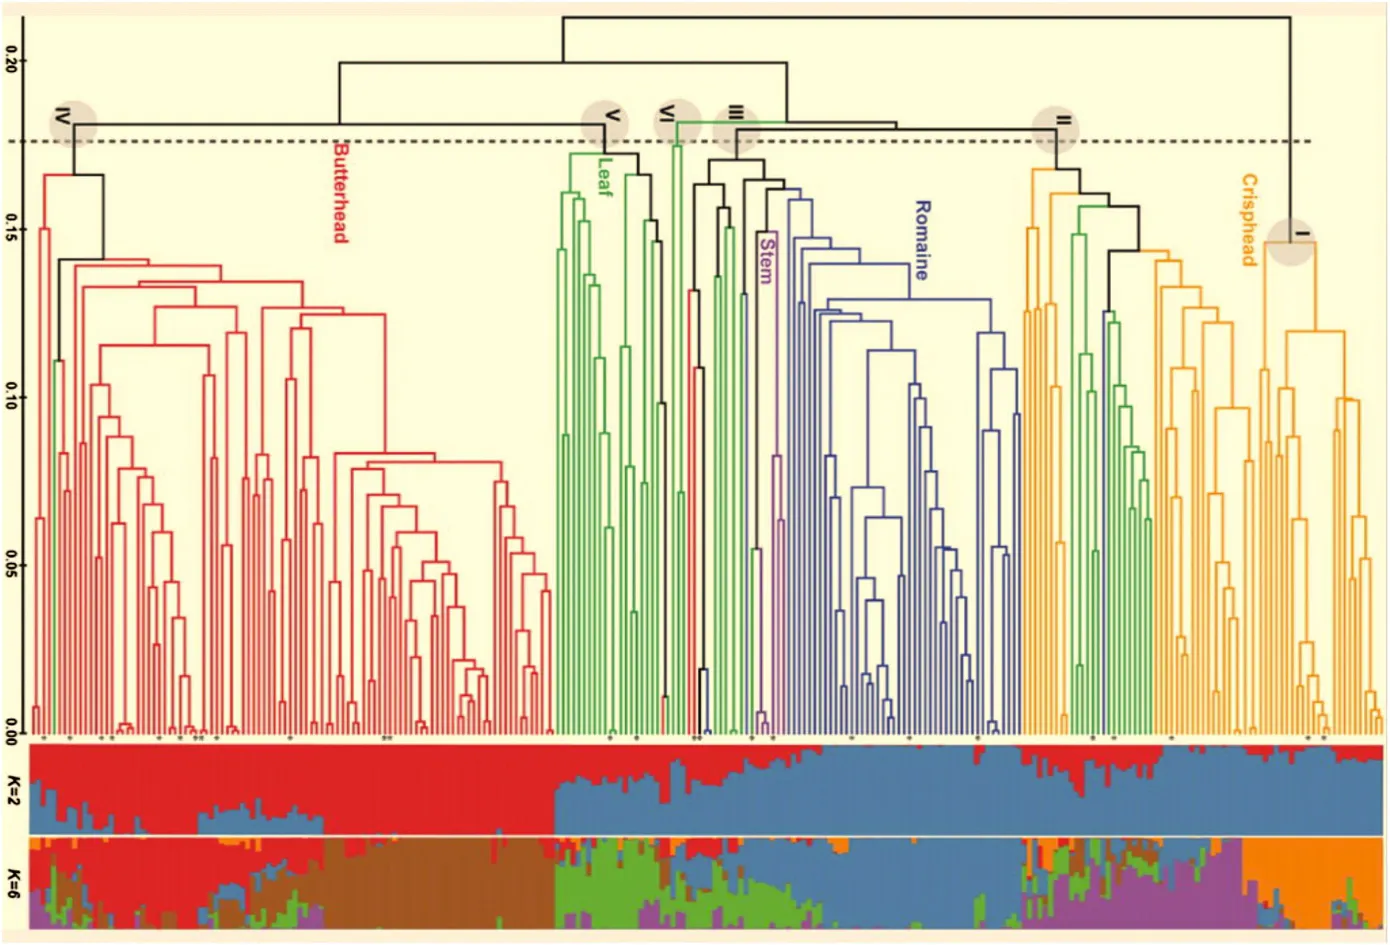
Fig.1-A phylogenetic tree and population structure of 258 homozygous lettuce lines based on 322 LSGermOPA SNPs.
Association analysis requires population structure to be taken into account in order to avoid false-positive associations [40].An analysis of population structure identified significant population structure within the 258 genotypes (Fig.1).Bayesian clustering analysis was conducted using populations from K = 2 to 10.The highest ΔK values that indicate the most likely number of populations[38]were observed for K = 2(739.6)and K = 6 (9.7).This analysis was consistent with the calculated phylogenetic tree.When the number of populations was set to K = 2,114 (44.2%) of the 258 plants showed the estimates of ancestry (q) over 0.95 for one of the putative populations,while 66 plants (25.6%) had q values below 0.75.With respect to horticultural types,a majority of plants in various clades had q values greater than 0.80 at K = 2 (blue or red bars in Fig.1).These include all crisphead type lines in Clade I,and all stem type lines; 22 (75.9%) of the 29 crisphead type lines in Clade II; 45 (91.8%) of the 49 romaine type lines in Clade III;and 74 (73.3%) of the 101 butterhead type lines in Clade VI.However,40 (83.3%) of the 48 leaf type lines had q values smaller than 0.75.Based on the ΔK and ln P(X|K),K = 6 also shows a high probability of estimating the number of populations (Fig.1).Crisphead type lines possessed two different major memberships as indicated by orange and purple bars; whereas butterhead type lines belonged to the groups as indicated by brown and red colors.It seems that the crisphead type lines can be separated by their differences inorigin and head morphology.However,the phenotypic difference between the two groups of the butterhead type lines remains to be determined.
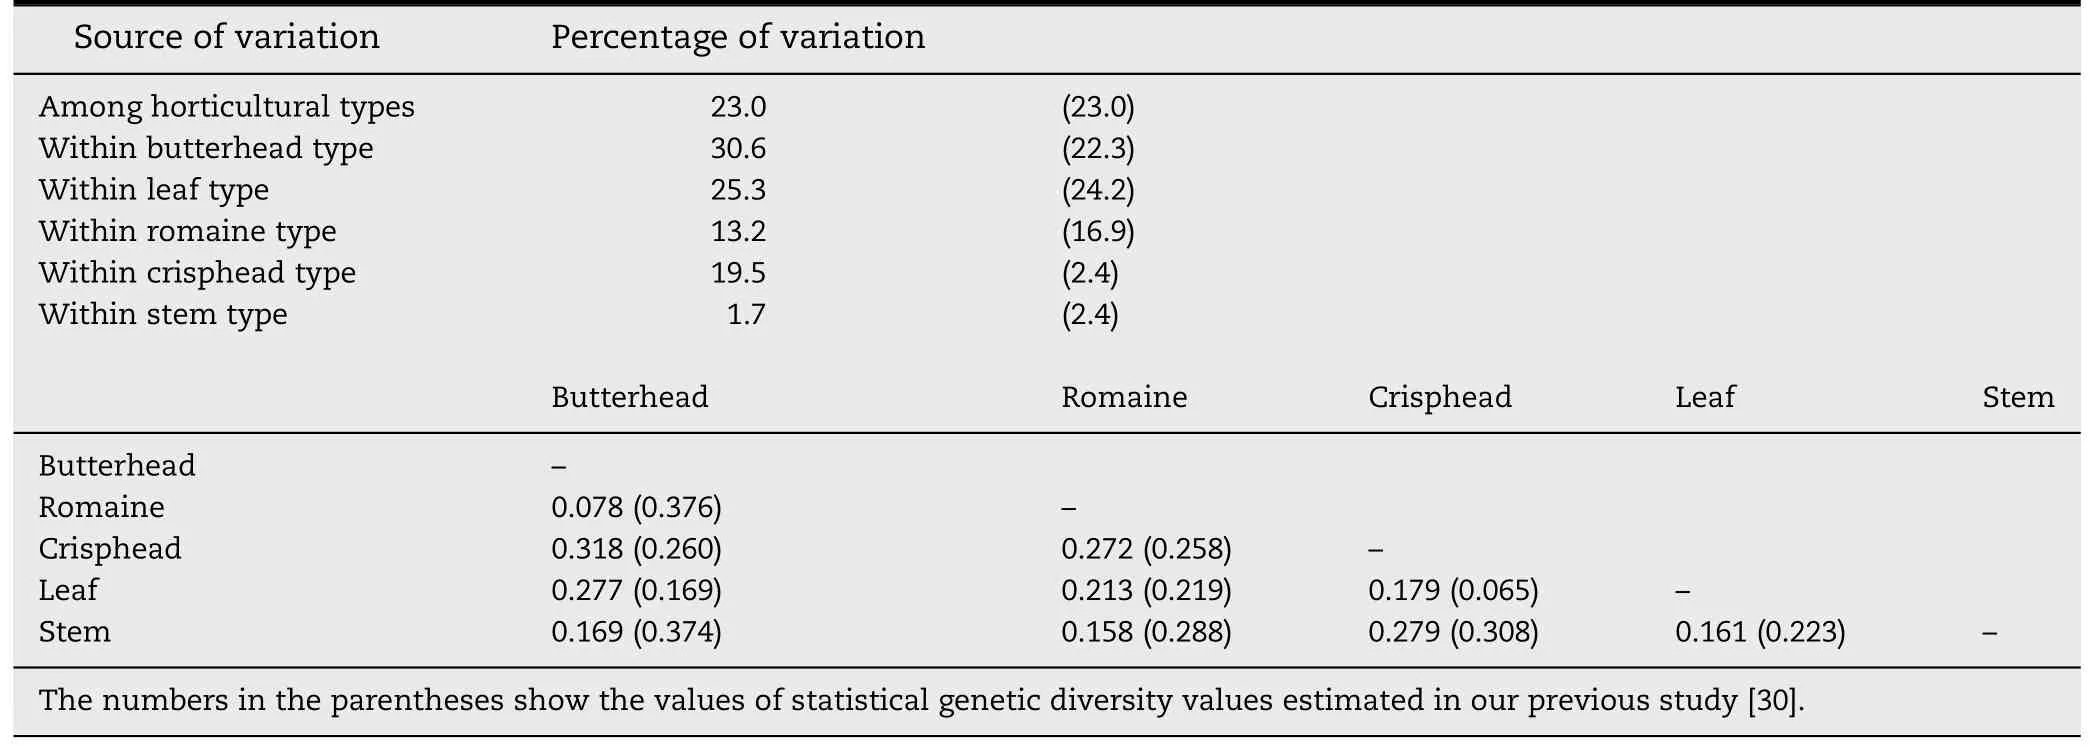
Table 1-Analysis of molecular variance (AMOVA) and pairwise Fst values estimated from 322 LSGermOPA SNPs on 298 homozygous lettuce lines.
3.4.SNP markers associated with quality traits
The main objective of this study was to detect associations between 10 phenotypic traits and 322 SNP markers analyzed with 258 lettuce lines.Marker-trait association was determined by single factor analysis (SFA),structured association analysis using a general linear model where population membership served as covariates(Q GLM),and a composite approach where the average relationship was estimated by kinship and implemented in a mixed linear model (Q + K MLM).Table 2 presents the significance levels forfor all markers for each analysis.Using SFA 296 SNPs were significantly associated with all phenotypic traits.A total of 1141 significant markertrait associations (SMTAs) (P <0.01) were detected using SFA.CLS_S3_Contig2508-1-OP4 was associated with eight phenotypic traits (leaf anthocyanin,stem anthocyanin,leaf blistering,leaf undulation,leaf color,bolting date,flowering date,and horticultural type),whereas 25 SNPs were associated with one trait each.The lowest P-value (P = 1.31E-60,R2= 0.60) using SFA was detected for association of Contig15192-1-OP1 with horticultural type.In the Q GLM analysis,286 SNP markers were involved in 890 SMTAs from all of the phenotypic traits.RHQGE13G04.yg_3-OP3 was associated with nine traits(all except fasciation),and 63 SNPs were associated with one trait each.The lowest P-value of SMTAs occurred in CLS_S3_Contig8254-1-OP4 (P = 8.22E-38,R2= 0.43) associated with seed coat color.According to the Q + K MLM method,54 SNP markers were involved in 63 SMTAs across all phenotypic traits.Nine SNP markers were each involved in two SMTAs,whereas 45 SNP markers were each involved in one SMTA.The lowest P-value of SMTAs was observed for Contig10156-1-OP1(P = 1.47E-10,R2= 0.15) associated with seed coat color(Table 2).The three analytical approaches (SFA,Q GLM,and Q + K MLM)were compared for numbers of SMTAs.The highest number of SMTAs (1141) was detected for the SFA approach,followed by the Q GLM approach (890).The lowest number of SMTAs (63) was detected by the Q + K MLM approach,which only detected 5.5%and 7.1%of the SMTAs detected by SFA and Q GLM,respectively.These results confirm previous observation that the number of SMTAs estimated with GLM is higher than with MLM [40].Forty-four common SMTAs involving 38 SNPs were detected by all three methods(Table 2).Six of the 38 SNPs each had two SMTAs;and the remaining 32 SNPs had one SMTA.The lowest P-value was observed for the association of Contig10156-1-OP1 with the seed coat color trait((P = 4.91E-11,Table 2).Most interestingly,nine SMTAs were revealed at P <0.0001 with all three approaches,considering kinship and/or population structure for this collection.These nine SMTAs include five for seed coat color,one for leaf undulation,two for leaf anthocyanin,and one for stem anthocyanin.Four SNPs involved in the five SMTAs for seed coat color were previously mapped on Linkage Group 7.Two SNPs mapped on Linkage Group 9 were associated with leaf and stem anthocyanin.
4.Discussion
4.1.Genetic variability within horticultural types and population structure revealed by the current and previous studies
Results from the current study were consistent with our previous study using the same Oligo Pool Assay (OPA),LSGermOPA[30].In that report,leaf type accessions contained high within-horticultural type genetic variability (24.2%,P >0.01),which was almost identical to the current analysis(25.3%,P >0.01) (Table 1).The high level of genetic diversity revealed by SNPs was consistent with the high morphological variability observed within this horticultural type.Accessions of this type have leaves that widely differ in shape (entire to highly lobed),margins (straight to highly undulating),size(small to large),or color (various shades of green and various distribution and intensities of anthocyanin) [42].The high genetic variability within this type is evident from Fig.1 in which the leaf type accessions distributed across five of the six clades.The butterhead type also possesses high genetic variability within horticultural type.The accessions of this type were clustered in three clades(Fig.1).
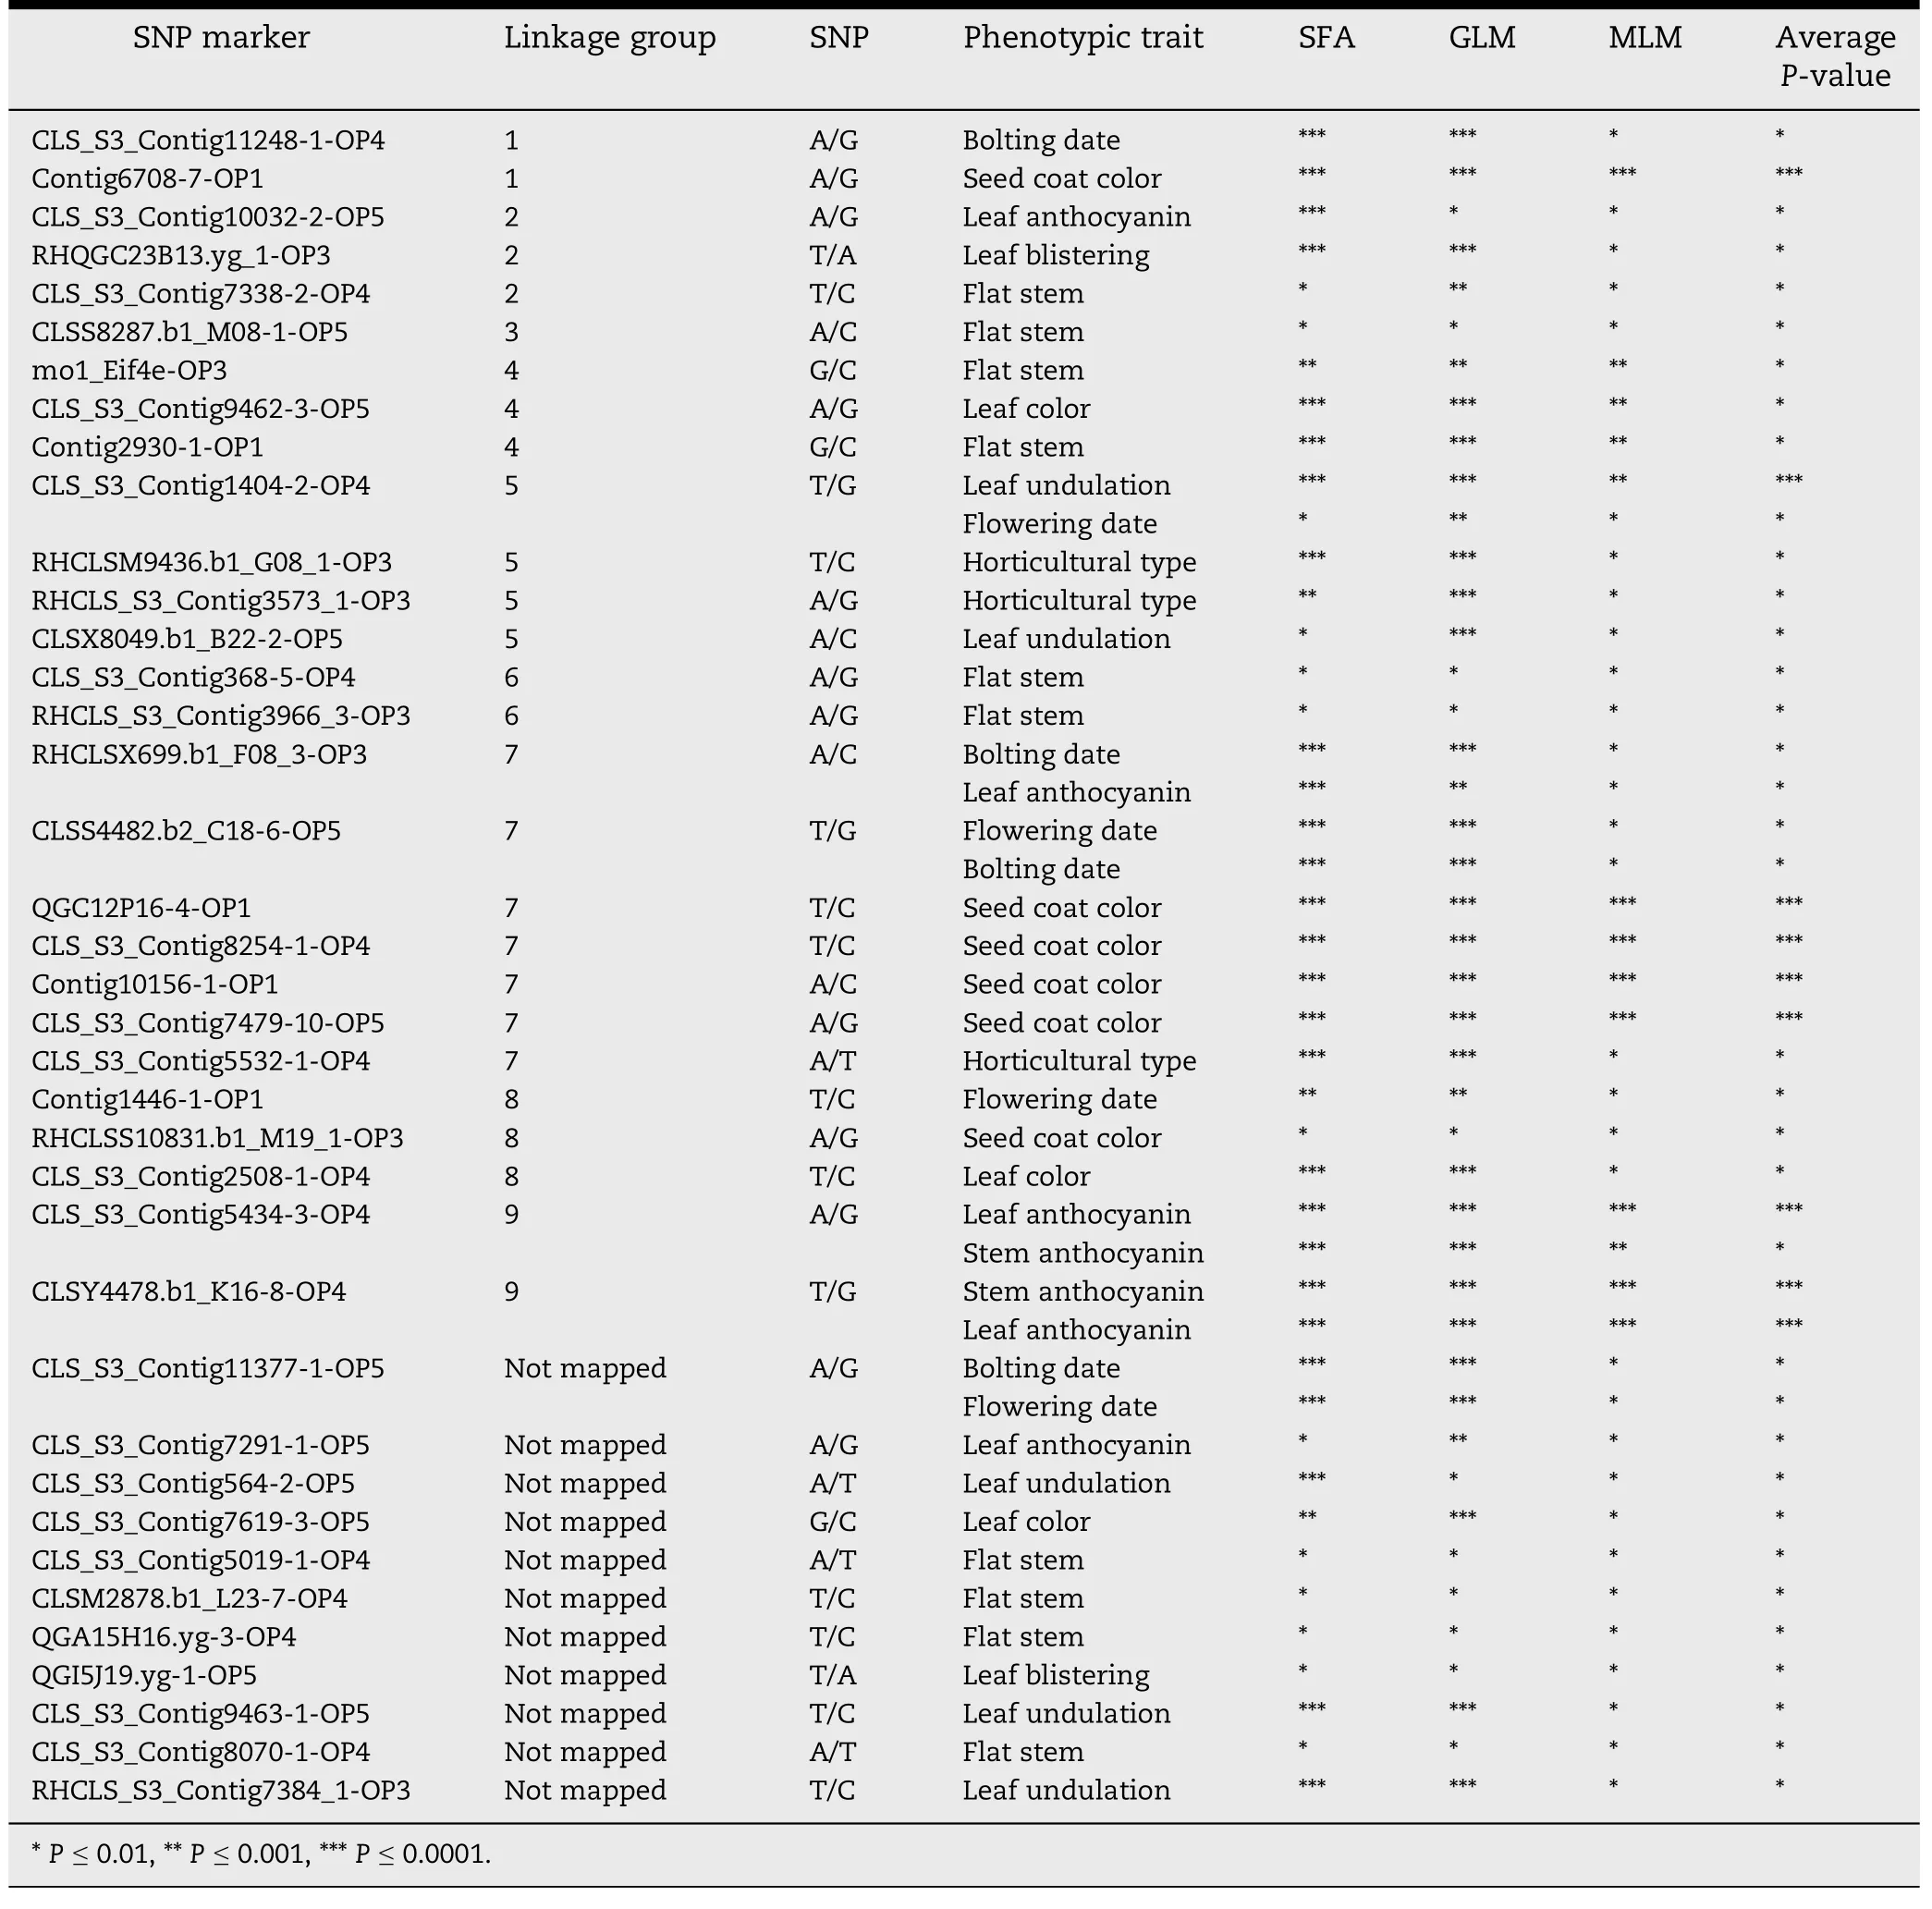
Table 2-Information on overlapping SMTA markers.
In contrast,a relatively lower level of genetic variability was observed within crisphead horticultural types.However,our current estimation of genetic diversity for this group(19.5%)was higher than previously reported (2.4%) (Table 1).Also,in the current study crisphead type lines were divided into two Clades,I and II.This increased diversity is probably related to a more than 10-fold increase in the number of accessions analyzed(from 5 to 53 accessions).All of the crisphead types in Clade I originate from the U.S.and Australia.This group of typical U.S.or real crisphead lettuces[43]is also called iceberg type.Iceberg type cultivars form round,dense,and firm heads with crunchy leaves.Genetic and phenotypic variability within the iceberg types is very limited and could serve as an example of a strong selection process [17,44].The remaining 29 crisphead types in Clade II consisted of 14 from Europe,Australia and Asia and 15 from the U.S.These lines,called Batavia,form round,but somewhat smaller and less dense heads.Batavia and iceberg are similar,but phenotypically different sub-types of crisphead lettuce.The romaine type accessions showed a similar level of within horticultural type genetic variability(13.3%vs.16.9%)and the stem type accessions had the lowest within-horticultural type genetic variability(1.7%and 2.4%)in both studies.Almost all accessions of romaine and stem types were clustered in Clade III(Fig.1).
Although plants putatively share the same genotype within each group,they exhibit slight differences in phenotype.This is similar to a previous report [45] where considerable differences in QTL patterns were observed within lettuce inbred lines derived from a cross between cultivated lettuce and its wild relative L.serriola.It is possible that plants assigned to the same genotype on the basis of SNP markers in the current study nonetheless differ genetically,phenotypically or behaviorally because the low marker density did not allow separation of some of the closely related,but different genotypes.Aimed at mitigating the possible effect of limited number of markers,we used only pure lines derived from individual plants that were confirmed as homozygotes by genotyping in the current experiment.
Previous studies estimated that the most likely number of subpopulations in cultivated lettuce was three,using 54 cultivars genotyped by TRAP (target region amplification polymorphism) markers [32] and 148 cultivated accessions genotyped by SNP markers[30].The current study differs from previous studies in using DNA from only a single plant per accession and excluding heterozygous accessions and markers from the analyses.The use of single plants and homozygous genotypes increased the statistical power in our data analysis because haplo-insufficiency and haplo-sufficiency are not distinguishable at gene expression levels.Some phenotypes can show a haplo-sufficiency(+/-or-/+) genotype [46,47].Our current study revealed the existence of six subpopulations in this special “pure-line” lettuce collection.Although each genotyped plant was homozygous at more than 99% of the 322 assayed loci,a majority of the plants possessed mixed genetic components of different subpopulations.This observation could reflect the reality in lettuce breeding.Although there are distinct phenotypic differences among horticultural types,there is no genetic barrier when crossing accessions of any cultivated lettuce.Therefore,hybridization among different horticultural types has been used to develop new cultivars and breeding lines.Lindqvist pointed out that most lettuce breeding occurred between butterhead and leaf types,since they have very similar leaf texture and midrib appearance [48].Genealogy of contemporary North American lettuce shows that 52% of lettuce cultivars were bred using two parents,31%from selection within a cultivar,7%from three parents,7%from backcrossing,2%from four or more parents,and 1%from inter-specific crosses[49,50].Recognizing the population structure in our collection will enable us to apply the linkage disequilibrium (LD)-based association mapping to accurately identify DNA markers closely linked to genes and genomic regions associated with desirable traits.
4.2.Physical positions of the SNP markers associated with phenotypic traits
Our results for population structure and cluster analysis agree with previous studies involving cultivated lettuce germplasm [30].Genotyping of 258 homozygous lettuce genotypes with 322 SNP markers allowed a preliminary genome-wide analysis of marker-trait association.We found that seed coat color was significantly associated with four markers on linkage group 7; CLS_S3_Contig8254-1-OP4(88.3%),CLS_S3_Contig7479-10-OP5 (80.0%),QGC12P16-4-OP1(77.3%) and Contig10156-1-OP1 (76.0%).Two SNP markers from linkage group 9,CLS_S3_Contig5434-3-OP4 (69.3%) and CLSY4478.b1_K16-8-OP4 (67.0%),were significantly associated with anthocyanin on stems or leaves.These markers are potentially useful in MAS in lettuce improvement when they are validated with segregating populations,and they also can be used as the starting point to identify candidate genes underlying the respective phenotypic traits.
With the recent release of the draft lettuce genome sequence from the Compositae Genome Project website(http://compgenomics.ucdavis.edu/) that was supported by the USDA IFAFS program and NSF Plant Genome Program,we could locate most of the SNP sites in the genome.For example,lettuce seed coat color is a simply inherited trait[51] and a seed coat color locus(br)was mapped onto a linkage group with four AFLP markers using a recombinant inbred line population[52].However,the br locus has not been assigned to a lettuce chromosome.The current study found that four SNPs associated with seed coat color are on chromosome 7.The lettuce genomeViewer website (http://gviewer.gc.ucdavis.edu/cgi-bin/gbrowse/lechuga_version_1_2/) indicates that the assembled lettuce chromosome 7 is approximately 240 Mb in length.Three of the four SNPs associated with seed coat color,QGC12P16-4-OP1,CLS_S3_Contig8254-1-OP4 and CLS_S3_Contig7479-10-OP5 are located at positions 69,873,871,80,636,383 and 81,871,389,respectively.In other words,these three SNP sites are physically resided within a segment of 12 Mb,which most likely harbors the br locus conditioning the seed coat color.In addition,the two SNP markers on chromosome 9,which were significantly associated with anthocyanin on the stem or leaf,are just 415,391 bp apart.The continued effort in annotating the genes in these chromosomal regions will reveal the genetic basis of these phenotypic traits in lettuce.
4.3.Availability of seed samples
Seeds of the 258 homozygous-lines,each derived from a single,genotyped plant,together with the SNP genotype and reported phenotype data,will be maintained in the USDA-ARS WRPIS in Pullman,WA,as a special collection.Interested researchers can contact BH or JH,or directly go to the GRIN web site (http://www.ars-grin.gov/npgs/ orders.html) to request seed samples and associated information for collaborative or independent research.
This work was funded by USDA-ARS CRIS Project 5438-21000-026-00D and NIFA multistate research project W006.The authors express sincere appreciation for the skillful editing and constructive suggestions from the two anonymous reviewers of the manuscript and for the technical assistance from Alex Cornwell,Maria Pavelka,Saber Jewell and Jacqueline Cruver.
[1] J.Ross-Ibarra,P.L.Morrell,B.S.Gaut,Plant domestication,a unique opportunity to identify the genetic basis of adaptation,Proc.Natl.Acad.Sci.U.S.A.104(2007)8641–8648.
[2] I.Simko,One potato,two potato: haplotype association mapping in autotetraploids,Trends Plant Sci.9(2004)441–448.
[3] S.A.Flint-Garcia,J.M.Thornsberry,E.Buckler,Structure of linkage disequilibrium in plants,Annu.Rev.Plant Biol.54(2003) 357–374.
[4] B.Stich,H.P.Maurer,A.E.Melchinger,M.Frisch,M.Heckenberger,J.R.van der Voort,J.Peleman,A.P.S?rensen,J.C.Reif,Comparison of linkage disequilibrium in elite European maize inbred lines using AFLP and SSR markers,Mol.Breed.17(2006) 217–226.
[5] E.Buckler,M.Gore,An Arabidopsis haplotype map takes root,Nat.Genet.39(2007) 1056–1057.
[6] J.K.Pritchard,M.Przeworski,Linkage disequilibrium in humans:models and data,Am.J.Hum.Genet.69(2001)1–14.
[7] D.E.Reich,M.Cargill,S.Bolk,J.Ireland,P.C.Sabeti,D.J.Richter,T.Lavery,R.Kouyoumjian,S.F.Farhadian,R.Ward,Linkage disequilibrium in the human genome,Nature 411(2001) 199–204.
[8] K.M.Weiss,A.G.Clark,Linkage disequilibrium and the mapping of complex human traits,Trends Genet.18(2002)19–24.
[9] J.Yu,E.S.Buckler,Genetic association mapping and genome organization of maize,Curr.Opin.Biotechnol.17(2006)155–160.
[10] C.G.Zhu,M.Buckler,E.S.Yu,Status and prospects of association mapping in plants,Plant Genome 1 (2008) 5–20.
[11] H.A.Agrama,G.C.Eizenga,W.Yan,Association mapping of yield and its components in rice cultivars,Mol.Breed.19(2007) 341–356.
[12] A.Barnaud,T.Lacombe,A.Doligez,Linkage disequilibrium in cultivated grapevine,Vitis vinifera L,Theor.Appl.Genet.112(2006) 708–716.
[13] F.Breseghello,M.E.Sorrells,Association mapping of kernel size and milling quality in wheat (Triticum aestivum L.)cultivars,Genetics 172 (2006) 1165–1177.
[14] T.-H.Jun,K.Van,M.Y.Kim,H.S.Lee,D.R.Walker,Association analysis using SSR markers to find QTL for seed protein content in soybean,Euphytica 162 (2008) 179–191.
[15] J.M.Thornsberry,M.M.Goodman,J.Doebley,S.Kresovich,D.Nielsen,E.S.Buckler,Dwarf8 polymorphisms associate with variation in flowering time,Nat.Genet.28(2001) 286–289.
[16] I.Simko,D.A.Pechenick,L.K.Mchale,M.J.Truco,O.E.Ochoa,R.W.Michelmore,B.E.Scheffler,Development of molecular markers for marker-assisted selection of dieback disease resistance in lettuce (Lactuca sativa),Acta Hort.859 (2010)401–408.
[17] I.Simko,D.Pechenick,L.McHale,M.Truco,O.Ochoa,R.Michelmore,B.Scheffler,Association mapping and marker-assisted selection of the lettuce dieback resistance gene Tvr1,BMC Plant Biol.9(2009) 135.
[18] M.Krawczak,Informativity assessment for biallelic single nucleotide polymorphisms,Electrophoresis 20(1999)1676–1681.
[19] D.N.Cooper,B.A.Smith,H.J.Cooke,S.Niemann,J.Schmidtke,An estimate of unique DNA sequence heterozygosity in the human genome,Hum.Genet.69(1985) 201–205.
[20] F.A.Feltus,J.Wan,S.R.Schulze,J.C.Estill,N.Jiang,A.H.Paterson,An SNP resource for rice genetics and breeding based on subspecies indica and japonica genome alignments,Genome Res.14(2004) 1812–1819.
[21] Z.Tsuchihashi,N.C.Dracopoli,Progress in high throughput SNP genotyping methods,Pharmacogenomics J.2(2002)103–110.
[22] M.J.Aranzana,S.Kim,K.Zhao,E.Bakker,M.Horton,K.Jakob,C.Lister,J.Molitor,C.Shindo,C.Tang,Genome-wide association mapping in Arabidopsis identifies previously known flowering time and pathogen resistance genes,PLoS Genet.1(2005) e60.
[23] International HapMap C,A second generation human haplotype map of over 3.1 million SNPs,Nature 449(2007)851–861.
[24] K.Zhao,M.J.Aranzana,S.Kim,C.Lister,C.Shindo,C.Tang,C.Toomajian,H.Zheng,C.Dean,P.Marjoram,An Arabidopsis example of association mapping in structured samples,PLoS Genet.3(2007) e4.
[25] A.Lebeda,I.Dolealova,E.Kistkova,K.J.Dehmer,D.Astley,C.C.M.van de Wiel,R.van Treuren,Acquisition and ecological characterization of Lactuca serriola L.germplasm collected in the Czech Republic,Germany,the Netherlands and United Kingdom,Genet.Resour.Crop.Evol.54(2007)555–562.
[26] B.Mou,Lettuce,in:J.Prohens,F.Nuez (Eds.),Handbook of Plant Breeding,Vegetables I:Asteraceae,Brassicaceae,Chenopodiaceae,and Cucurbitaceae,vol.I,Springer,New York,2008,pp.75–116.
[27] J.Hu,O.E.Ochoa,M.J.Truco,B.A.Vick,Application of the TRAP technique to lettuce (Lactuca sativa L.) genotyping,Euphytica 144 (2005) 225–235.
[28] USDA,Crop Values 2009 Summary,2010.13,(Available at http://usda01.library.cornell.edu/usda/nass/CropValuSu//2010s/2010/CropValuSu-02-19-2010_new_format.pdf,accessed on July 8,2013).
[29] C.M.Rodenburg,H.Basse,Varieties of lettuce:an international monograph,in:C.M.Rodenburg(Ed.),The Netherlands,Instituut voor de Veredeling van Tuinbouwgewassen,Wageningen,1960.
[30] S.J.Kwon,M.J.Truco,J.Hu,LSGermOPA,a custom OPA of 384 EST-derived SNPs for high-throughput lettuce(Lactuca sativa L.) germplasm fingerprinting,Mol.Breed.29(2012) 887–901.
[31] I.Simko,Development of EST-SSR markers for the study of population structure in lettuce(Lactuca sativa L.),J.Hered.100(2009) 256–262.
[32] I.Simko,J.Hu,Populations structure in cultivated lettuce(Lactuca sativa L.)and its impact on association mapping,J.Am.Soc.Hortic.Sci.133(2008)61–68.
[33] R.van Treuren,T.J.L.van Hintum,Comparison of anonymous and targeted molecular markers for the estimation of genetic diversity in ex situ conserved Lactuca,Theor.Appl.Genet.119(2009) 1265–1279.
[34] M.Morgante,F.Salamini,From plant genomics to breeding practice,Curr.Opin.Biotechnol.14 (2003) 214–219.
[35] K.Liu,S.V.Muse,PowerMarker: an integrated analysis environment for genetic marker analysis,Bioinformatics 21(2005) 2128–2129.
[36] K.Tamura,J.Dudley,M.Nei,S.Kumar,MEGA4: molecular evolutionary genetics analysis (MEGA) software version 4.0,Mol.Biol.Evol.24 (2007) 1596.
[37] J.K.Pritchard,M.Stephens,P.Donnelly,Inference of population structure using multilocus genotype data,Genetics 155(2000)945.
[38] G.Evanno,S.Regnaut,J.Goudet,Detecting the number of clusters of individuals using the software STRUCTURE: a simulation study,Mol.Ecol.14(2005) 2611–2620.
[39] P.J.Bradbury,Z.Zhang,D.E.Kroon,T.M.Casstevens,Y.Ramdoss,E.S.Buckler,TASSEL: software for association mapping of complex traits in diverse samples,Bioinformatics 23(2007) 2633.
[40] J.Yu,G.Pressoir,W.H.Briggs,I.V.Bi,M.Yamasaki,J.F.Doebley,M.D.McMullen,B.S.Gaut,D.M.Nielsen,J.B.Holland,A unified mixed-model method for association mapping that accounts for multiple levels of relatedness,Nat.Genet.38(2005) 203–208.
[41] O.J.Hardy,X.Vekemans,SPAGeDi: a versatile computer program to analyse spatial genetic structure at the individual or population levels,Mol.Ecol.Notes 2 (2002) 618–620.
[42] R.J.Singh,Genetic Resources,Chromosome Engineering,and Crop Improvement,CRC Press,Boca Raton,FL,USA,2006.377–472.
[43] E.J.Ryder,The new salad crop revolution,in:J.Janick,A.Whipkey (Eds.),Trends in New Crops and New Uses,ASHS Press,Alexandria,VA,USA,2002,pp.408–412.
[44] I.Simko,R.J.Hayes,M.J.Truco,R.W.Michelmore,Mapping a dominant negative mutation for triforine sensitivity in lettuce and its use as a selectable marker for detecting hybrids,Euphytica 182 (2011) 157–166.
[45] Y.Hartman,D.A.P.Hooftman,B.Uwimana,C.van de Wiel,M.J.M.Smulders,R.G.F.Visser,P.H.van Tienderen,Genomic regions in crop-wild hybrids of lettuce are affected differently in different environments: implications for crop breeding,Evol.Appl.5(2012) 629–640.
[46] H.Kacser,J.A.Burns,The molecular basis of dominance,Genetics 97(1981) 639–666.
[47] W.B.Watt,Allozymes in evolutionary genetics: self-imposed burden or extraordinary tool? Genetics 136 (1994) 11–16.
[48] K.Lindqvist,On the origin of cultivated lettuce,Hereditas 46(1960) 319–350.
[49] M.A.Mikel,Genealogy of contemporary North American lettuce,Hortic.Sci.42(2007)489–493.
[50] R.C.Thompson,E.J.Ryder,Descriptions and pedigrees of nine varieties of lettuce,Technical Bulletin,No.1244,Agriculture Research Service,US Dept.of Agriculture,Washington DC,1961,p.19.
[51] C.E.Durst,Inheritance in lettuce III,Agric.Exp.Stn.Bull.356(1930) 237–341.
[52] E.Hayashi,N.Aoyama,D.W.Still,Quantitative trait loci associated with lettuce seed germination under temperature and light environments,Genome 51(2008) 928–947.

- The Crop Journal的其它文章
- Identification and fine mapping of two blast resistance genes in rice cultivar 93-11
- Zea mays(L.) P1 locus for cob glume color identified as a post-domestication selection target with an effect ontemperate maize genomes
- Identification of unconditional and conditional QTL for oil,protein and starch content in maize
- Effects of narrow plant spacing on root distribution and physiological nitrogen use efficiency in summer maize
- Variation of high-molecular-weight glutenin subunits and glutenin macropolymer particle distribution in wheat grains produced under different water regimes
- Dissection of two quantitative trait loci for grain weight linked in repulsion on the long arm of chromosome 1 of rice(Oryza sativa L.)