
Design and control of methyl acetate-methanol separation via heat-integrated pressure-swing distillation
2016-06-07 05:44ZhishanZhangQingjunZhangGuijieLiMeilingLiuJunGao
Zhishan Zhang *,Qingjun Zhang Guijie Li,Meiling Liu Jun Gao
1 College of Chemical and Environmental Engineering,Shandong University of Science and Technology,Qingdao 266590,China
2 School of Materials Science and Engineering,Shandong University of Science and Technology,Qingdao 266590,China
1.Introduction
Methyl acetate and methanol are both important raw materials and solvents widely used in the chemical industry.Its binary mixture is often generated in the production of polyvinyl alcohol,which needs to be separated for recycling or further processing[1].But it remains a great challenge to effectively separate them because of the presence of a minimum-boiling homogeneous azeotrope.Pressure-swing distillation(PSD)is one popular method of many strategies for separating azeotropes when changes in pressure significantly shift the composition of the azeotrope[2].Fortunately,strong effects of pressure on the azeotropic composition and temperature for the system of methyl acetate and methanol are shown(Fig.1)using Aspen Plus based on NRTL physical property model.For this reason,PSD can be applied to the separation of methyl acetate/methanol azeotrope.The basic idea is to operate one column at low pressure and a second column at high pressure to achieve the desired separation.The configuration does not involve the addition of a third component and has the economical potential of capital and energy by heat integration between the condenser in high pressure column(HPC)and the reboiler in low-pressure column(LPC).Of course,this may induce the problem of control flexibility because the integration reduces the degree of freedom.The operation of energy and mass integrated distillation columns has high demands on the process control concept as well as on the con troll erconceptit self.
Recently,there are many studies on the design,optimization and control of PSD for this type of azeotropic systems[3–14].The process of heat integrated PSD for the binary system has been studied by Jinbei Yang et al.[15].However,they did not consider the economic trade-off and dynamic control of this process.Except for that,no work has been found in the open literature on the design and control of methyl acetate/methanol separation using PSD process.In addition,more control concepts are involved in the paper compared to the literatures.
The two aims of this paper are to find the optimum separation configuration conditions for PSD with different heat integration modes based on the minimization of TAC or total reboiler heat duty and to compare the controllability of them with various control structures.
2.Steady State Design
In the paper,the separation process is simulated with the following data:the feed with the flowrate of100 kmol·h?1at the bubble pointis a mixture made up of50 mol%methyl acetate and 50 mol%methanol,and the methanol purity at the bottom of LPC and the methyl acetate purity at the bottom of HPC are both specified as 99.5 mol%.
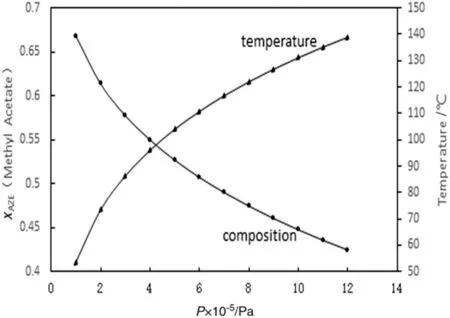
Fig.1.Effect of pressure on azeotropic composition and temperature.
The key point of PSD is to determine reasonable operating pressures in the two columns.The larger the pressure difference,the larger the shift in the azeotropic composition and the lower the recycle flowrates and resulting energy consumption.The pressure of LPC should be chosen such that the cooling water can be used in the condenser.The condenser temperature of LPC at atmospheric pressure is 326.8 K,which is enough reflux drum temperature to permit the use of cooling water.The pressure of HPC(1.1 MPa)should be chosen via taking the minimization of the TAC as an objective function in a moderate range of pressures,as described below.
Fig.2 shows y–x curves for the binary system of methyl acetate/methanol at 0.1 and 1.1 MPa.At 0.1 MPa the azeotropic composition is 66.82 mol%methyl acetate and the azeotropic temperature is 326.77 K.At 1.1 MPa the azeotropic composition is 43.57 mol%methyl acetate and the azeotropic temperature is 408.33 K.Feed stream(F)and saturated distillate stream from HPC(D2)are fed into LPC and separated into the bottom product(B1)of 99.5 mol%methanol and the saturated distillate stream(D1)close to the azeotrope at the low pressure.D1is fed into HPC and separated into the bottom product(B2)of 99.5 mol%methyl acetate and D2close to the azeotrope at the high pressure which is recycled back into LPC.Note that Fig.2 shows that the relative volatility at low pressure is larger than that at high pressure in the range of lower feed composition for this system,contrary to that in the range of higher feed composition.The steady state flowsheet of the PSD process without heat integration is given in Fig.3.
The product purity is obtained by using the Design Spec/Vary function of Aspen Plus and adjusting the corresponding operated variables.The bottom purities are achieved by varying the corresponding bottom flowrate.
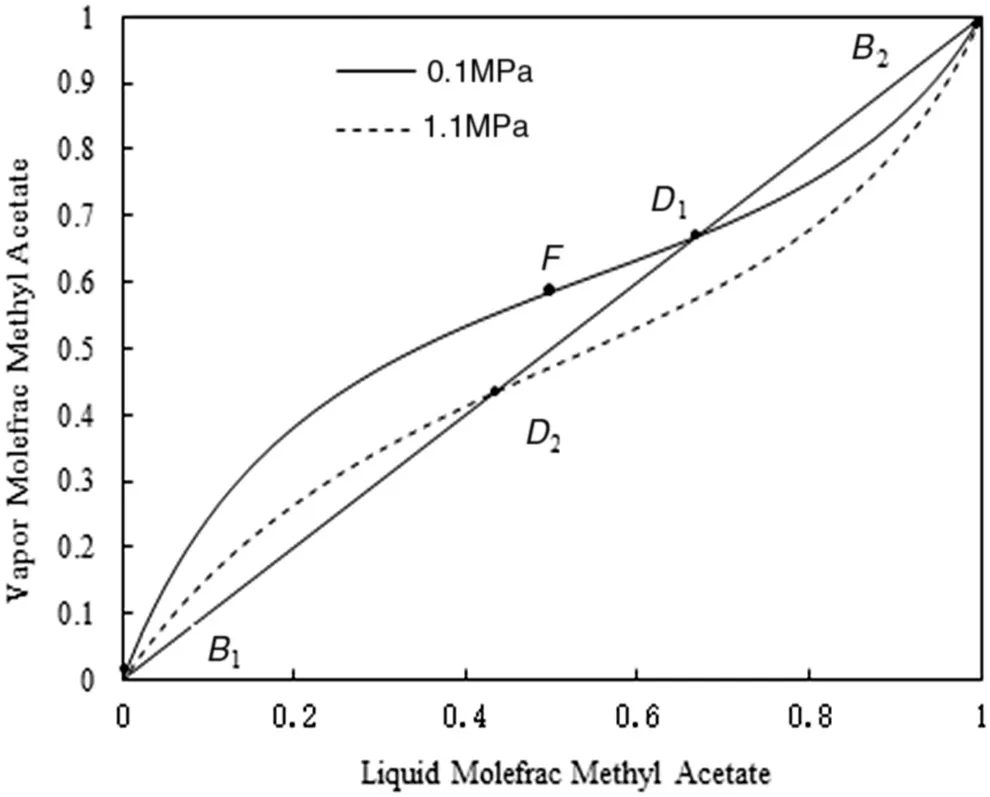
Fig.2.y–x diagram of methyl acetate/methanol at 0.1 and 1.1 MPa.
The PSD system still has several degrees of freedom when the feed conditions and column pressure of LPC have been fixed.The optimum tray numbers(NT1and NT2)and the operating pressure of HPC are determined by the minimization of TAC.The optimum feed stage locations(NF1and NF2)and the optimum reflux ratios(RR1and RR2)are obtained by the minimum total reboiler heat duty(the sum of QR1and QR2).But the feed stage location(NFE)of the recycle stream(D2)should be selected such that the liquid composition on the tray is equal to the feed composition[16].
The condenser of HPC and the reboiler of LPC have a large heat duty difference and enough temperature difference which is the opportunity for heatinteg ration.The heat integrated systemscan be designed partial and full heat integration.For partial heat integration,the condenser heat removal of HPC can't compensate the reboiler heat input of LPC and the remaining heat input of LPC needs an auxiliary reboiler which is heated by low-pressure steam.The reboiler of HPC is driven by high-pressure steam.As shown in Fig.3,a condenser/reboiler could transfer 1.543 MW energy into LPC,which is a portion(about 80%)of the heat input to the base of LPC.The temperature difference(67 K)between the top vapor of HPC and the bot tomboiling liquid ofLPC is adequate for heat integration with a reasonable heat transfer area(27.03 m2).The remaining energy requirement in LPC can be satisfied by a steam-heated auxiliary reboiler supplying 0.393 MW.
For full heat integration,the heat removalin the condenser of HPC is exactly equal to the heat input in the reboiler of LPC.It refers to using a single heat exchanger serving as the condenser of HPC and the reboiler of LPC.To achieve it,with the fixed RR1in LPC,there are three variables being used(B1,B2and RR2)to drive the two product compositions to their desired specifications and to be varied to make QR1=?QC2.The next step in the design is to vary RR1in LPC to find the value that minimizes the heat input to the reboiler of HPC(QR2).The optimum RR1is 0.6,the corresponding RR2is 1.44 and the minimum heat duty in the condenser/reboiler is 1.774 MW.Therefore,the heat transfer area of this exchanger(31.15 m2)can be determined by using the temperature difference(67 K)between the reflux drum of HPC and the base temperature of LPC with appropriate overall heat-transfer coefficient(0.85 kW·m?2·K?1).
The optimum design parameters and economic data for three alternatives are given in Table 1.The results show that about 27.68%saving in TAC,25.40%reduction in TAC can be achieved by the PSD with full and partial heat integration compared to the corresponding that without heat integration.So for this system,if the minimum economic as the objective function,the full heat integration program is superior to the partial heat integration.In addition,the full heat integration system is more economical from the standpoint of capital invest ment and energy cost.Thus,the PSD processes with partial and full heat integration will be considered in the rest of this study to compare their dynamic controllability.
3.Dynamic Control for PSD With Partial Heat Integration
The steady state simulation flow sheet is exported to Aspen Dynamics after all the parameters required for a dynamic simulation are specified and is pressure checked so that a realistic“pressure driven”dynamic simulation can be used.The reflux drum and column base are sized to provide 5 min holdup when half full.Pump heads and control valve pressure drops are specified to give reasonable plumbing.
Conventional PI controllers are used for all flows,pressures and temperatures and liquid-levels are controlled using P-only controllers with the controller gain of 2.Temperature controllers and composition controllers are tuned by running relay-feedback tests to determine ultimate gain and period and using Tyreus–Luyben settings.The control loop of each temperature and composition controller has a 1-min and 3-min dead time,respectively.
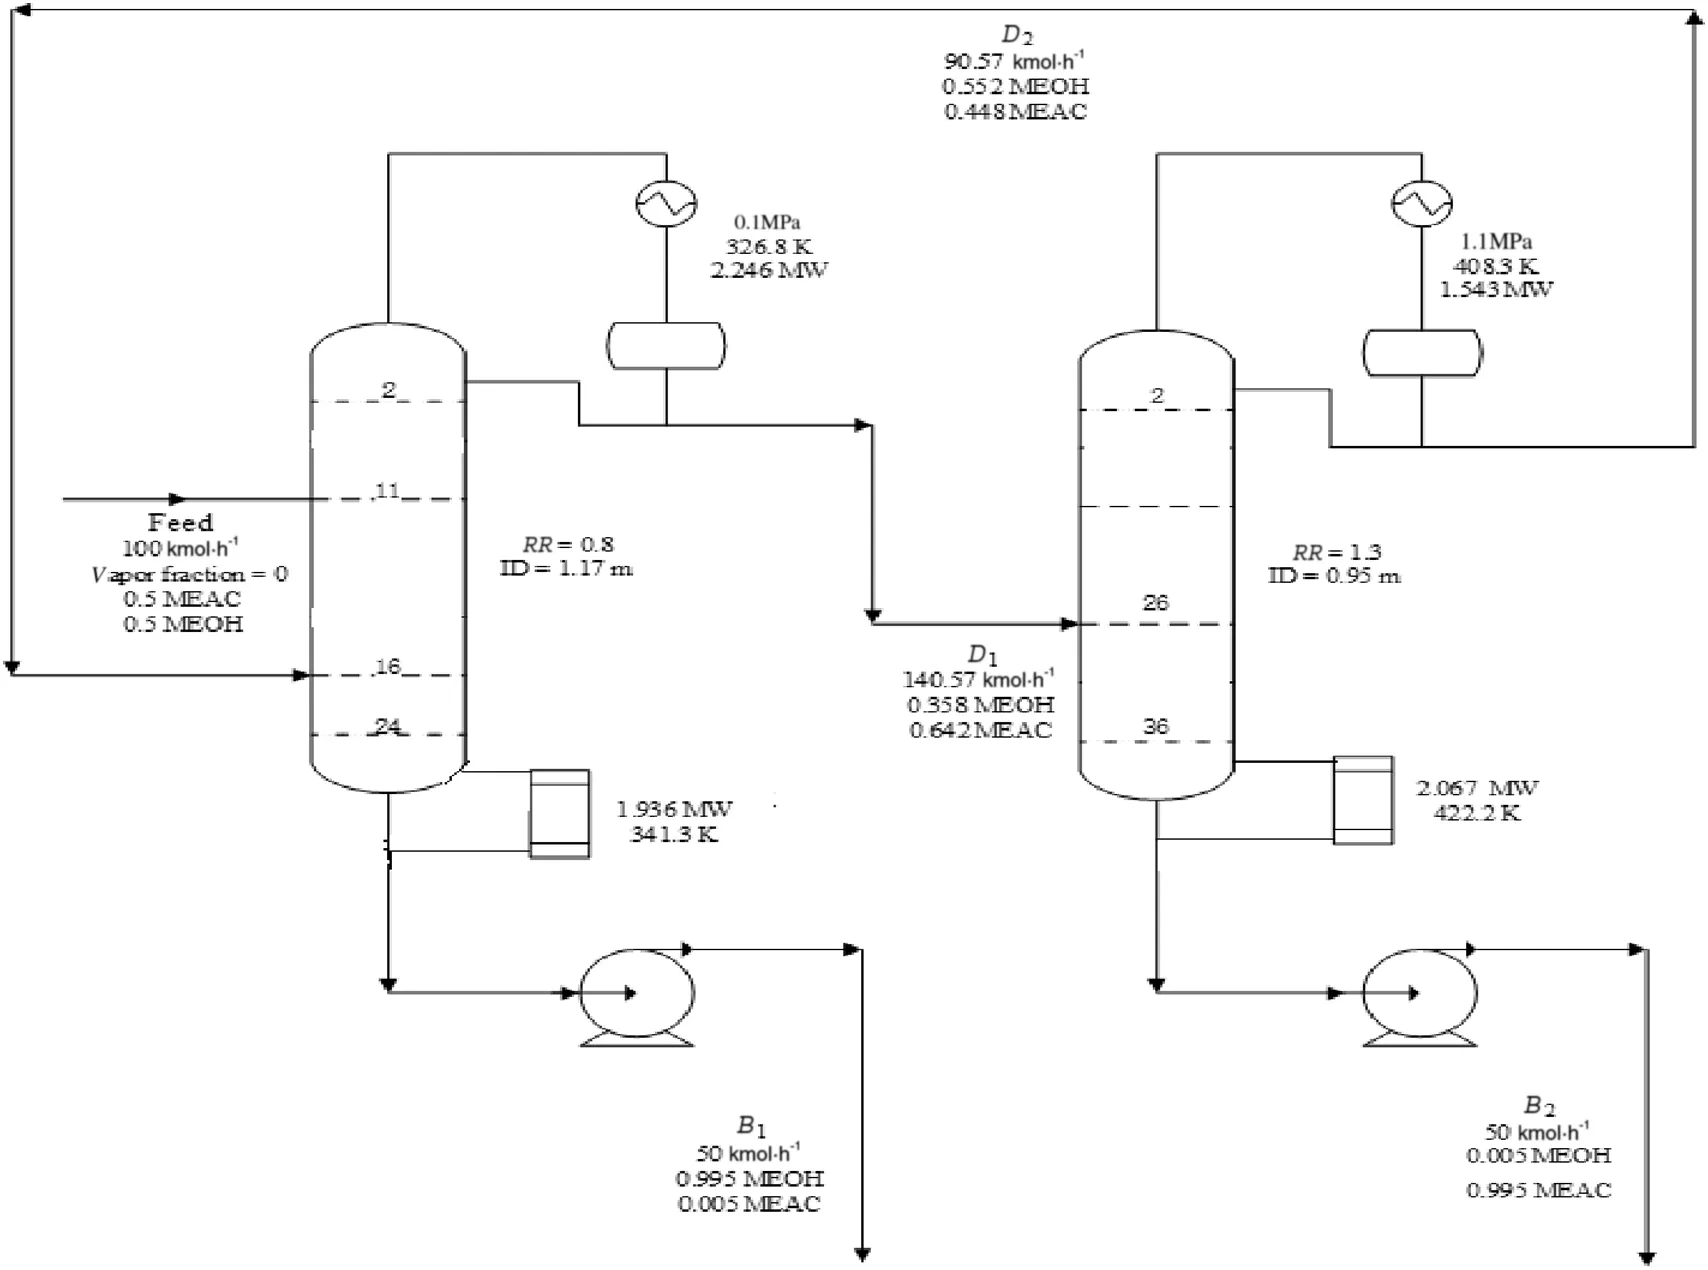
Fig.3.Flowsheet conditions of PSD without heat integration.
3.1.Selection of temperature control trays
As can be seen from Fig.4,the temperature pro files of LPC and HPC are monotonously increasing.The temperature control tray locations can be exactly selected based on the sensitivity criterion and singular value decomposition(SVD)analysis[17,18].For sensitivity analysis,a very small change(0.1%)is made in one of the two manipulated variables of QRand RR,while keeping the other inputs fixed,then dividing the change in the tray temperature by the percentage in the manipulated variable gives the openloop steady-state gain on each tray.A gain matrix K is formed,which has NTrows and two columns.This matrix is decomposed into three matrices:K=UσVT.The two U vectors are plotted against tray numbers,as shown in Fig.5.These curves show thatstage 21 of LPC is sensitive to the change in QRand both stages 20 and 23 are sensitive to the change in RR.It also shows that stage 33 of HPC is sensitive to change in QRand both stages 20 and 23 are sensitive to change in RR.Temperatures on all trays in both columns are quickly affected by the change in QR,so pairing QRwith any tray temperature is dynamically feasible.However,a change in RR needs longer time to affect temperatures on trays near the column bottom because of liquid hydraulic lags(3–6 s per tray),and then poor control can be expected when RR is paired with a tray temperature.Therefore,stage 21 of LPC and stage 33 of HPC are controlled by the respective QR.
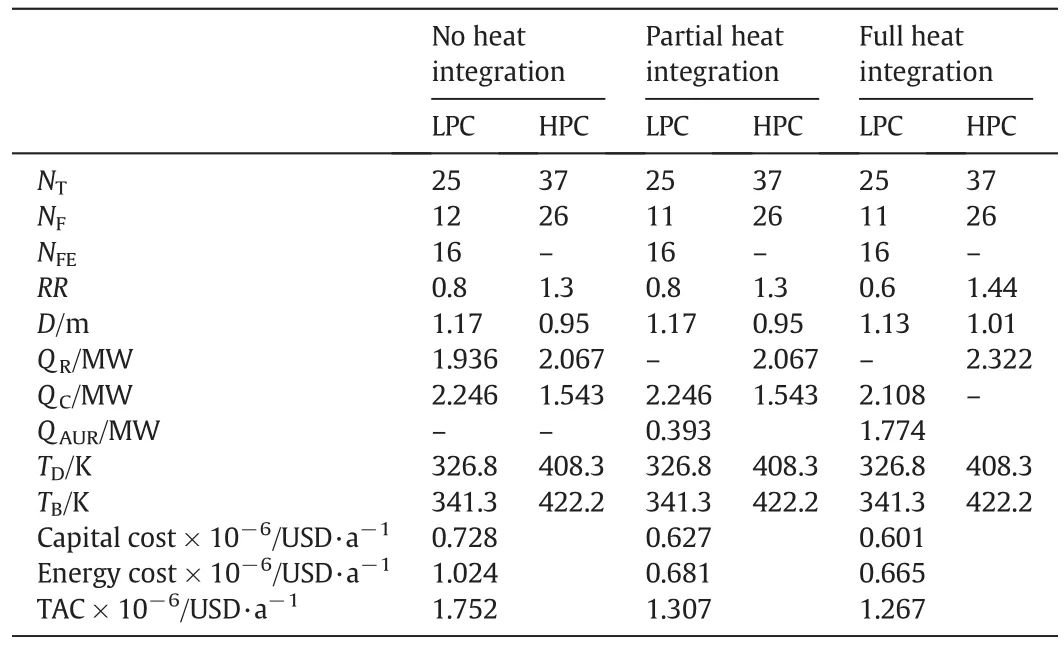
Table 1 The summary of optimum design parameters for PSD with different heat integration modes
3.2.Feed composition sensitivity analysis
Feed composition sensitivity analysis is used to see if a single-end control structure could be effective or if a dual-composition control structure is required[19].Using the Aspen Plus simulation,the methanol and methyl acetate compositions of the feed to LPC are changed from their design values while maintaining the specified product purity in the distillate and bottom by using Design spec/vary functions.For these calculations,the feed flowrate is held constant at 100 kmol·h?1.Then the mole fraction of methyl acetate in the feed is changed 0.5±0.05,and the methanol is changed by the opposite direction.Table 2 gives the results of these calculations.
They clearly show that in this system the required changes in RR and R/F of HPC are small.For the HPC,a single-end control structure with fixed RR should be better at handling feed composition changes than that with the fixed R/F because of smaller percent changes.For the LPC,the contrary is the case.But the percent change in R/F is greater with the mole fraction of methyl acetate increasing than that decreasing.If there are significant changes in the rations of RR,R/F and QR/F,single-end control will probably be ineffective[19].Fortunately,the fixed QR/F control structure should be better at handling feed composition changes than a fixed R/F structure.
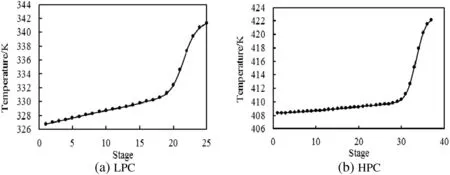
Fig.4.Temperature pro file of(a)LPC and(b)HPC.
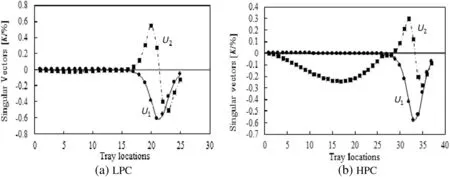
Fig.5.Singular value decomposition analysis of(a)LPC and(b)HPC.
3.3.Control Structure
3.3.1.Basic control structure
Fig.6 gives the basic control structure developed for PSD with partial heat integration.Feed is flow controlled and acts as the production rate handle.Base levels in both columns are controlled by manipulating bottom flowrates,while the reflux drum levels are controlled by manipulating the corresponding distillate flowrates.The reflux ratios in both columns are fixed.The temperature on tray 21 in LPC is controlled by manipulating the auxiliary reboiler heat duty of LPC.The temperatureon tray 33 in HPC is controlled by manipulating the reboiler heat duty of HPC.The pressure in LPC is controlled by manipulating the condenser heat removal of LPC.However,there is no pressure controller in HPC,and this pressure changes with the operating conditions.Note that the output of the TC1 is not connected to anything on the diagram.This output signal is equal to the auxiliary reboiler heat duty.
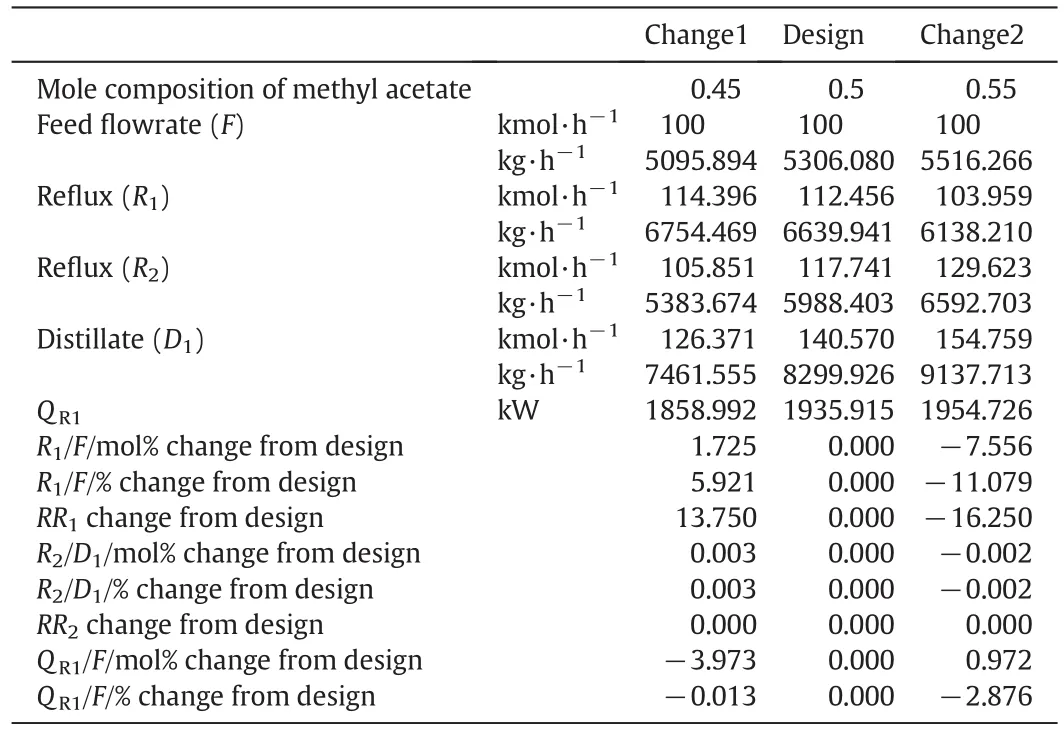
Table 2 Feed composition sensitivity analysis
The effectiveness of this control structure is illustrated in Figs.7 and 8.Fig.7 gives the dynamic responses of this control structure to a±10%step changes at the set point of the feed flow controller after time equals 1 h.The solid lines demonstrate the response for a positive change in the feed flowrate,while the dashed lines show the response for negative changes.It is seen that a stable base-level regulatory control is provided using this basic control structure.The controlled tray temperatures settle down to their set points after about 3 h.The product purity of LPC is held quite fairly close to this specification and the product purity of HPC is away from the 99.5 mol%.In the case of positive step change,the transient deviation in the composition of the methyl acetate productis higherthan that of the methanol product.No big difference is observed in the transient behaviors of product streams when a negative step change takes place in the feed flowrate.When the feed flowrate increases to 110 kmol·h?1,the pressure of HPC also increases and vice versa.
Fig.8 shows the dynamic responses for feed composition disturbances at1 h.The solid lines demonstrate the responses for feed composition disturbances from 50 mol%to 60 mol%methanol,while the dashed lines show the responses of the change in feed composition from 50 mol%to 40 mol%methanol.It is seen that a stable base-level regulatory control is provided using this control structure.The controlled tray temperatures settle down to their set points after about 3 h.The product purity of LPC is held quite fairly close to this specification and the product purity of HPC is away from the 99.5 mol%.In the case of positive step change,the transient deviation in the composition of the methyl acetate product is higher than that of the methanol product.No big difference is observed in the transient behaviors of product streams when a negative step change takes place in the feed composition.When the feed composition of methanol increases to 60 mol%,the pressure of the high-pressure column decreases and vice versa.The tuning parameters of temperature controllers are shown in Table 3.
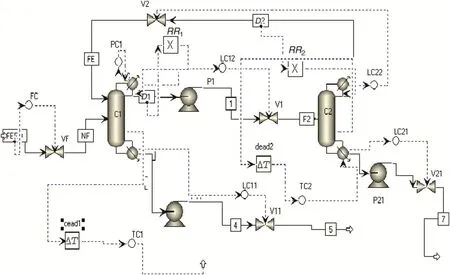
Fig.6.Basic control structure.
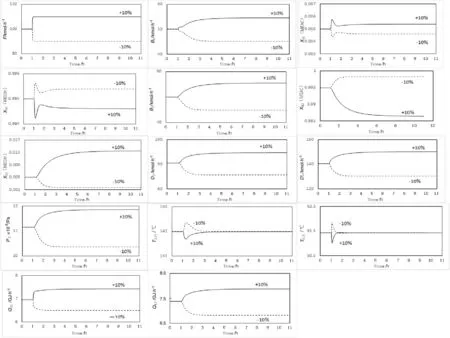
Fig.7.Dynamic responses to±10%disturbance in feed flowrate.
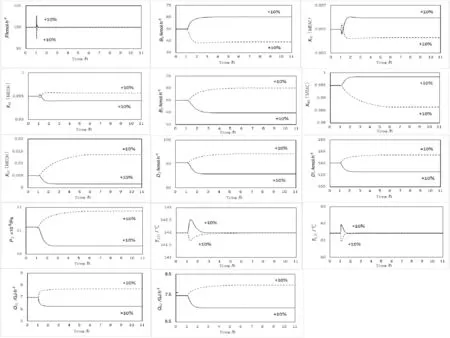
Fig.8.Dynamic responses to±10 mol%disturbance in feed composition.
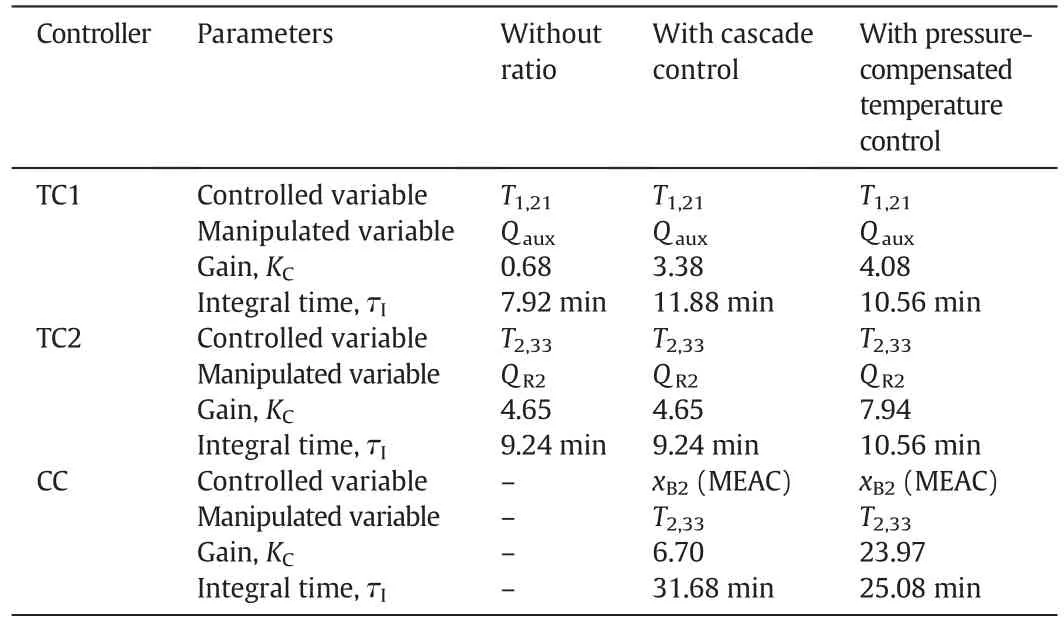
Table 3 Temperature and composition controllers tuning parameters
3.3.2.Temperature/composition cascade control structure
For the above basic control structure,the bottom product purity of HPC is deviating from the set point.This problem can be greatly improved by using temperature/composition cascade control structure.Fig.9 gives the revised control structure with the temperature/composition cascade control scheme.The tray temperature controller is the secondary controller.It is set up in exactly the same as the previous section.It seems to manipulate the reboiler heat duty of HPC with tray temperature(stage 33)and manipulates the reboiler heat duty of HPC.However,its SP is not fixed.The SP signal is the output signal of the composition controller,which is the primary controller.
The effectiveness of this control structure is illustrated in Figs.10 and 11.The controlled tray temperatures turn back into their set point values,and the product purities are held quite close to their steady state values.In the case of negative step change in the feed flowrate,the transient deviation in the composition of the methanol product and methyl acetate product is higher.No big difference is observed in the transient behaviors of product streams when a positive step change takes place in the feed flowrate.This occurs because the effect of the pressure changes in HPC is not considered by this control structure.The tuning parameters of the temperature controller and temperature/composition cascade controllers are shown in Table 3.
3.3.3.Pressure-compensated temperature control
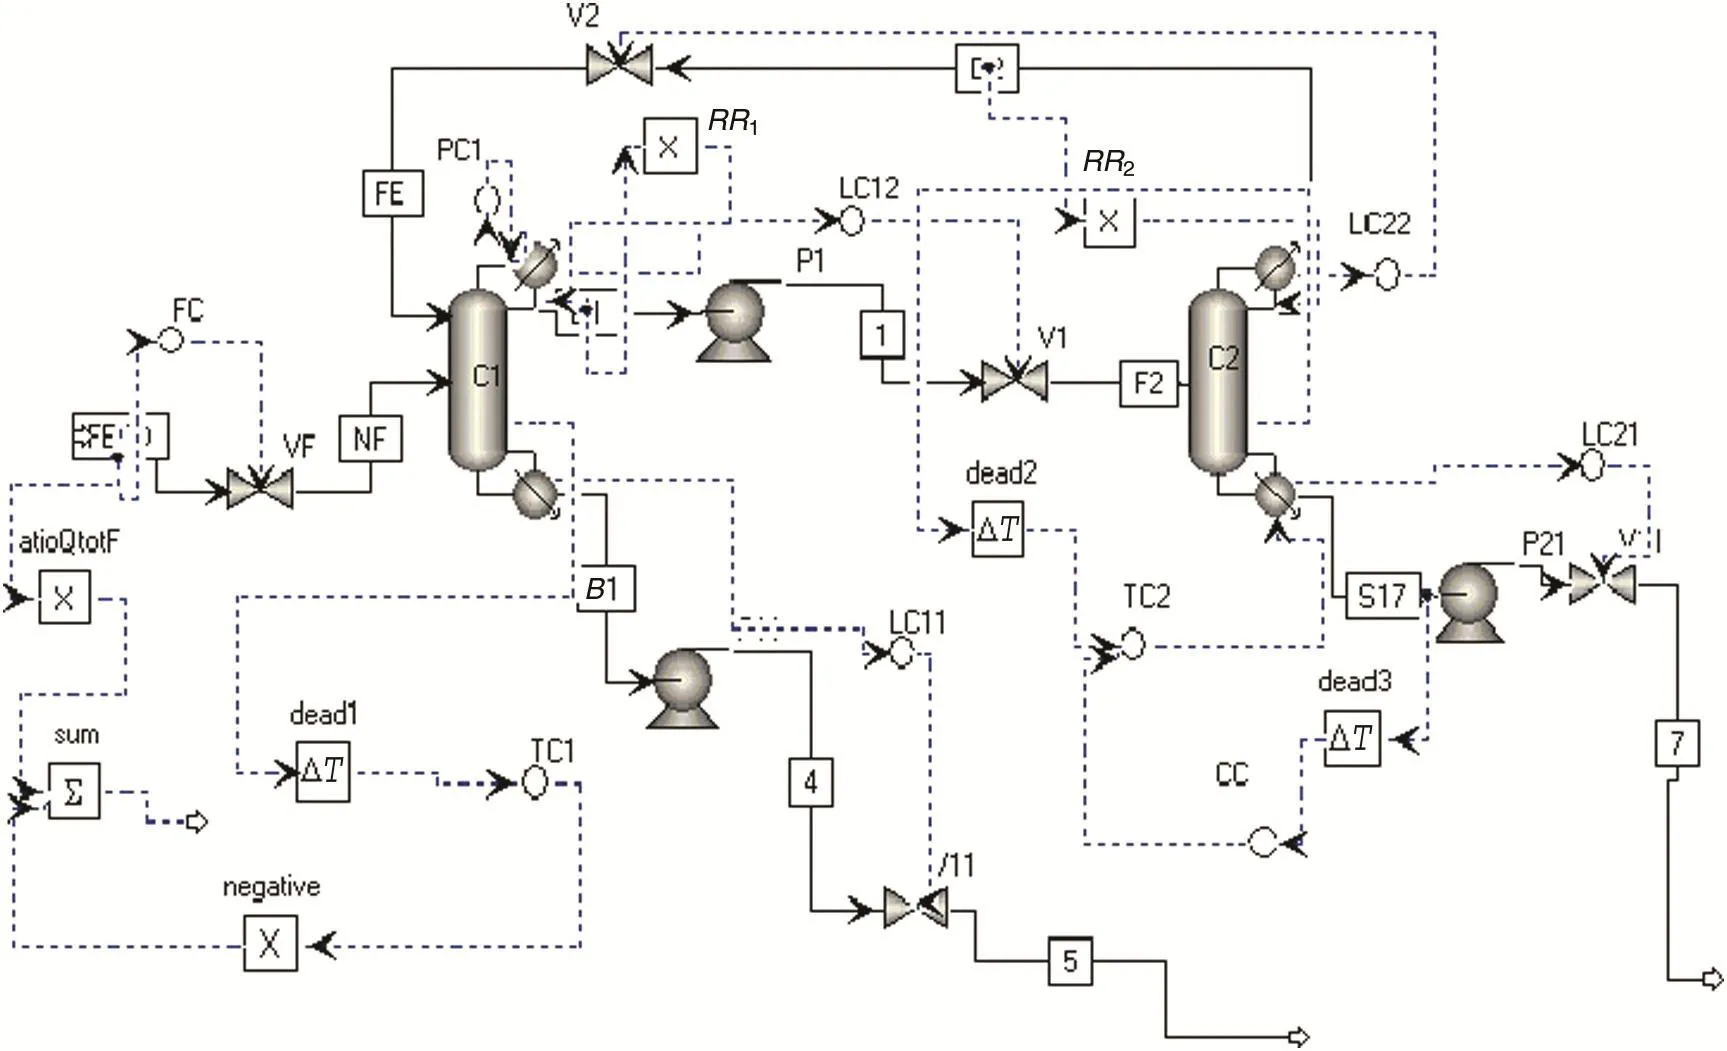
Fig.9.Control scheme with ratio and cascade structure.
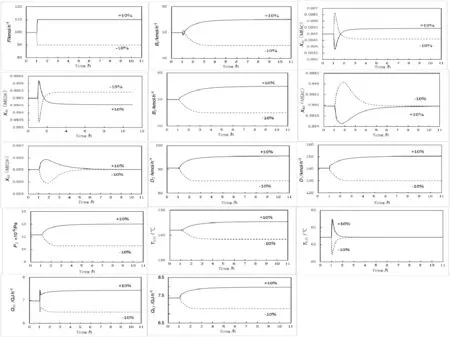
Fig.10.Dynamic responses to±10%disturbance in feed flowrate.
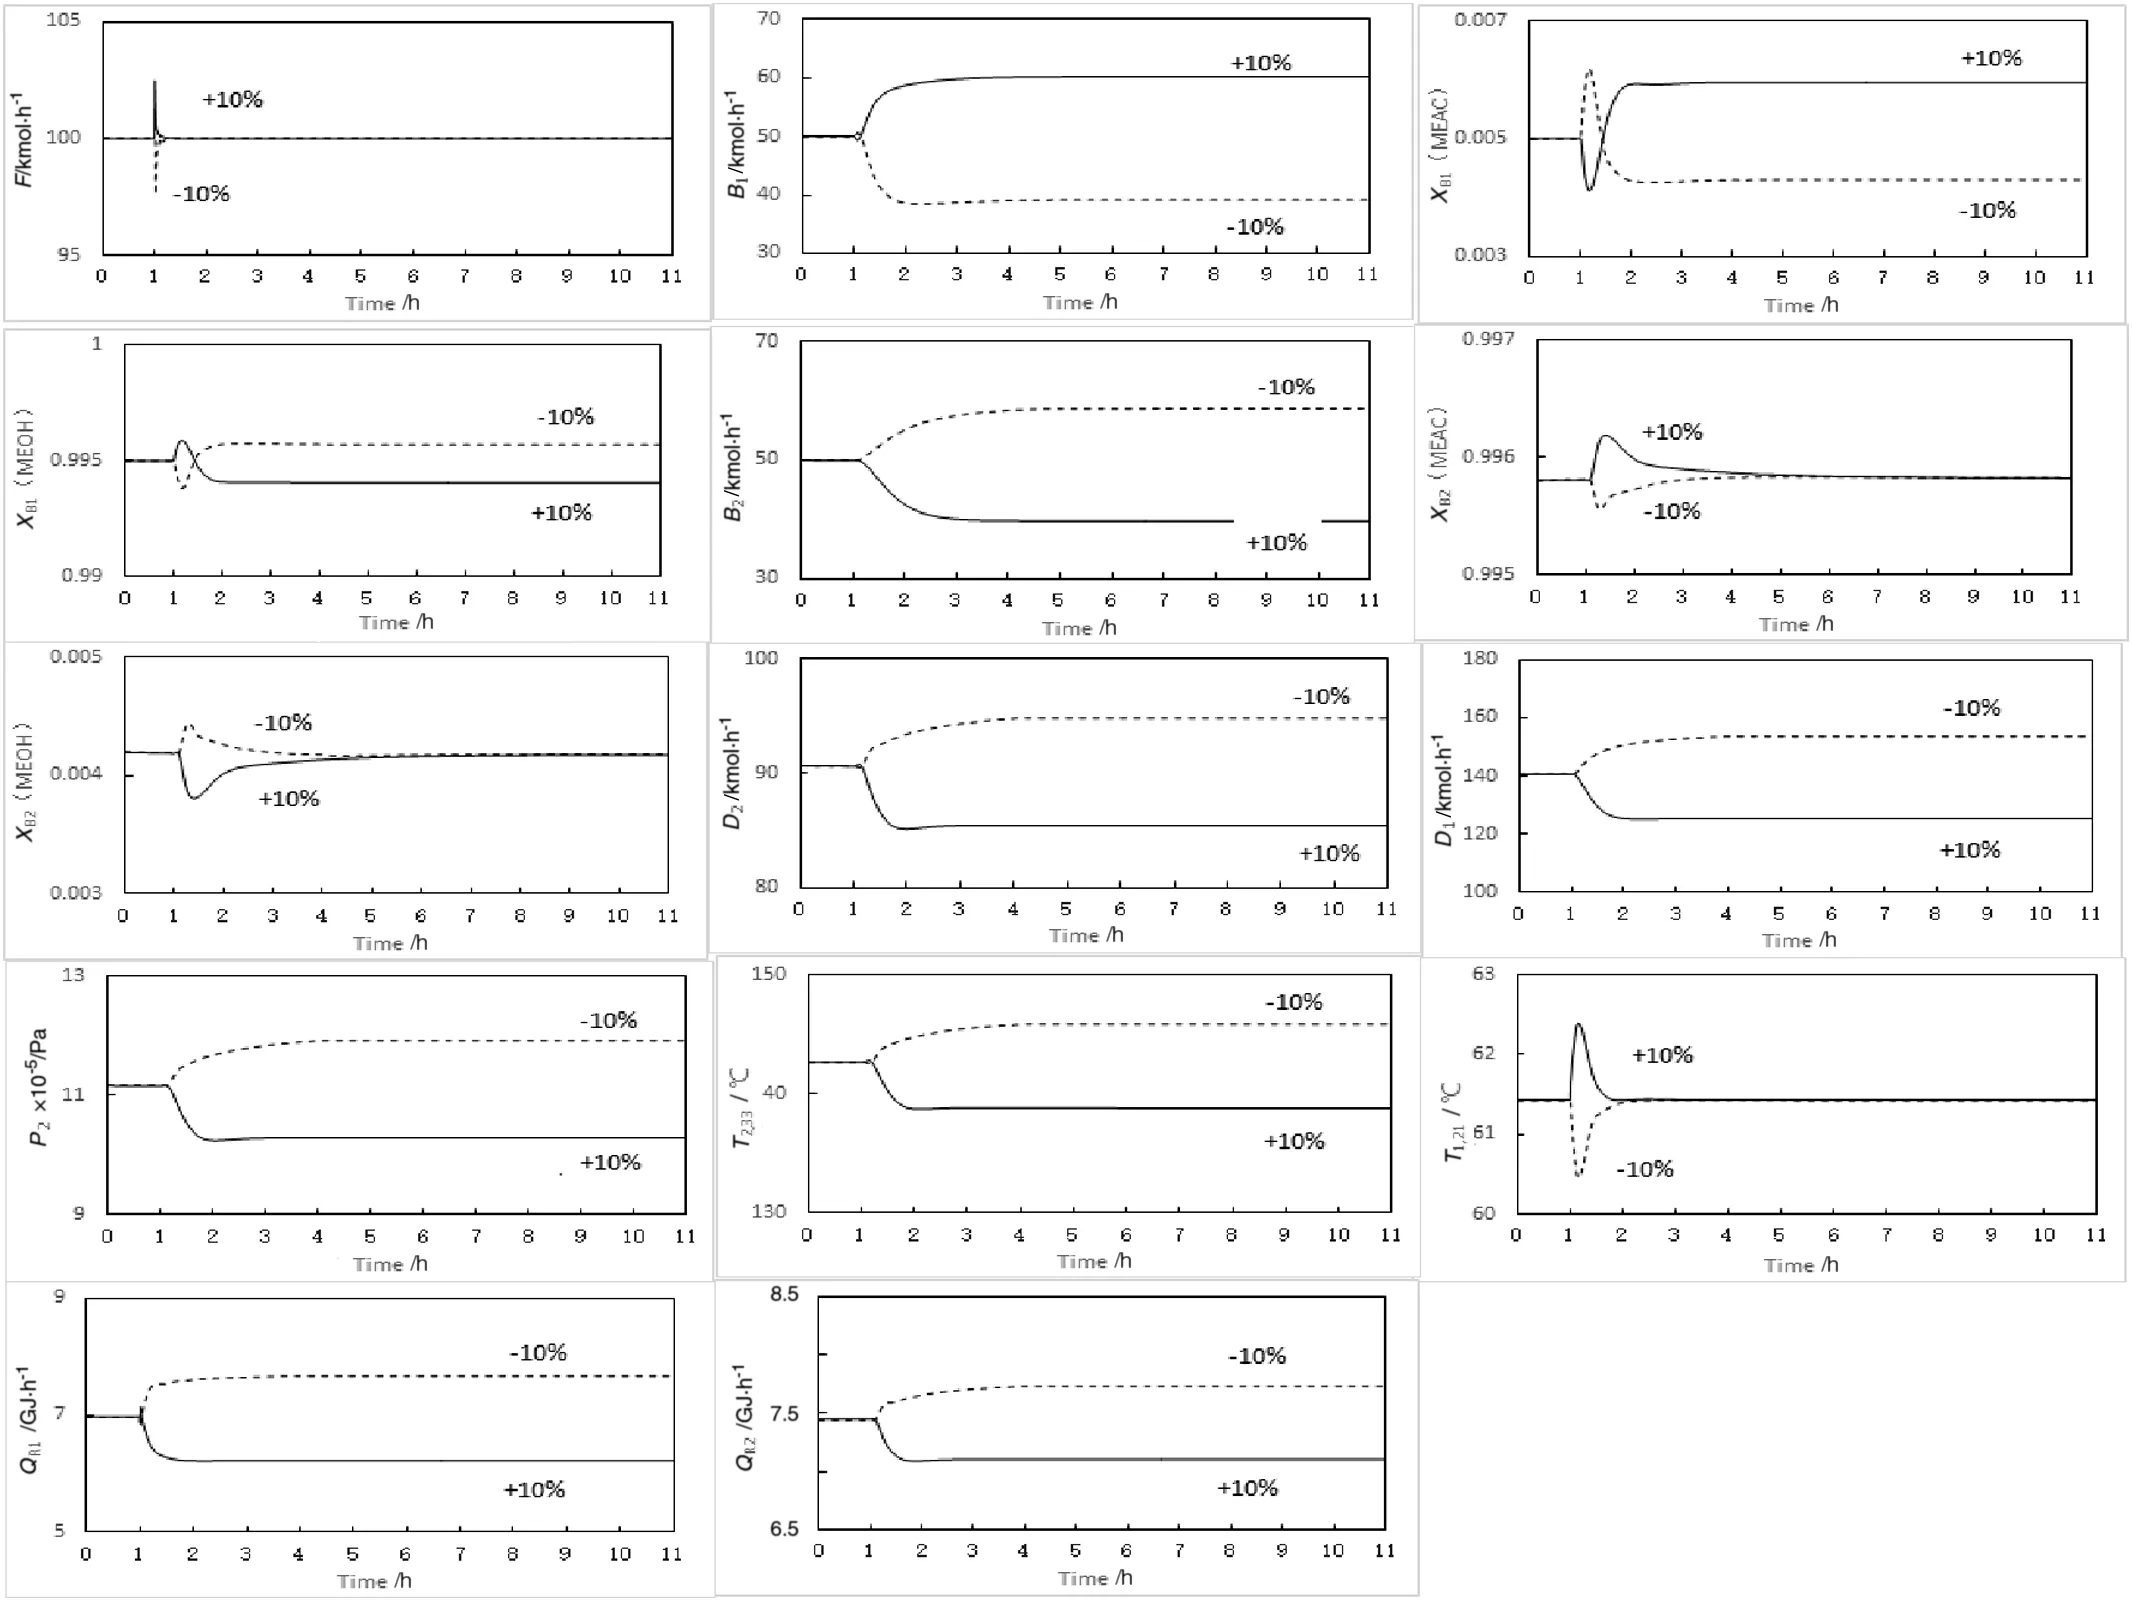
Fig.11.Dynamic responses to±10%disturbance in feed composition.
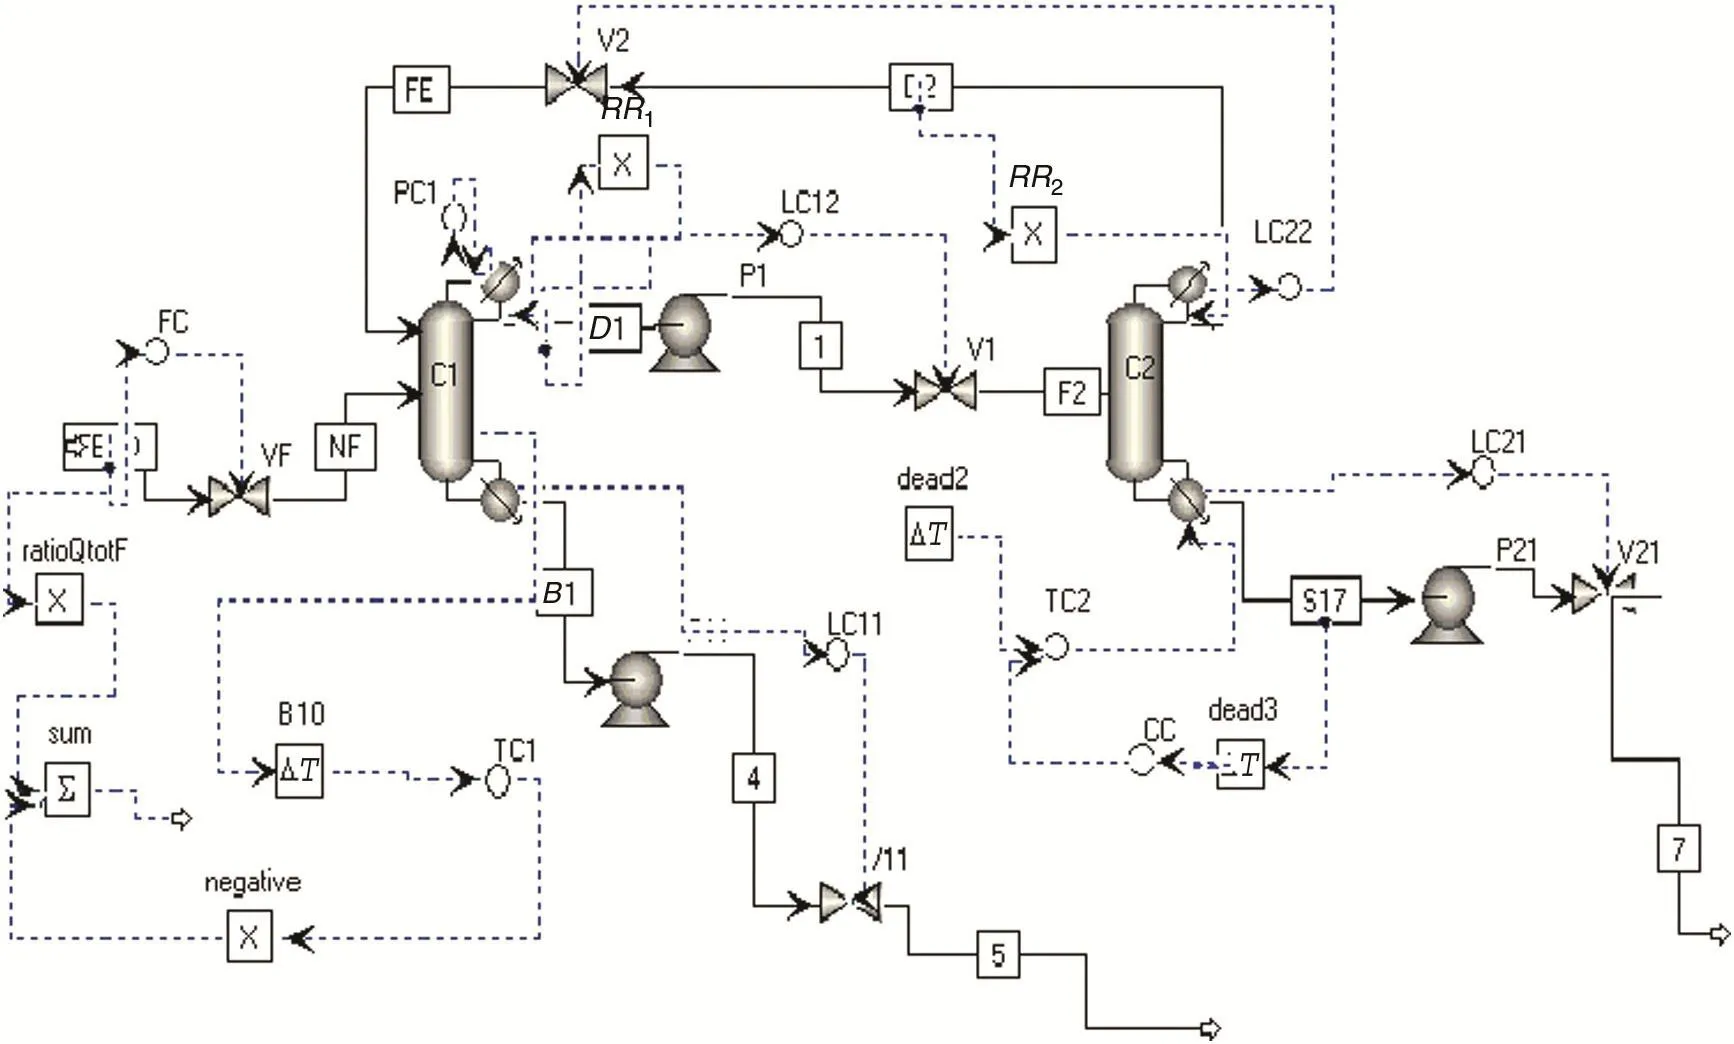
Fig.12.Control scheme with pressure-compensated temperature control.
The above problem could be solved using a pressure-compensated temperature control.Fig.12 shows this control structure.At first look,it seems that the dead time block “dead2”has not input signal,but its output is fed to the temperature controller“TC2”.Actually,its input signal is the pressure-compensated temperature signal given by Eq.(1),which is implemented in Aspen Dynamics using the“Flowsheet Equation”function[20].

The right side of this equation includes the temperature for tray 33 and the top pressure in HPC,the pressure data of tray 33 at the design conditions,and a coefficient 0f 4.0525.To find the coefficient,liquid phase composition of tray 33 in HPC at design conditions(0.89)is obtained and bubble point temperatures are calculated for a range of pressure.When the operating pressure of HPC is 1.132 MPa,the liquid phase composition of tray 33 of HPC is equal to 0.89.
The effectiveness of this control structure is illustrated in Figs.13 and 14.The solid lines in Fig.13 give results for+10%change in feed flowrate using the pressure-compensated temperature scheme.The controlled tray temperatures turn back into their set point(SP)values,and the product purities are held quite close to their steady state values.The transition change of the methanol and methyl acetate product purities is very small.The reverse is true when the flowrate decreases.
Fig.14 shows responses for feed composition disturbances using the pressure-compensated scheme.Feed composition is changed from50 to 60 mol%methanol or from 50 mol%to 40 mol%methanol.Notice that the stage 33 of high-pressure column changes as the pressure in HPC P2changes.These responses are quite similar to those found in the no heat integration system,so partial heat integration also provides good dynamic control.The tuning parameters of the temperature/composition controllers are shown in Table 3.
4.Control Structure for PSD With Full Heat Integration
4.1.Basic control structure
Fig.15 gives the basic control structure developed for PSD with full heat integration.Feed is flow controlled and acts as the production rate handle.Base levels in both columns are controlled by manipulating bottom flowrates,while the re flux drumlevels are controlled by manipulating the corresponding distillate flowrates.The reflux ratios in the both columns are fixed.The temperature on tray 21 of LPC is controlled by manipulating the reboiler heat duty of HPC.The temperature on tray 33 of HPC is controlled by manipulating the reflux ratio of HPC.The pressure of LPC is controlled by manipulating the condenser heat removal of LPC.However,there is no pressure controller in HPC and this pressure changes with the operating conditions.

Fig.13.Dynamic responses to±10%disturbance in feed flowrate.
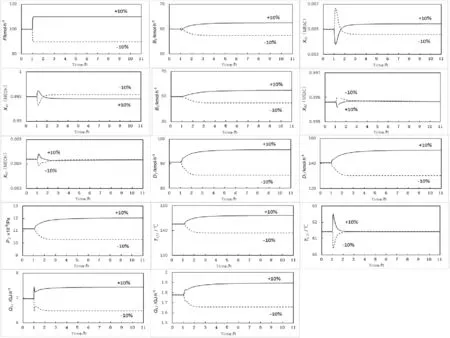
Fig.14.Dynamic responses to±10 mol%disturbance in feed composition.
The alternative control structure of controlling the temperature in LPC with the reflux ratio in the LPC might seem a more logical choice.However,the reflux ratio is pretty small and it makes this structure ineffective.Temperatures are affected much more by vapor boilup than reflux ratio.So,it can be selected as the basic control structure in Fig.15.
Achieving dynamic simulations that rigorously capture the “neat”heat integration require the use of Flowsheet Equations in Aspen Dynamics[20].Fig.16 shows the dynamic responses of the system to±5%step changes at the setpoint of the feed flow controller after time equal 1 h.The solid lines correspond to changing the feed flowrate from 100 to 105 kmol·h?1.Both product flow rates(B1and B2)and the distillate flowrates(D1and D2)increase.The temperature on stage 21 in LPC cannot recover back into the steady-state specification,but the temperature on stage 33 in HPC turns back into the SP values.In addition,the methanol product purity of LPC held fairly close to its specification.However,there are significant steady-state deviations in the methyl acetate product purity of HPC.For the feed flowrate 105 kmol·h?1,the final steady-state purity of methyl acetate is 99.1 mol%and its specification is 99.5 mol%.Or the impurity of methanol of the HPC is 0.9 mol%and its specification is 0.5 mol%.An increase in feed flowrate produces a higher pressure,which will give a higher methanol concentration on the control tray for the same temperature.Remember,methanol is the light component on the other side of the azeotrope.
Fig.17 gives the dynamic responses of this control structure to a±5%step changes feed composition disturbances after time equals 1 h.The solid lines correspond to changing the feed composition from 50 mol%to 55 mol%methanol.The dashed lines correspond to changing the feed composition from 50 mol%to 45 mol%methanol.The controlled tray temperatures turn back into their SP values.However,there are significantsteady-state deviations in the methyl acetate product purity of HPC.For the feed with methanol 55 mol%and methyl acetate 45 mol%,thefinalsteady-state purity of methyl acetate is 99.7 mol%and its specification is 99.5 mol%.Or the impurity of methanol of HPC is 0.3 mol%and its specification is 0.5 mol%.More methanol in the feed produces an increase in bottom product B1and the pressure of HPC is decreased,as expected.The third column in Table 4 shows the temperature controllers tuning parameters.
4.2.Feed forward control with ratio structure
This problem can be improved by using a feed forward control with QR/F ratio adjusted by the temperature controller.This control structure is given in Fig.18.The ratio loop is set up by adding a multiplier block into control structure.But this ratio is not fixed.It can be adjusted by the temperature controller of LPC.On the other hand,the pressure of HPC still changes with operating conditions.
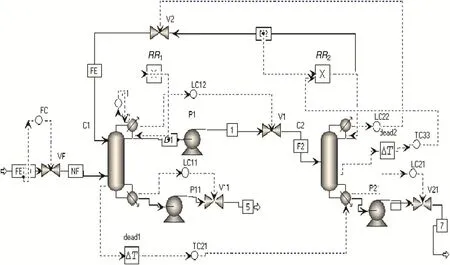
Fig.15.Basic control structure.
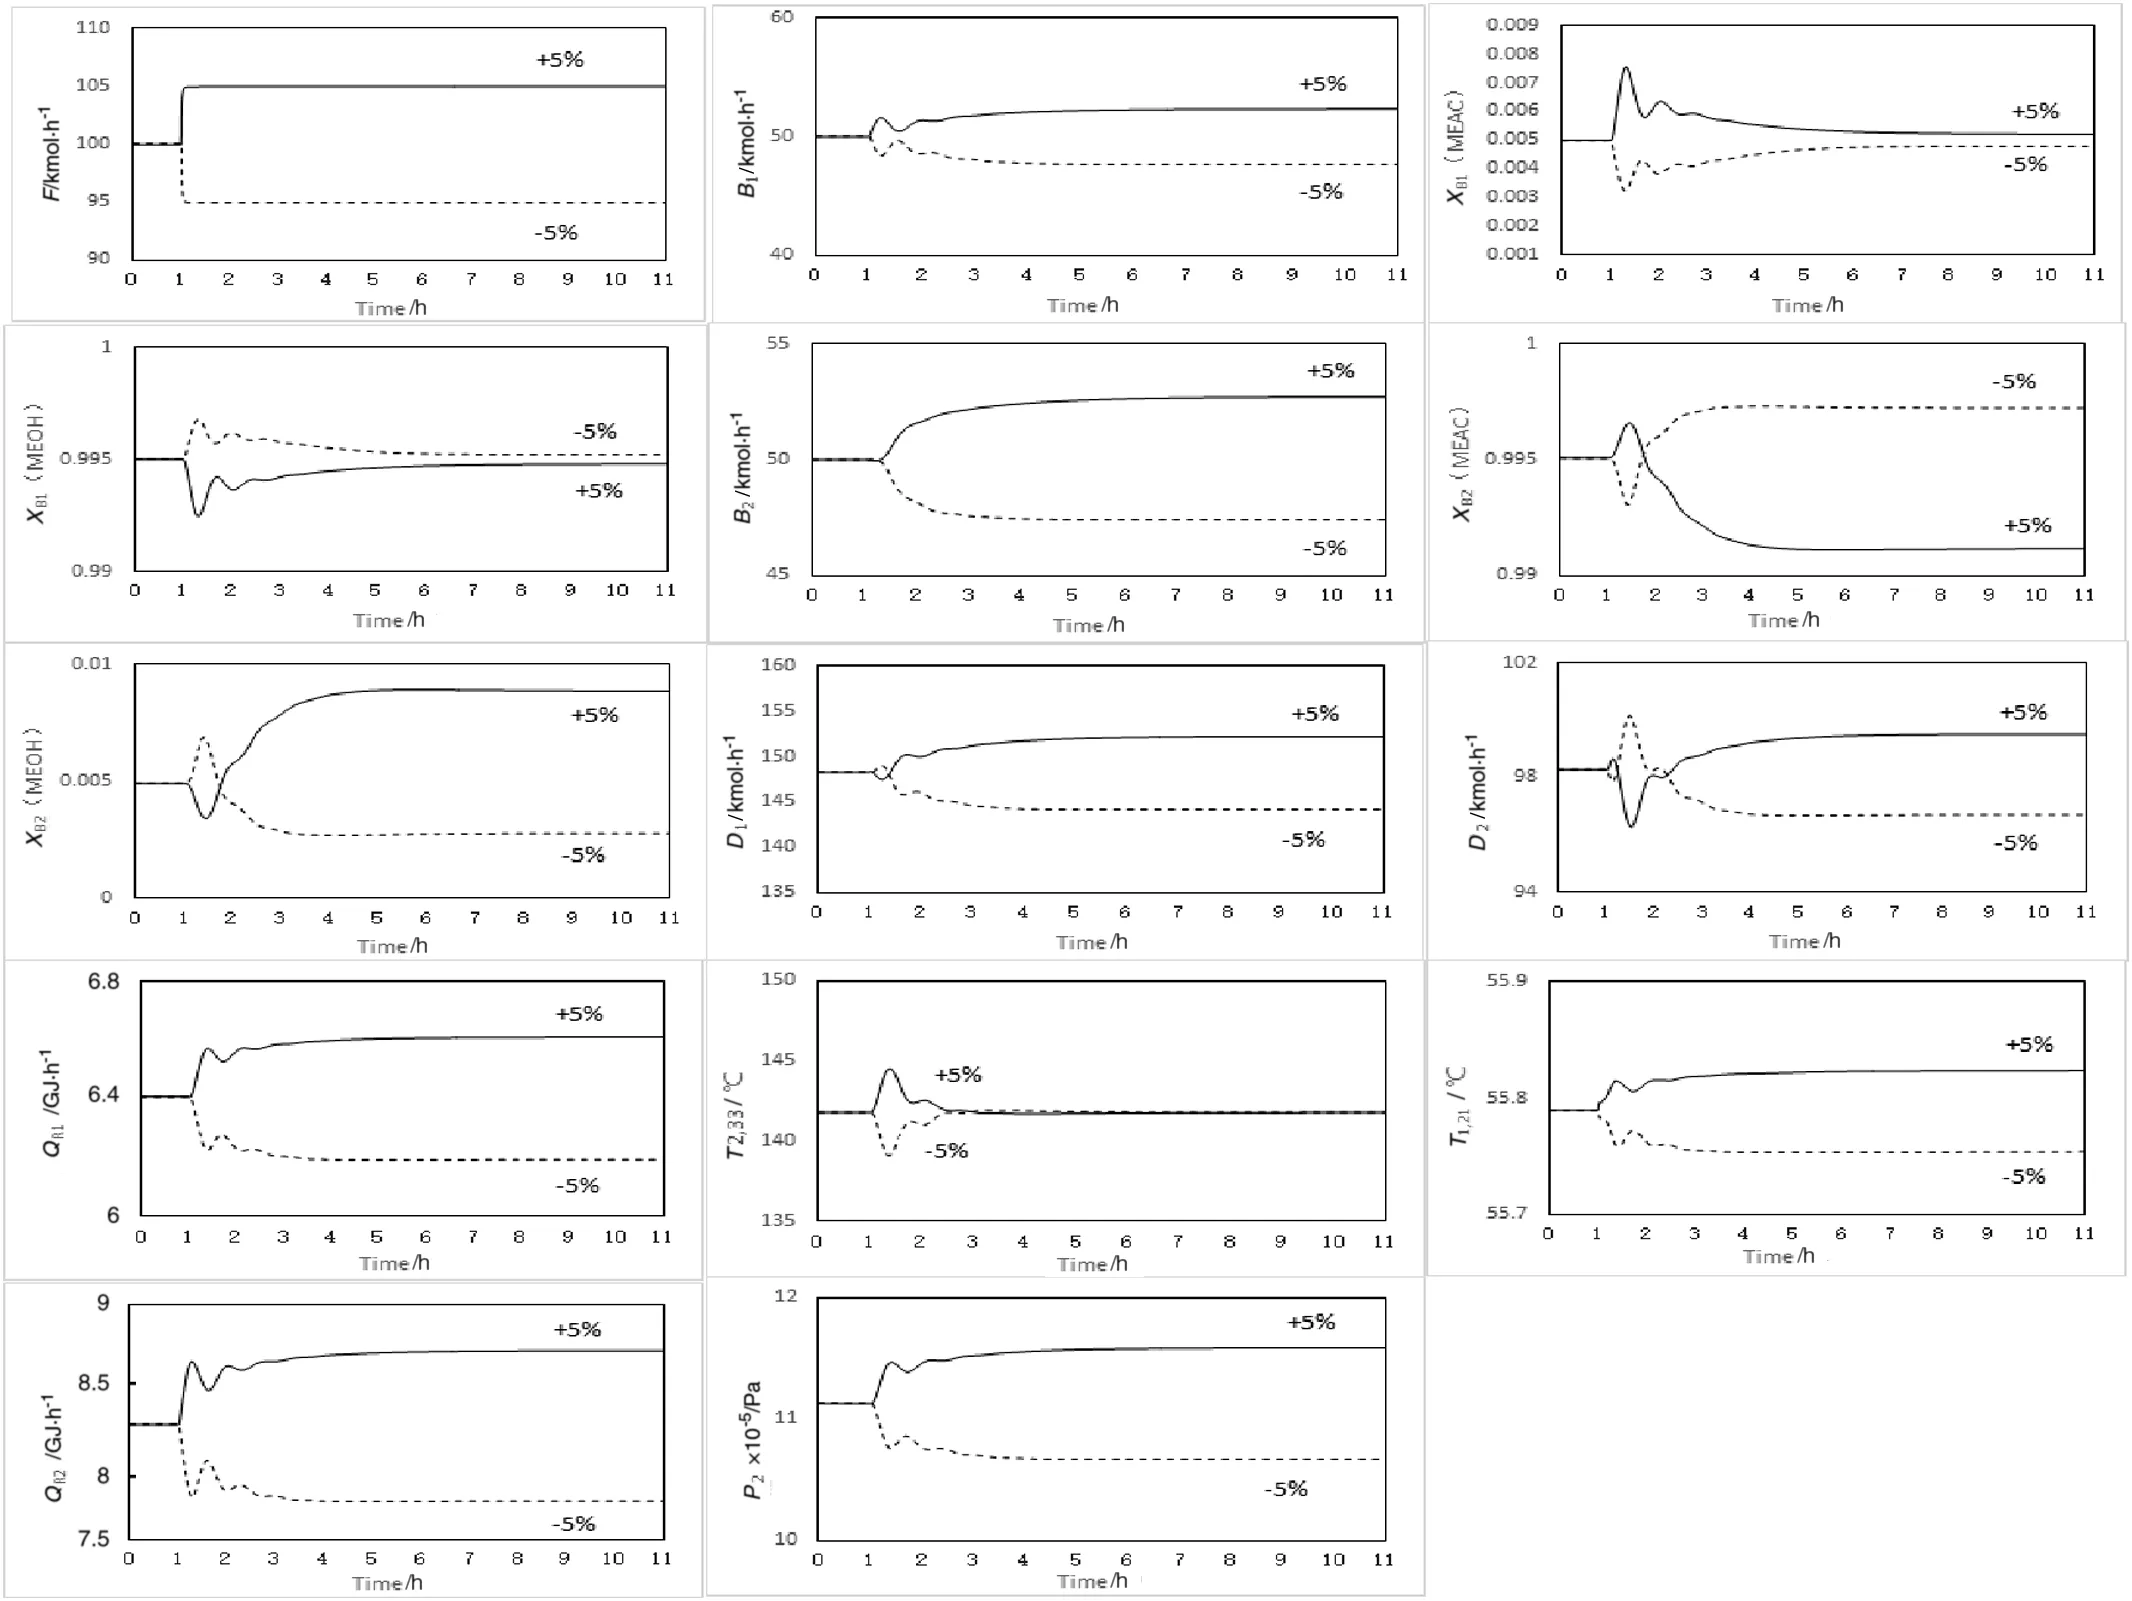
Fig.16.Dynamic responses to±5%disturbance in feed flowrate.
Fig.17.Dynamic responses to±5 mol%disturbance in feed composition.
The effectiveness of this control structure is illustrated in Figs.19 and 20.It is seen that the results of this control structure are similar to the results of control structure in Fig.15.Control structure with ratio provides a stable base-level regulatory control and methanol product purity in LPC is kept close to its desired value.However,the new steady-state value of methyl acetate product stream is not maintained close to 99.5 mol%specification.The purity level of methyl acetate ends up lower than 99.1 mol%for increases in feed flowrate and for decreases in feed composition.Thus,no improvement is observed in the dynamic response of the process using the control structure with ratio.
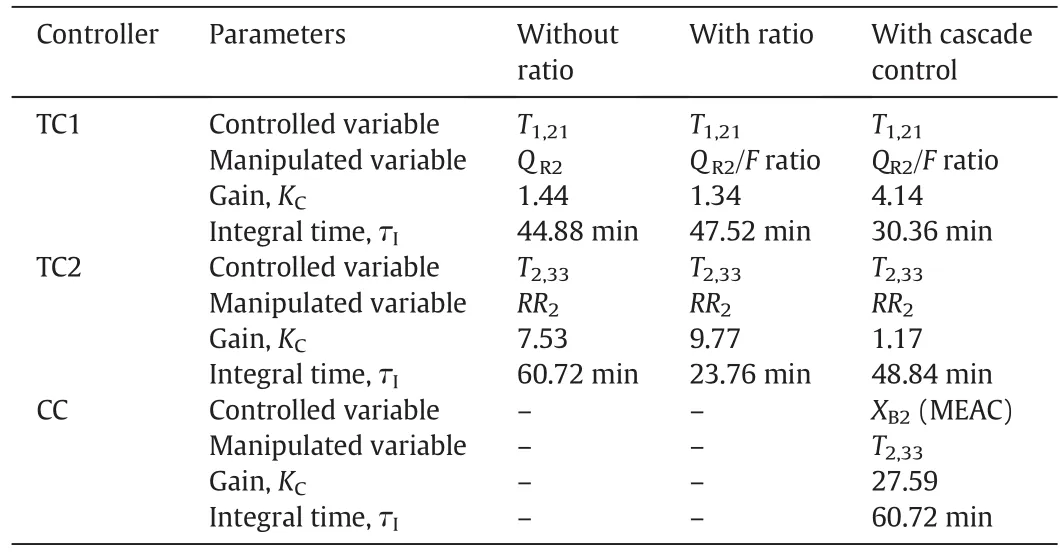
Table 4 Temperature and composition controllers tuning parameters
4.3.Temperature/composition cascade control structure
For the above two kinds of control structures,the bottom product purity of HPC is deviating from the SP.This problem can be greatly improved by using temperature/composition cascade control structure.Fig.21 gives the revised control structure with the temperature/composition cascade control scheme.The tray temperature controller is the secondary controller.It is set up in exactly the same as the previous section.It looks at tray temperature(stage 33)and manipulates the reboiler heat duty of HPC.However,its SP is not fixed.The SP signal is the output signal of the composition controller,which is the primary controller.
The effectiveness of this control structure is illustrated in Figs.22 and 23.Fig.22 gives the dynamic responses of this control structure to a±5%step changes at the setpoint of the feed flow controller after 1 h.The solid lines correspond to changing the feed flowrate from 100 to 105 kmol·h?1.The dashed lines correspond to changing the feed flowrate from 100 to 95 kmol·h?1.It is seen that a stable baselevel regulatory control is provided using this control structure.When the feed flowrate increased,circulation rates between columns D1and D2increase.The reverse is true for feed flowrate decreasing.The controlled tray temperatures settled down to their setpoints after about 6 h.The controlled tray temperatures turn back into their SP values,and the product purities are held quite close to their steady state values.
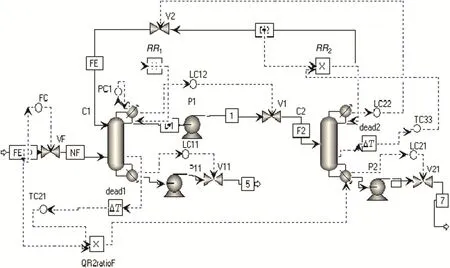
Fig.18.Control scheme with ratio structure.
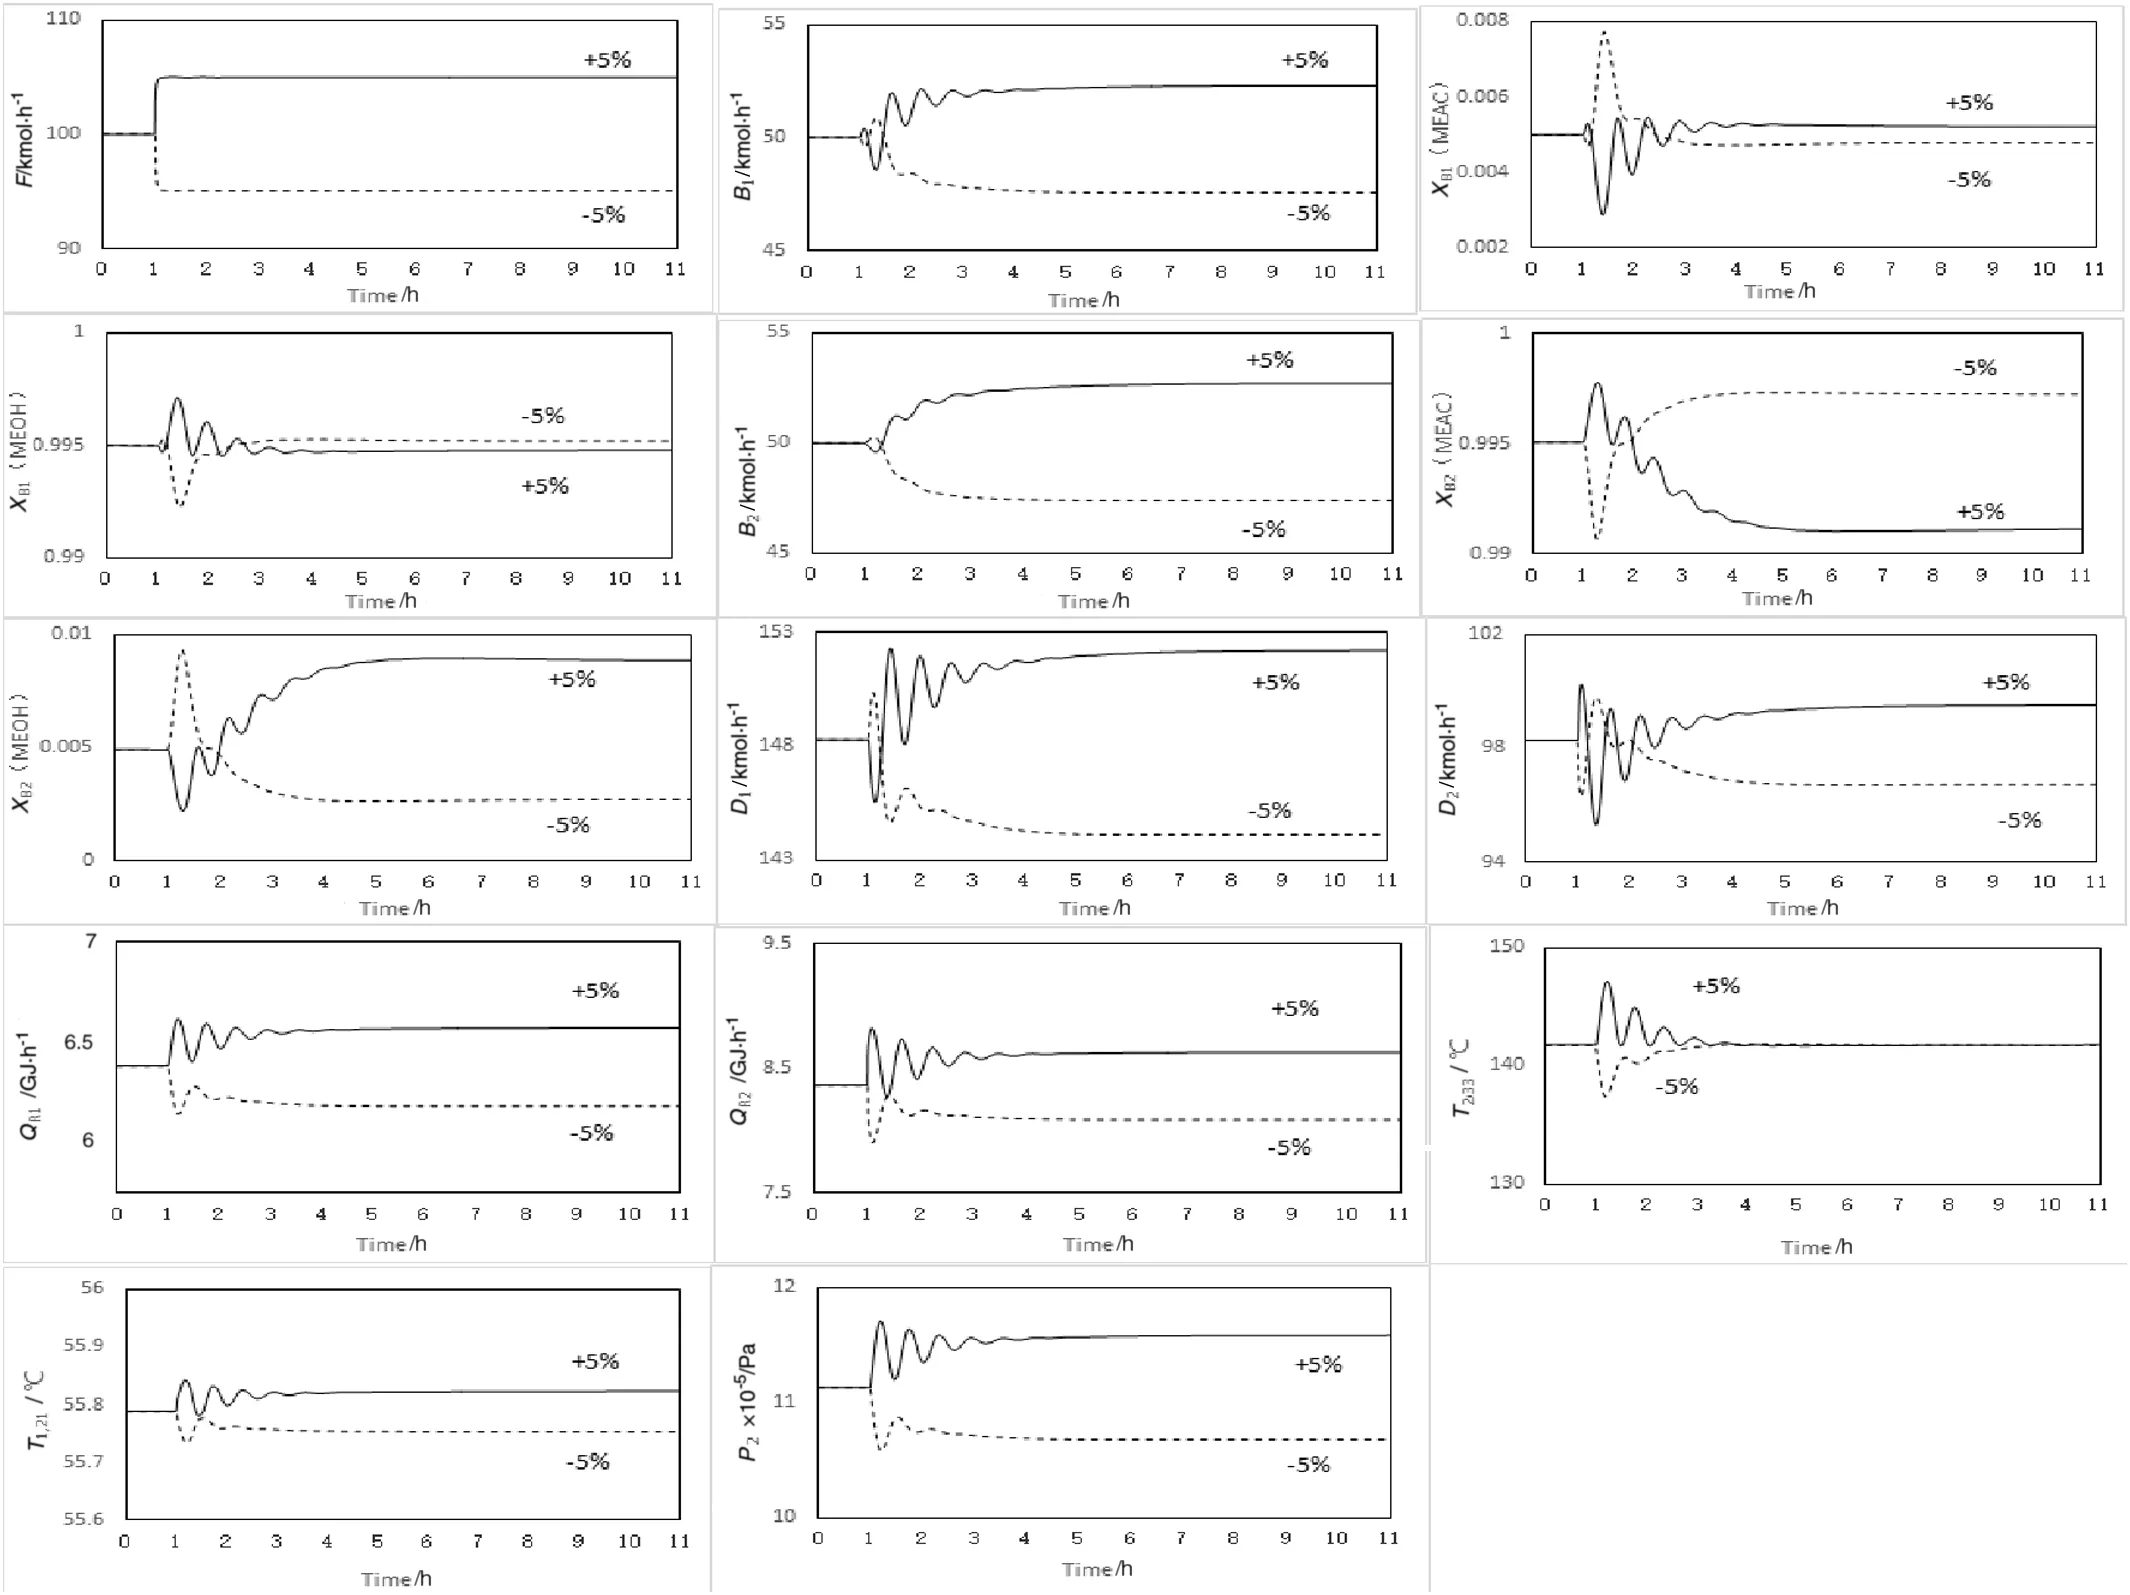
Fig.19.Dynamic responses to±5%disturbance in feed flowrate.
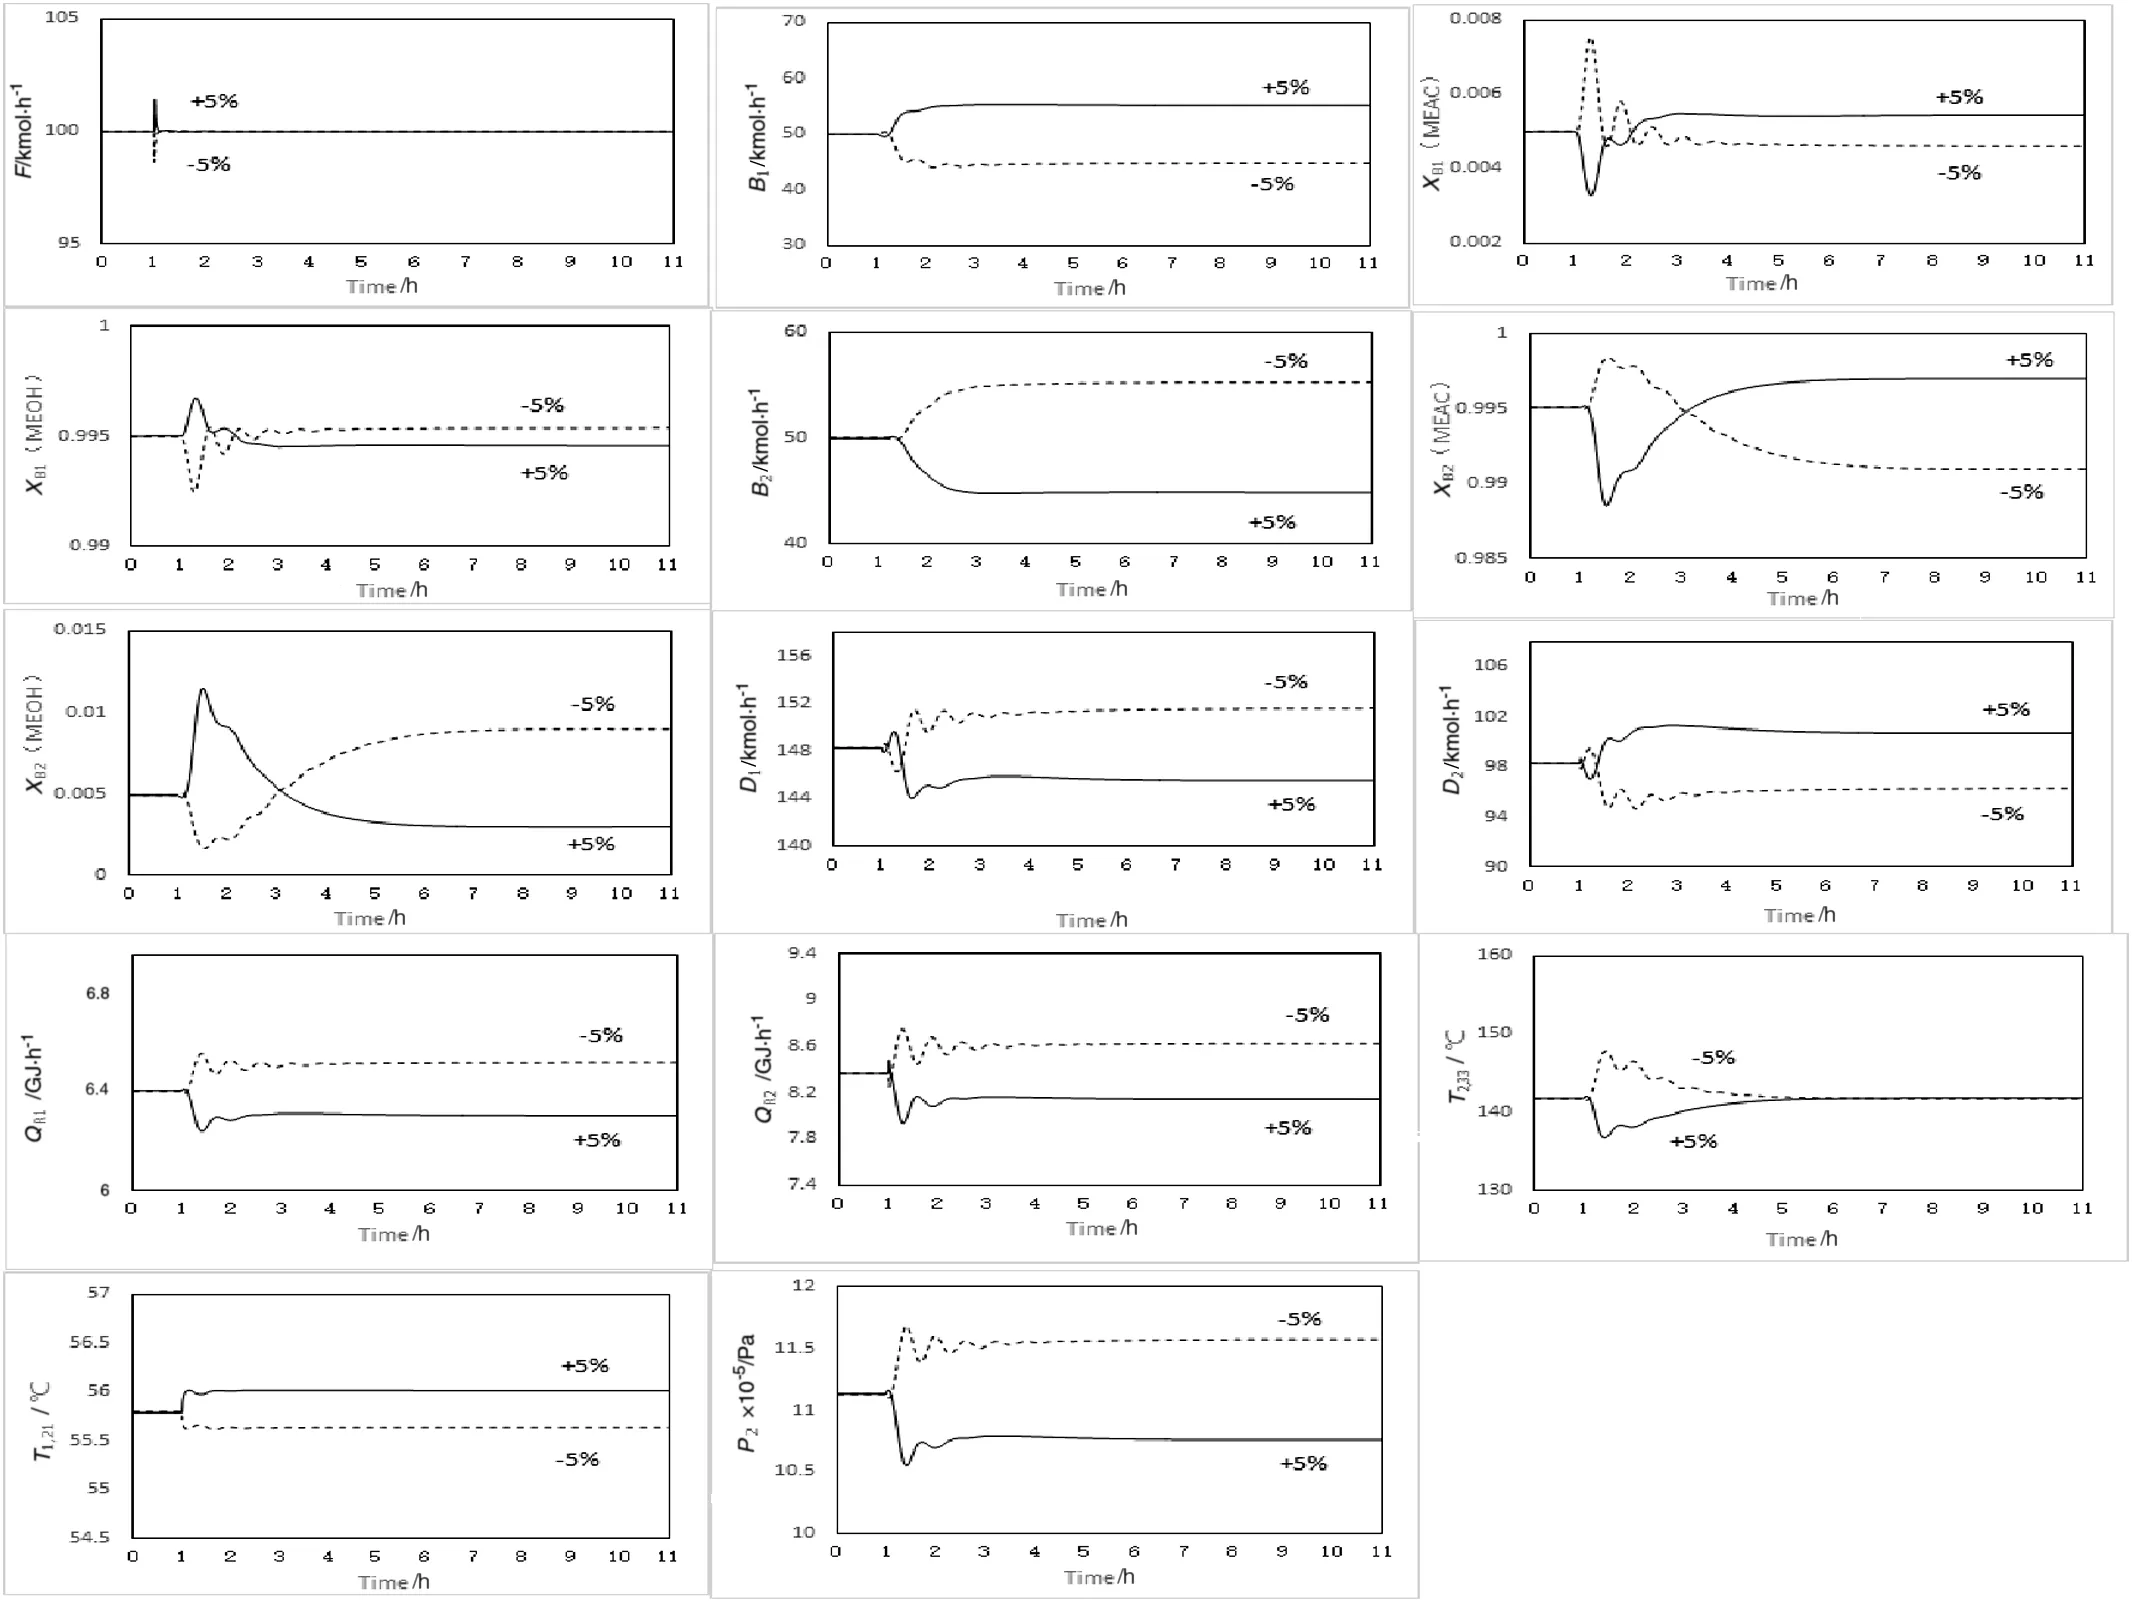
Fig.20.Dynamic responses to±5 mol%disturbance in feed composition.
Fig.21.Control scheme with composition/temperature cascade control.
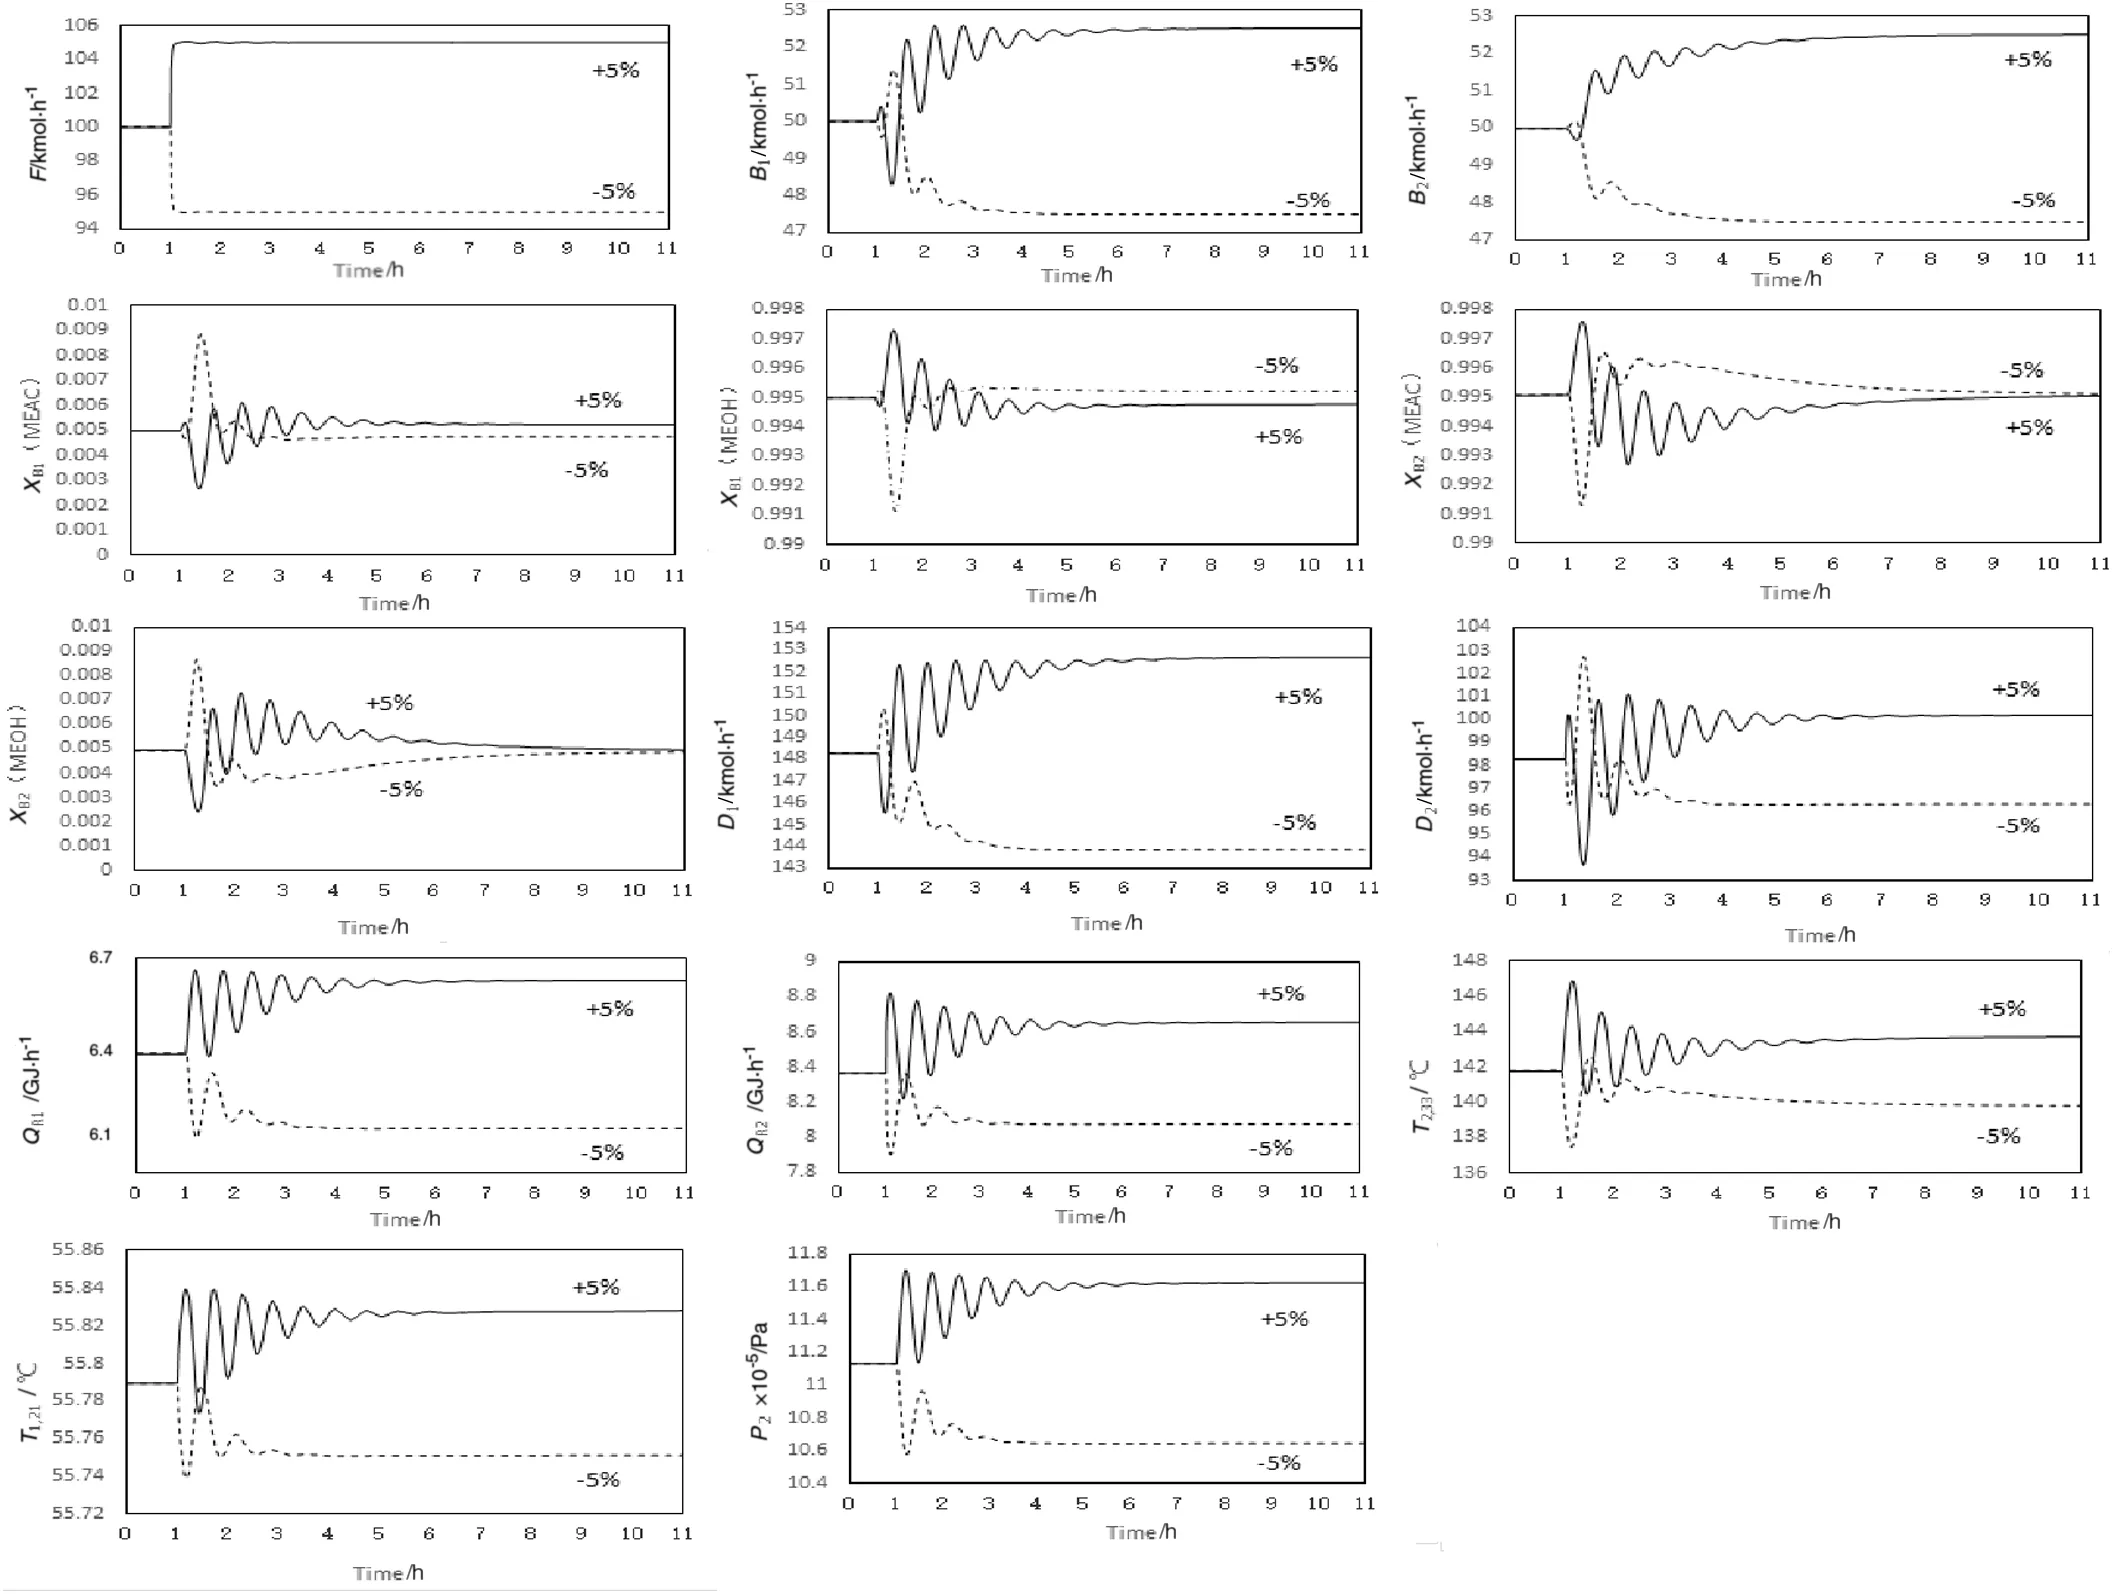
Fig.22.Dynamic responses to±5%disturbance in feed flowrate.
Fig.23 gives the dynamic responses of this control structure to a±5 mol%step changes feed composition disturbances after 1 h.The solid lines correspond to changing the feed composition from 50 mol%to 55 mol%methanol.The dashed lines correspond to changing the feed composition from 50 mol%to 45 mol%methanol.More methanol in the feed produces an increase in bottom product B1and decrease in bottom product B2,as expected.The controlled tray temperatures settled down to their setpoints after about 3 h.The controlled tray temperatures turn back into their SP values,and the product purities are held quite close to their steady state values.The tuning parameters of the temperature and composition controllers are shown in Table 4.
5.Conclusions
An economic/controllability trade-off of PSD with different heat integration modes for the methyl acetate/methanol separation was made using Aspen and Aspen Dynamics.The optimal parameters of PSD without and with heat integration based on the minimum TAC or total reboiler heat duty were obtained via steady-state simulation.The results showed that about 27.68%and 25.40%reduction in TAC can be achieved by the PSD with full and partial heat integration compared to the PSD without heat integration.According to the feed composition sensitivity analysis,several effective single-end control structures for PSD with heat integration were explored via dynamics simulation.Two control structures of composition/temperature cascade and a pressure-compensated temperature showed better performances for the PSD with heat integration to maintain the product purities.However,PSD with full heat integration performed the poor controllability despite of a little bit of economy.These findings can provide guidance for the similar industrial process with heat integration.
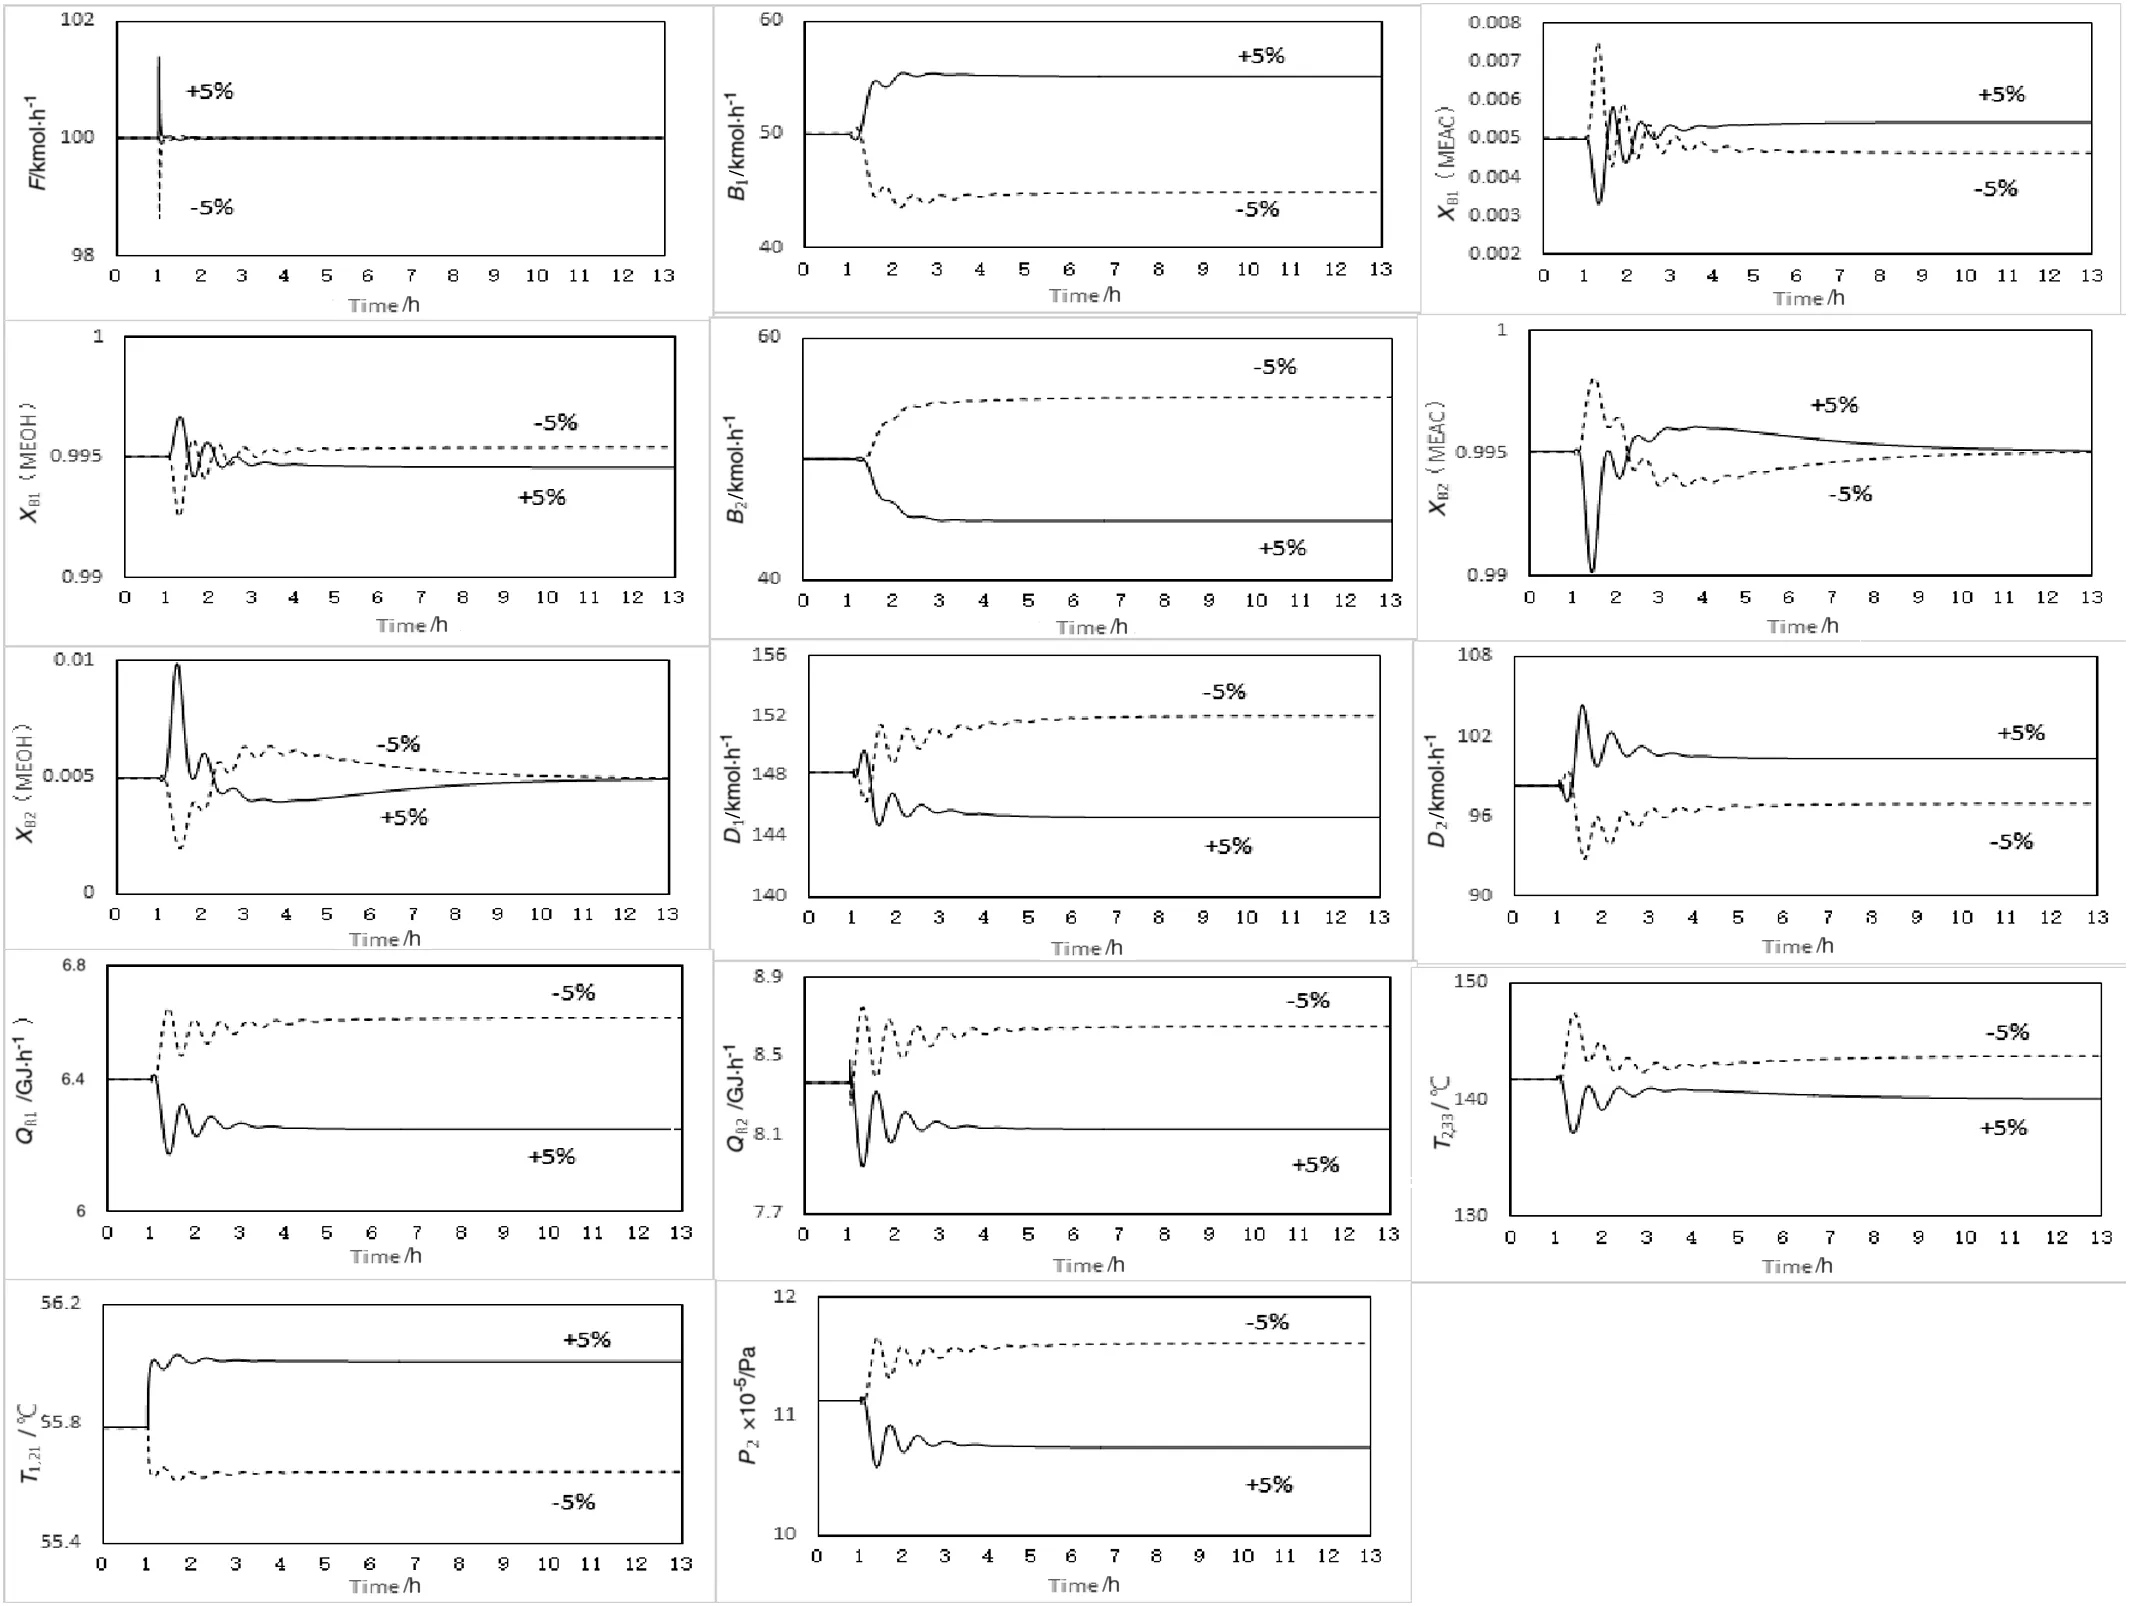
Fig.23.Dynamic responses to±5 mol%disturbance in feed composition.
[1]H.D.Zheng,L.D.Xie,L.Y.Cai,D.Wu,S.Y.Zhao,Recovery of PVA by-product methylacetate via reactive and extractive distillation,Chem.Eng.Process.95(2015)214–221.
[2]M.F.Doherty,M.F.Malone,Conceptual design of distillation systems,McGraw-Hill,New York,2001 383.
[3]E.Hosgor,T.Kucuk,N.I.Oksal,B.D.Kaymak,Design and control of distillation processes for methanol–chloroform separation,Comput.Chem.Eng.67(2014)166–177.
[4]W.L.Luyben,Pressure-swing distillation for minimum-and maximum-boiling homogeneous azeotropes,Ind.Eng.Chem.Res.51(2012)10881–10886.
[5]W.L.Luyben,Control of a multiunit heterogeneous azetropic distillation process,AIChE J.52(2)(2006)623–637.
[6]H.M.Wei,F.Wang,J.L.Zhang,B.Liao,N.Zhao,F.Xiao,W.Wei,Y.H.Sun,Design and control separation of dimethyl carbonate–methanol separation via pressure-swing distillation,Ind.Eng.Chem.Res.52(2013)11463–11478.
[7]W.L.Luyben,Comparison of extractive distillation and pressure-swing distillation for acetone–methanol separation,Ind.Eng.Chem.Res.47(2008)2696–2707.
[8]Z.Y.Zhu,L.L.Wang,Y.X.Ma,W.L.Wang,Y.L.Wang,Separating an azetropic mixture of toluene and ethanol via heat integration pressure swing distillation,Comput.Chem.Eng.76(2015)137–149.
[9]W.L.Luyben,Comparison of extractive distillation and pressure-swing distillation for acetone/chloroform separation,Comput.Chem.Eng.50(2013)1–7.
[10]W.L.Luyben,Design and control of a fully-heat integrated pressure-swing azeotropic distillation system,Ind.Eng.Chem.Res.47(2008)2681–2695.
[11]W.L.Luyben,Plantwide control of an isopropyl alcohol dehydration process,AIChE J.52(6)(2006)2290–2296.
[12]W.L.Luyben,Design and control of a methyl acetate processing carbonylation of dimethyl ether,Ind.Eng.Chem.Res.49(2010)12224–12241.
[13]K.Bandaru,K.J.Amiya,A hybrid heat integration scheme for bioethanol separation through pressure-distillation route,Sep.Purif.Technol.142(2015)307–315.
[14]S.J.Wang,D.S.H.Wong,Online switching ofentrainers for acetic acid dehydration by heterogeneous azetropic distillation,J.Process Control 23(2012)78–88.
[15]J.B.Yang,M.Q.Yu,Z.G.Zheng,T.Qiu,Simulation and optimization of heat-integrated pressure swing distillation for separation of methyl acetate and methanol,Chin.J.Process.Eng.13(1)(2013)105–110.
[16]X.G.Li,Modern distillation technology,Chemical Industry Press,119–120,2009.
[17]W.L.Luyben,Evaluation of criteria for selecting temperature control trays in distillation columns,J.Process Control 16(2006)115–134.
[18]W.L.Luyben,Distillation design and control using Aspen simulation,John Wiley&Sons,2006 131–132.
[19]W.L.Luyben,Distillation design and control using Aspen simulation,second ed.John Wiley&Sons,2013 128–129.
[20]W.L.Luyben,I.L.Chien,Design and control of distillation systems for separating azeotropes,John Wiley&Sons,2011 188–189.
 Chinese Journal of Chemical Engineering2016年11期
- Chinese Journal of Chemical Engineering的其它文章
- COSMO-RS:An ionic liquid prescreening tool for gas hydrate mitigation☆
- Effects of porous oxide layer on performance of Pd-based monolithic catalysts for 2-ethylanthraquinone hydrogenation☆
- Synthesis,characteristics of hierarchical EU-1 zeolite for xylene isomerization probe reaction☆
- Solving chemical dynamic optimization problems with ranking-based differential evolution algorithms☆
- An analysis of an ethanol-based,whole-crop refinery system in China☆
- Simultaneous hybrid modeling of a nosiheptide fermentation process using particle swarm optimization☆