
Experimental study of ice accretion effects on aerodynamic performance of an NACA 23012 airfoil
2016-11-23 06:10SohrabGholamhoseinPouryoussefMasoudMirzaeiMohammadMahdiNazemiMojtabaFouladiAlirezaDoostmahmoudi
CHINESE JOURNAL OF AERONAUTICS 2016年3期
Sohrab Gholamhosein Pouryoussef i,Masoud Mirzaei,Mohammad-Mahdi Nazemi,Mojtaba Fouladi,Alireza Doostmahmoudi
Department of Aerospace Engineering,K.N.Toosi University of Technology,P.O.Box 16765-3381,Tehran,Iran
Experimental study of ice accretion effects on aerodynamic performance of an NACA 23012 airfoil
Sohrab Gholamhosein Pouryoussef i*,Masoud Mirzaei,Mohammad-Mahdi Nazemi,Mojtaba Fouladi,Alireza Doostmahmoudi
Department of Aerospace Engineering,K.N.Toosi University of Technology,P.O.Box 16765-3381,Tehran,Iran
In this paper,the effects of icing on an NACA 23012 airfoil have been studied.Experiments were applied on the clean airfoil,run back ice,horn ice,and span wise ridge ice at a Reynolds number of 0.6X10⁶over angles of attack from-8°to 20°,and then results are compared.Generally,it is found that ice accretion on the airfoil can contribute to formation of a flow separation bubble on the upper surface downstream from the leading edge.In addition,it is made clear that span wise ridge ice provides the greatest negative effect on the aerodynamic performance of the airfoil.In this case,the stall angle drops about 10°and the maximum lift coefficient reduces about 50%which is hazardous for an airplane.While horn ice leads to a stall angle drop of about 4°and a maximum lift coefficient reduction to 21%,run back ice has the least effect on the flow pattern around the airfoil and the aerodynamic coefficients so as the stall angle decreases 2°and the maximum lift reduces about 8%.
1.Introduction
Nowadays,the cold weather condition is considered a critical factor in design,analysis,and performance tests of airplanewings.1Only from 1990 to 2005,there have been 240 reports of aviation accidents due to icing,and most of them included icing on aircraft wings.2Typically,icing is among the most serious hazards for various aircraft.Presence of tiny pieces of ice or supercooled liquid water in the clouds,which remain liquid below zero degree,is the source of icing during a flight.These drops may immediately or with a short delay change into ice on surfaces having no anti-icing or deicing system.Icing may begin at temperatures near 0°C or it might be delayed up to-40°C.3This phenomenon usually takes place at heights of 22000 feet and beyond where there can be supercooled liquid water.2,4Whereas,according to some reports,in winter,icing is usually serious at heights between 7000 and 9000 feet above the sea level and it rarely occurs above 20000 feet.3On the whole,aircraft icing is known as a situation in which supercooled liquid water turns into ice on wings,airframes,engines,rotors,etc.,that in turn disturbs the airflow.According to the Federal Aviation Agency,icing occurs when there is observable humidity in the air and surface temperature drops below the freezing point.It is worth to note that the icing level,rate,and form depend on factors such as liquid water content,drop size,airplane surface temperature,velocity,icing duration,surface roughness,etc.In addition,the types of cloud and airplane,flight conditions,as well as antiicing systems performance affect the icing phenomenon.3
In recent years,there have been a number of incidents due to icing which have led to several simulations conducted for numerical and experimental research to find out about the icing concept on an airplane.So is today;a great deal of research is carried out to have a better understanding of icing on an airplane in order to design better deicing equipment.5On the basis of various geometrical shapes of ice,it can be classified into 5 different groups:(1)roughness ice,(2)horn ice,(3)streamwise ice,(4)spanwise ridge ice,and(5)run back ice.6Anti-icing systems usually employ heat to prevent supercooled liquid water from icing.These systems are typically installed on the wing leading edge where water drops tend to strike a wing.Although the use of such systems can stop the leading edge from freezing,a little water may turn into ice downstream from the leading edge(in the back of the anti-icing system)that usually forms run back ice or span wise ridge ice.Furthermore,if for any reason,the anti-icing system fails,drops that strike the leading edge may change into ice;this process may lead to formation of horn ice on the leading edge.6,7
Since airplane efficiency and flight safety reduce under icing conditions,it is of extreme importance to have a thorough understanding of flow field physics around an iced airfoil and a prediction of aerodynamic behaviors of the wing.In a variety of research,3,7–10it is found that icing mostly occurs around the leading edge and the geometrical shape of the ice on the airfoil surface provides a backward-facing step(BFS)flow pattern.In other words,ice accretion can lead to formation of a laminar separation bubble downstream from the leading edge of the iced airfoil(Fig.1).7
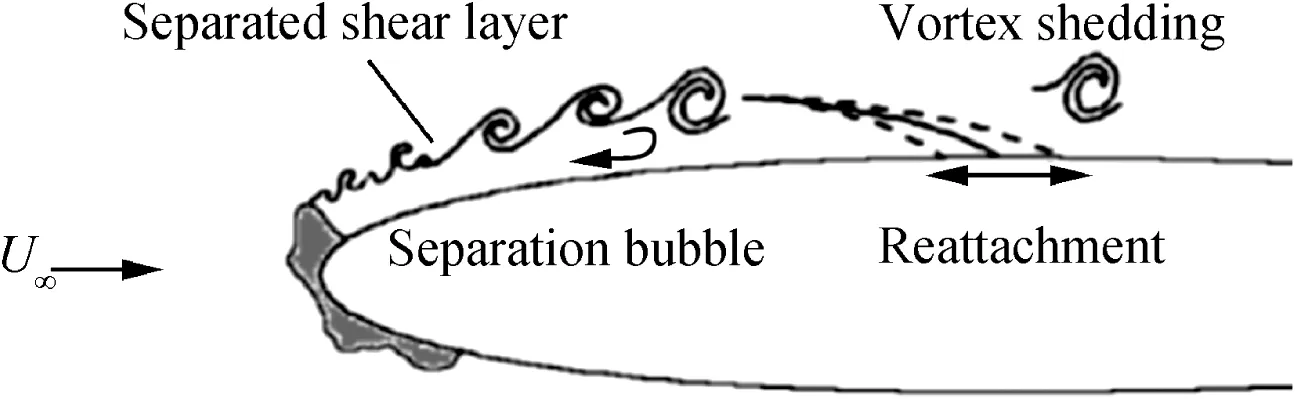
Fig.1 Schematic of formation of leading edge separation bubble on the iced airfoil.7
Roberts8and Bragg et al.10explained the flow around an iced airfoil as follows.A transitional or laminar flow separates from the ice tip due to severe reverse pressure gradient.Subsequently,between its high-speed upper flow and low-speed lower flow,an unstable and unsteady shear layer called separated shear layer is formed which finally leads to the formation,growth,and alternate vortex shedding.In fact,vorticity first rolls up in the shear layer and leads to formation of vortices.Then,adjacent vortices roll up in the separated shear layer,pair and merge,as moving downstream,to form larger vortices(having coherent structure).Following the flow separation(at point S),a region with relatively constant pressure(suction area)is created which delays the pressure recovery(flow recovery)until the flow regime changes to turbulent flow(i.e.,at about point T)(see Fig.2).Vortex motion within the separated shear layer makes the high-momentum upper flow(out of the separation bubble)merge(mixing phenomenon)with the low-speed lower flow(inside the separation bubble).Generally,this mixing phenomenon is concurrent and coupled with the shear layer transition process at low angles of attack and contributes to the pressure recovery through energizing the separated shear layer.As a result,the flow reattaches to the airfoil surface(at point R).This reattachment point is unstable and unsteady(Fig.1).The distance between point S and point R is known as the separation bubble length.Meanwhile,due to a pressure gradient increase on top of the airfoil(the suction side)at high angles of attack,the pressure recovery process(flow recovery)cannot be implemented properly,preventing the separated shear layer from attaching to the airfoil surface.This process is the cause for the early stall state and reduction in the stall angle of the iced airfoil.
Over the past years,there have been many researches on studying icing effects on various airfoils.Lee and Bragg11based their research in 1999 on an iced NACA 23012 airfoil at a Reynolds number of 1.8X10.6They found that when ice was formed at certain points of the airfoil,a long separation bubble was formed downstream from the ice.Furthermore,they reported a noticeable decrease in the maximum lift coefficient and a remarkable change in the drag coefficient due to ice displacement.Miller et al.12and Addy13investigated formation of span wise ridge ice based on performance of antiicing systems.In 2009,Mirzaei et al.14studied the characteristics of the flow field around an NLF-0414 iced airfoil in 2009 and reported variations in bubble length versus angle of attack.In 2010,effects of run back icing on an NACA 23012 airfoil were studied by Broeren et al.6Three years later,Diebold et al.15identified iced swept-wing aerodynamics and classified ice shapes into 4 major groups,namely,roughness ice,horn ice,spanwise ridge ice,and streamwise ice.Lately,Ansell and Bragg16conducted research on characteristics of the flow field around a horn iced airfoil NACA 0012 which came up with identification of low-frequency mode of iceinduced oscillations.They also introduced the relation between unsteady shear layer reattachment location and unsteady airfoil pressure distribution.

Fig.2 Analysis of airflow and pressure distribution for a laminar separation bubble of leading edge on iced airfoil.8
As previously mentioned,in spite of improvement of antiicing and deicing systems on newly designed airplanes,accidents caused by icing in recent years highlight the necessity of study on this phenomenon.In this research,the impacts of ice accretion on flow pattern and aerodynamic coefficients of an NACA 23012 airfoil at a Reynolds number of 0.6X10⁶over different angles of attack have been experimentally studied using pressure distribution analysis around the iced airfoil.To that end,by comparing the various geometries of iced airfoils including horn ice,spanwise ridge and run back ice,for the first time,the mechanism of icing effect on the aerodynamic performances of the airfoils has been categorized and clarified in two main groups:(1)local effect and(2)basic effect,and the characteristics of each one have been described.
2.Experimental details
The experiments were conducted in a low-speed,open-circuit wind tunnel in the aerospace engineering department at K.N.Toosi University of Technology.The wind tunnel includes a closed-wall rectangular test-section which is 1.2 m wide,1 m high,and 3 m long(see Fig.3).Under uniform flow conditions,the longitudinal free-stream turbulence intensity was less than 0.15%,and the velocity non-uniformity across the testsection was±0.5%.In addition,with respect to the testsection dimensions,airfoils' model size,and tests' angles of attack,the maximum blockage ratio was about 8%.
The geometries of the iced airfoils including the horn ice(EG1164),spanwise ridge ice(EG1159),and run back ice(NG0671)fabricated for this study were taken from Ref.6 in which ice geometries were identified according to tests done at NASA Icing Research Tunnel(IRT)under various conditions such as temperature,speed,droplet size,and icing duration(see Fig.4).Table 1 presents the conditions in which these three types of ice were formed.

Fig.3 Wind tunnel used in the present study.
The airfoil chord and span lengths were 35.4 cm and 75 cm,respectively,and the airfoils were made of plexiglass(aspect ratios of models were approximately 2).Firstly,the models surfaces were finished(smoothed),followed by painting and polishing in order to reach a surface roughness of 0.5 μm.Furthermore,as Fig.5 shows,in order to measure pressure on the surface of the airfoils,18 pressure taps on the upper surface and 10 pressure taps on the lower surface,each with a diameter of 0.6 mm,were made around the airfoil midspan(in zigzag arrangement).As Fig.6 shows,more pressure taps have been considered on the upper surface of the airfoils in order to conduct a closer study on the flow separation on this surface.
In order to measure the pressure distribution on the airfoil surface,a pressure measurement system including Honeywell DC005NDC4 pressure transducers,a National Instruments 32 channel 16 bit A/D PCI-6224 electronic board,LabVIEW software,F.F.S(Farasanjesh(pressure field data-processing application,and a personal computer was used.To measure the average pressure factor,the duration of each pressure recording was chosen as 20 s,and a sampling rate of 1000 Hz was utilized.In addition,to calculate the average aerodynamic coefficients,a pressure distribution method was employed.According to the accuracy of the measurement system and the conditions set for the tests,the uncertainties of the measurements of the pressure,lift,drag,and moment coefficients were estimated at Cp±0.01,CL±0.002,CD±0.002,and Cm,LE±0.001,respectively.In this study,the pressure coefficient(Cp),lift coefficient(CL),drag coefficient(CD)and leading edge pitching moment coefficient(Cm,LE)have been determined as follows:where p is the mean static pressure on the airfoils surface,p∞the free-stream static pressure,L the lift force,D the drag force(pressure drag),m the leading edge pitching moment,ρ the air density,V∞the free-stream velocity,and c the chord length of the airfoils.
In this study,three different icing geometries including span wise ridge ice,horn ice,and run back ice were tested at a Mach number of 0.075 and a Reynolds number of 0.6X10⁶based on the length of the airfoil chord and the free stream velocity(25 m/s).The results were compared with those of the clean airfoils.Noteworthy is that during the experiments,the conditions of the reference flow were continuously measured and monitored by means of a Pitot-static tube and a high-resolution digital micromanometer(Testo 0560-5126).In addition,experiments were conducted at 15 different angles of attack from-8°to+20°(with a 2 degree angular pitch).
3.Results of the pressure distribution and discussions
3.1.Clean airfoil
Fig.7 shows that as the angle of attack increases from-8°to-2°on the clean airfoil,the pressure coefficient on the upper surface gradually decreases and the pressure coefficient on the lower surface increases at the same time.Fig.8 shows that by entering into positive values of the angle of attack,the curves of the upper surface pressure touch a peak point indicative of suction downstream from the airfoil's leading edge which increases as the angle of attack increases.Meanwhile,unlike the upper surface,the pressure coefficients of the airfoil's lower surface increase with an increase in the angle of attack.On the other hand,it is clear from Fig.8 that the pressure coefficient of the first pressure tap on the airfoil's leading edge(x/c=0)is nearly equal to the pressure coefficient of the stagnation point,that is,Cp=1,confirming that the experiments have been done correctly.In addition,comparing the pressure distributions on the upper and lower surfaces of the airfoil,shown in Figs.7 and 8,it can be found that as the angle of attack becomes positive,the pressure and suction sides of the airfoil will be switched.It is evident from Fig.9 that as the angle of attack increases up to 10°,suction keeps increasing on the leading edge of the upper surface of the airfoil and the pressure curve peak position approaches to the leading edge.In addition,as the angle of attack increases,the position of the stagnation point in front of the airfoil on Cp=1 over the leading edge at a 0°angle of attack is displaced a little downstream from the airfoil on the lower surface,so that at a 10°angle of attack,the stagnation point is positioned at x/c≈0.02 on the lower surface.

Fig.4 Schematic of NACA 23012 iced airfoils.6
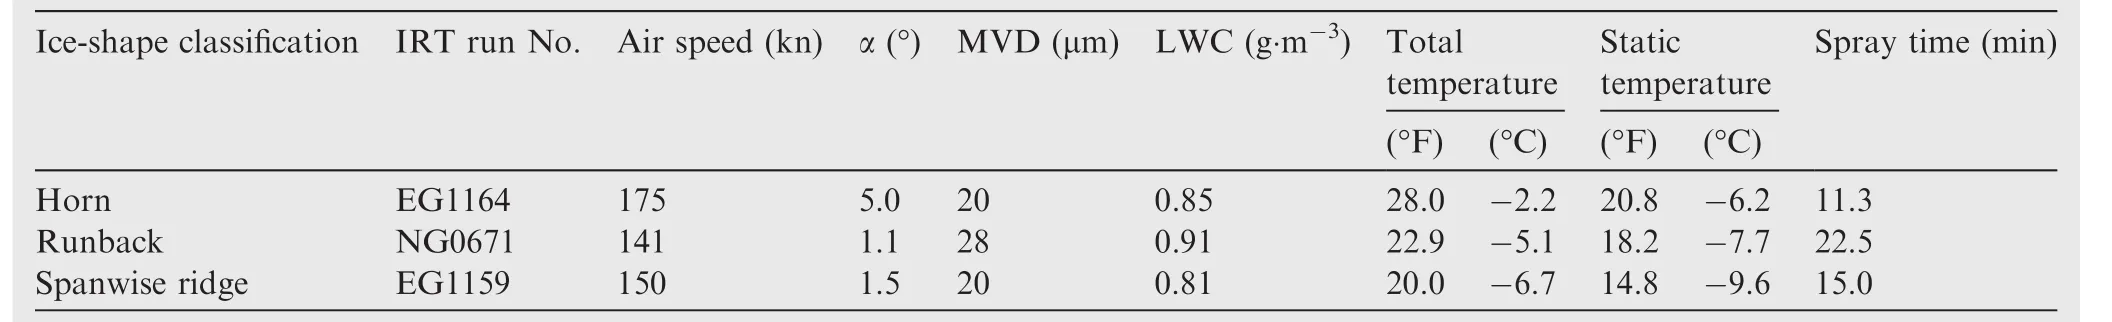
Table 1 Conditions of ice accretion on airfoil NACA 23012.6

Fig.5 Views of airfoil model and pressure taps locations.

Fig.6 Coordinates of pressure taps on NACA 23012 clean airfoil.

Fig.7 Pressure coefficient in terms of x/c at angles of attack-8°,-4°,and-2°for the NACA 23012 clean airfoil.

Fig.8 Pressure coefficient in terms of x/c at angles of attack 0°,2°,and 4°for the NACA 23012 clean airfoil.

Fig.9 Pressure coefficient in terms of x/c at angles of attack 6°,8°,and 10°for the NACA 23012 clean airfoil.
According to Fig.10,as the angle of attack increases up to 16°,suction keeps increasing continuously on the leading edge of the upper surface so that the minimum pressure coefficient reaches Cp=-3.19 and Cp=-3.56 on 12°and 16°angles of attack,respectively.Furthermore,one can see that as the angle of attack increases,the stream stagnation point in front of the airfoil keeps moving away from the leading edge on the lower surface;as a result,at a 16°angle of attack,the stagnation point is positioned at x/c≈0.06.While at an 18°angle of attack,the flow pattern around the airfoil undergoes a fundamental change and the airfoil stalls;as a result,the stagnation point returns to x/c≈0.02 on the lower surface.On the other hand,having closer attention to the diagrams of the pressure coefficient of the upper surface around the trailing edge(in Fig.10),one can see that at a 12°angle of attack,by moving from the leading edge to the trailing edge,the pressure coefficient increases gently but continuously and a perfect pressure recovery is done.Hence,it can be concluded that at this angle of attack,the flow nearly touches the upper surface of the airfoil and that a noticeable separation does not occur.However,at a 16°angle of attack,the reverse pressure gradient increases flow separation around x/c≈0.8 from the upper surface and the airfoil surface pressure coefficient remains almost constant over the separation region.Meanwhile,at an 18°angle of attack,the pressure distribution has a dramatic change compared to previous angles due to the severe reverse pressure gradient;by flow separation from the airfoil surface near the leading edge(around x/c≈0.1),the pressure coefficient on the upper surface has almost become constant Cp=-0.65 which indicates that the airfoil may have stalled.It is found from Fig.10 that at stall angles and beyond,the peak of the pressure curve(suction at the leading edge)on the upper surface of the airfoil drops sharply due to a fundamental change in the flow pattern during the stall(i.e.,flow separation from the leading edge).

Fig.10 Pressure coefficient in terms of x/c at angles of attack 12°,16°,and 18°for the NACA 23012 clean airfoil.
3.2.Horn iced airfoil
The horn iced airfoil due to having horns on the leading edge has completely different pressure distribution diagrams compared to the clean airfoil.As Fig.11 shows,at-8°to-4°angles of attack,the pressure distribution on the upper surface is nearly similar to that of the clean airfoil(Fig.7);however as the angle of attack increases,the effects of horn ice become evident.Meanwhile,at a-8°angle of attack,the pressure distribution on the lower surface is completely different from that of the clean airfoil.This difference is due to the effects of the horn ice accretion over the leading edge of the airfoil(Fig.4)on the flow field downstream from the ice.In this case,there is a constant pressure coefficient(Cp≈-1.08)from about x/c≈0.04 to x/c≈0.21.This constant-pressure region is indicative of a small separation bubble which is formed on the lower surface of the airfoil behind the horn ice and gets smaller and smaller as the angle of attack increases(up to-4°).

Fig.11 Pressure coefficient in terms of x/c at angles of attack-8°,-6°,and-4°for the NACA 23012 horn iced airfoil.

Fig.12 Pressure coefficient in terms of x/c at angles of attack 0°,2°,and 4°for the NACA 23012 horn iced airfoil.
Fig.12 shows that similar to the clean airfoil,for the horn iced airfoil,by increasing the angle of attack and entering into positive values,the pressure and suction sides switch,i.e.,the lower surface turns to the pressure side and the upper surface turns to the suction side.As Fig.12 shows,when the angle of attack increases more than 2°,the effect of the horn ice accretion on the flow pattern of the lower surface becomes negligible;subsequently,the pressure distribution on the lower surface of the horn iced airfoil becomes almost similar to that of the clean airfoil.Whereas,due to the reverse pressure gradient,a relatively small separation bubble generates behind the tip of the horn ice on the upper surface of the iced airfoil that causes a pressure coefficient reduction on the leading edge of the upper surface of the airfoil(see Fig.12).In addition,as seen in Fig.13,by an increase of the angle of attack and subsequently an increase in the reverse pressure gradient,the suction in the ice separation bubble increases and the length of the bubble also increases gradually,so that at a 10°angle of attack,a constant-pressure region downstream from the leading edge on the upper surface appears which is indicative of the ice separation bubble length.

Fig.13 Pressure coefficient in terms of x/c at angles of attack 6°,8°,and 10°for the NACA 23012 horn iced airfoil.

Fig.14 Pressure coefficient in terms of x/c at angles of attack 12°,14°,and 16°for the NACA 23012 iced horn airfoil.
Fig.14 shows that at a 12°angle of attack,due to the increased reverse pressure gradient,the flow separates from the upper surface of the airfoil around x/c≈0.87,and a relatively small separation region is formed near the trailing edge.Yet,majority of the upper surface of the airfoil has a nearly constant and gentle pressure gradient over which flow recovery is slowly under proceeding.In fact,under such circumstances,the ice separation bubble is in a state between reattachment of the flow to the airfoil surface(complete recovery)and complete separation from the ice tip(failure to recover flow).On the other hand,as the angle of attack is increased and the reverse pressure gradient on the upper surface of the airfoil is intensified,an almost constant pressure distribution can be observed from around x/c≈ 0.07 at a 14°angle of attack and also from the leading edge(ice tip)at a 16°angle of attack to the end of the trailing edge.Hence,it can be concluded that at these angles,the iced airfoil is stalled.
3.3.Spanwise ridge iced airfoil

Fig.15 Pressure coefficient in terms of x/c at angles of attack-8°,-6°,and-4°for the NACA 23012 span wise ridge iced airfoil.
There are generally two flow bubbles around a span wise ridge iced airfoil:(1)a small flow bubble in front of the ice accumulation whose flow pattern is similar to that of forward-facing step flow,and(2)a separation bubble behind the ice accumulation whose flow pattern is similar to that of backward-facing step flow.7,17As it is obvious in Fig.15,at negative angles of attack,both flow bubbles around the ice accumulation affect the pressure distribution on the upper surface of the airfoil,but the effect of the rear separation bubble(downstream)is more significant because by increasing the angle of attack,the length of this bubble is slightly larger.It should be noted about the span wise ridge ice that unlike the horn ice,the effect of icing on the pressure distribution over the upper surface of the airfoil is also noticeable at negative angles of attack.Fig.16 shows that at positive angles of attack,the separation bubble length keeps increasing while the angle of attack increases.In addition,as the angle of attack increases,the pressure coefficient increases on the lower surface.While roughness resulting from limited ice accretion on the lower surface of the airfoil around x/c≈0.11(Fig.4)has no significant effect on the flow pattern,it has negligibly changed the pressure distribution on the lower surface compared to that of the clean airfoil(Fig.7).
According to Fig.17,as the angle of attack increases at 6°and 8°,the separation bubble length(constant-pressure region)keeps increasing downstream from the ice accumulation.Meanwhile,the pressure coefficient within the bubble region increases from Cp≈-1.2 to Cp≈-0.9,simultaneously.Furthermore,at a 10°angle of attack,the flow separated from the ice tip will not reattach to the airfoil surface due to an increased reverse pressure gradient on the upper surface.In other words,the flow fails to recover(pressure recovery is not done).As Fig.18 shows,at angles of attack beyond 10°,due to the fact that the flow pattern has approximately become identical,significant variation is not observed in the pressure distribution diagrams of the upper surface with the exception that as the angle of attack increases,suction increases a little on the leading edge of the airfoil.This case is true for the pressure distribution over the lower surface of the airfoil;the difference is that when the angle of attack increases,the pressure on the lower surface increases a little.In addition,it can be seen that at a 20°angle of attack,the flow separation point is transferred from the ice tip toward the leading edge due to intensification of the reverse pressure gradient on the upper surface.On the other hand,since the flow separation region is large in length,it can be certainly said that at a 10°angles of attack and beyond,the iced airfoil stalls(Figs.17 and 18).Albeit,when the CL-α graph is examined,it becomes clear that a state of stall has occurred a little earlier.
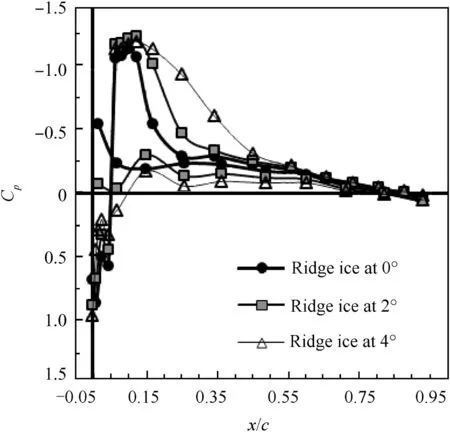
Fig.16 Pressure coefficient in terms of x/c at angles of attack 0°,2°,and 4°for the NACA 23012 span wise ridge iced airfoil.

Fig.17 Pressure coefficient in terms of x/c at angles of attack 6°,8°,and 10°for the NACA 23012 span wise ridge iced airfoil.

Fig.18 Pressure coefficient in terms of x/c at angles of attack 12°,14°,and 20°for the NACA 23012 span wise ridge iced airfoil.
3.4.run back iced airfoil
The pressure distribution on the surface of the run back iced airfoil is shown at 5 different angles of attack from 10°to 18°in Figs.19–23,respectively.Then the results are compared with those of the clean airfoil.Generally,the comparison of the pressure distributions of the run back iced airfoil and the clean airfoil indicates that the run back ice accretion at 10°to 14°angles of attack locally affects the pressure distribution on the upper surface of the airfoil.In fact,at these angles,a relatively small flow separation bubble is formed downstream from the ice accumulation which makes the pressure curve experience a local oscillation around the ice accumulation.Firstly,the pressure coefficient increases a little upstream from the ice accumulation because the flow in front of the ice accumulation behaves similarly to a forward-facing step flow.On the other hand,downstream from the ice accumulation,the pressure coefficient reduces locally due to the presence of a separation bubble.Noteworthy is that the flow pattern behind the ice accumulation is similar to a backward-facing step flow and that as the flow distances from ice accumulation and moves toward the trailing edge of the airfoil,the icing effect on the pressure distribution fades.

Fig.19 Pressure coefficient in terms of x/c at a 10°angle of attack for the NACA 23012 run back iced and clean airfoils.
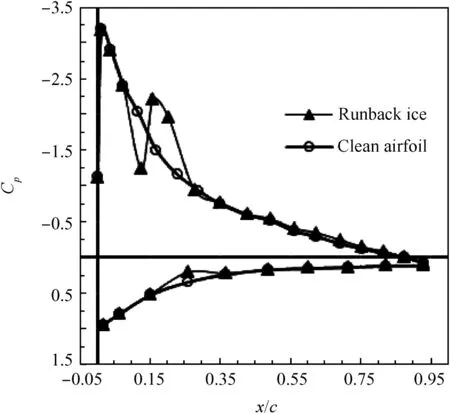
Fig.20 Pressure coefficient in terms of x/c at a 12°angle of attack for the NACA 23012 run back iced and clean airfoils.
It should be noted that as the angle of attack increases,the amount of suction increases on the upper surface of the airfoil leading to a gradual(little)increase in the separation bubble length so that at a 14°angle of attack,there appears a relatively small constant-pressure region indicative of the approximate size of the separation bubble length(see Fig.21).Meanwhile,besides the icing separation bubble,the flow separates again near the trailing edge of the airfoil(around x/c≈0.8)at a 14°angle of attack due to an increased reverse pressure gradient.Fig.22 shows a fundamental change in the pressure distribution on the upper surface and also in the flow pattern around the iced airfoil at a 16°angle of attack compared to that of the clean airfoil.In fact,the flow separated from the ice accumulation(around x/c≈0.15)is not recovered and will not reattach to the airfoil surface which indicates the run back iced airfoil has stalled.

Fig.21 Pressure coefficient in terms of x/c at a 14°angle of attack for the NACA 23012 run back iced and clean airfoils.

Fig.22 Pressure coefficient in terms of x/c at a 16°angle of attack for the NACA 23012 run back iced and clean airfoils.

Fig.23 Pressure coefficient in terms of x/c at an 18°angle of attack for the NACA 23012 run back iced and clean airfoils.
In addition,as Fig.23 shows at an 18°angle of attack,due to a strong reverse pressure gradient,the flow separates from the surfaces of both airfoils immediately downstream from the leading edge prior to reaching the ice accumulation(around x/c≈0.07).This causes the pressure distribution and the flow pattern to be similar for both the iced and clean airfoils.
4.Discussion about the behaviors of aerodynamic coefficients
Fig.24 shows the variations of lift coefficients in terms of angle of attack for 4 different airfoil states.It is clear from this figure that the clean airfoil has the largest stall angle and the span wise ridge iced airfoil has the smallest stall angle.The stall angles for the clean,run back ice,horn ice,and span wise iced ridge airfoils are almost 16°,14°,12°,and 6°,respectively.Noteworthy is the extreme reduction of CLmaxand αstallin the span wise ridge iced airfoil that leads to a sensible reduction in the aerodynamic performance of the airfoil.Whereas,the run back iced airfoil in comparison to the clean airfoil having a 2°reduction in the stall angle has the least adverse(negative)effect on the lift coefficient behavior of the airfoil.
Generally,it is rather difficult and unreliable to determine the stall angles of the airfoils,particularly the iced airfoils,from the curves of the pressure distribution.It should be noted that by means of pressure distribution curves,it is possible to determine if stall(stall and post-stall)has occurred,but it isn't possible to find out the exact angle at which the stall has happened.To specify the exact stall angle,an airfoil's lift coefficient variation chart in terms of angle of attack shall be used.Discontinuity of the angles measured in the experiments,plus the complex behavior of the flow around the iced airfoils(particularly horn ice and span wise ridge ice)at angles of attack close to stall can be considered among the factors that add to the problem of determining the exact angle at which stall has started.For example,the pressure distribution chart cannot be consulted for determining the stall region in the span wise ridge iced airfoil whose stall angle,according to the CL-α graph,is approximately 6°(see Fig.24).Meanwhile,the pressure distribution on the upper surface of the airfoil does not show any constant pressure up to the trailing edge even at 8°(see Fig.17).Generally,this issue(complex behavior)can be stemmed from early mixing of the trailing edge separation region with the separation bubble downstream from the ice,and also at higher angles(post-stall)and the transition of the flow separation point(separation region)from the ice tip toward the leading edge of the airfoil that creates an unrespectable behavior for the lift coefficient in the span wise ridge icing.The lift coefficient chart in Fig.24 clearly shows that the type and state of the flow separation in this airfoil(lack of a specific peak around the stall angle and gentle variations in the lift coefficient at post-stall angles)are different from those of other airfoils.
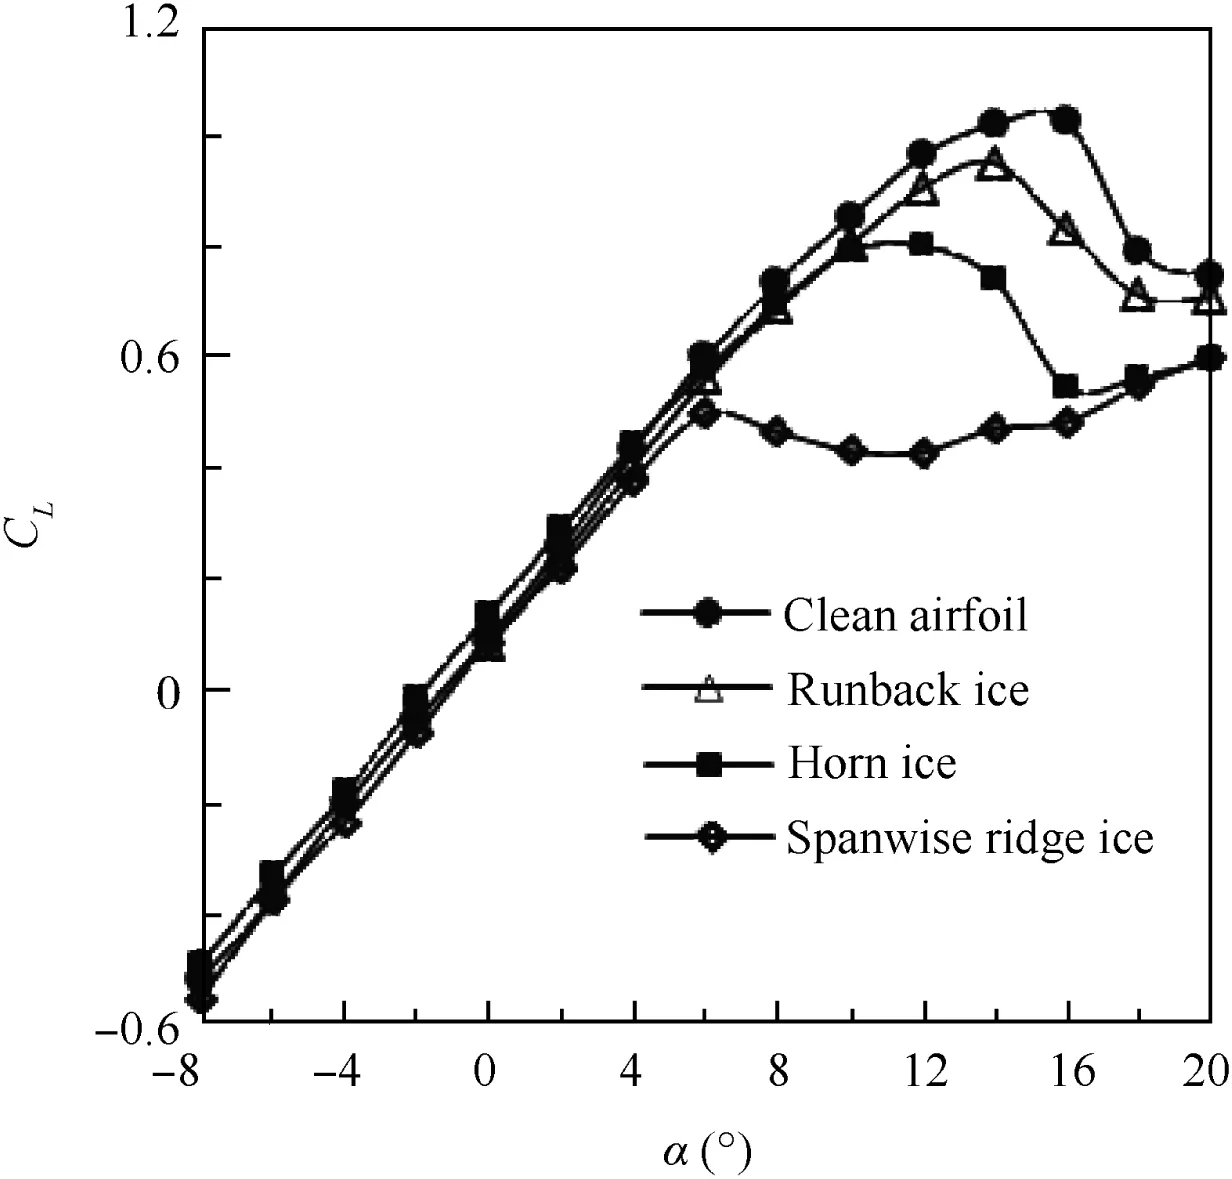
Fig.24 Lift coefficient variations in terms of angle of attack for NACA 23012 airfoil.
Fig.25 shows drag coefficient variations in terms of angle of attack.It can be seen that when airfoils stall, the drag coefficients in all 4 types of airfoils are affected and experience a sensible rise.Besides,at a 0°angle of attack,the drag coefficient(pressure drag)is negligible for the clean airfoil.At a-8°angle of attack,the horn iced airfoil creates greater drag compared to other types of airfoils and its drag coefficient is two times that of the clean airfoil.However,at a-6°angle of attack,the drag coefficients of all types of airfoils are nearly identical.In addition,from 0°to 6°angles of attack,the drag coefficients of the run back iced and horn iced airfoils are nearly identical.At positive angles of attack below 12°, the span wise ridge iced airfoil has the greatest drag followed by the horn iced,run back iced,and clean airfoils in turn.While at angles of attack above 12°,due to stall effects,the drag coefficients of the horn iced and span wise ridge iced airfoils are nearly identical.Furthermore,at a 16°angle of attack,due to stalling,the drag coefficient of the run back iced airfoil is two times that of the clean airfoil.On the other hand,since the flow pattern around airfoils becomes identical due to flow separation at the leading edge,at angles of attack above 18°,the icing effect on the drag coefficient is negligible and the drag coefficients for all the iced and clean airfoils become nearly identical.
Fig.26 shows variations of pitching moment coefficient around the leading edge in terms of angle of attack for different states of the airfoil;it can be seen that unlike lift and drag coefficients behaviors,the effects of the airfoil icing on the moment coefficient are rather little.Generally,as the angle of attack increases,the moment coefficients of all the iced and clean airfoils decrease.The little oscillation and difference between iced airfoils moment coefficients at high angles of attack(above 16°)are probably due to the complex behavior of the flow around the iced airfoils(particularly horn ice and span wise ridge ice)at angles of attack close to stall and post stall.

Fig.25 Drag coefficient variations in terms of angle of attack for NACA 23012 airfoil.

Fig.26 Variations of pitching moment coefficient around leading edge in terms of angle of attack for NACA 23012 airfoil.
Comparing the behavior of the flow pattern and the aerodynamic coefficients of the three iced airfoils with those of the clean airfoil,it can be concluded that the icing phenomenon affects the aerodynamic performance of the airfoil in two modes.In the first mode,which occurs at low angles of attack(before the stall condition),the effect is local.In this case,ice accretion on the airfoil contributes to formation of a flow separation bubble behind the ice accumulation downstream from the leading edge on the upper surface of the airfoil.Furthermore,the drag coefficient(form drag)of the airfoil increases while the coefficients of lift and moment remain almost intact.It should be noted that as the angle of attack increases in this mode,the separation bubble length and the following effects of icing on the airfoil increase.Nevertheless,the main effect of icing relates to the second mode which occurs at angles of attack close to stall and post-stall angles.In this case,the flow pattern around the airfoil as well as the aerodynamic coefficients undergoes a fundamental change leading to an iced airfoil with reduced aerodynamic performance which is hazardous for flight safety.Having studied physics of the flow around the iced airfoil,it can be said that the basic effect of icing(second mode)occurs when flow recovery(pressure recovery)is not done on the upper surface,due to an increase in the reverse pressure gradient at high angles of attack,and the separated flow from the ice accumulation tip will not reattach to the airfoil surface.On the other hand,in this case,there is neither a separation bubble on the leading edge,nor a reattachment point downstream from the ice accumulation.It is notable that the beginning of this phenomenon(second mode)is usually concurrent with the sudden transition of the flow separation point from around the airfoil trailing edge to the ice accumulation tip.In fact,the airfoil trailing edge separation mixes with the icing separation bubble simultaneously.As the iced airfoil reaches to the second mode,the drag coefficient increases abruptly,but the moment coefficient undergoes a little oscillation.In addition,sensible reductions in the stall angle and the maximum lift coefficient are among the effects of icing in this mode.
5.Conclusions
In this research,the effects of ice accretion on an NACA 23012 airfoil at a Reynolds number of 0.6X10⁶have been studied in a wind tunnel for horn,runback,and span wise ridge ice at different angles of attack.Generally,the icing phenomenon affects both the flow around the airfoil and the aerodynamic coefficients greatly and contributes to formation of a laminar separation bubble downstream from the leading edge on the upper surface of the airfoil.Reduced aerodynamic performances of the airfoil including sensible increase in the drag,decrease in the stalling angle,and remarkable reduction in the maximum lift coefficient are among the major effects of icing.run back ice,compared to other types of icing,has the least effect on the flow around the airfoil as well as the aerodynamic coefficients in such a way that the stalling angle and the maximum lift coefficient reduce 2°and 8%,respectively.However,at a 16°angle of attack,due to stalling,the drag coefficient of the run back iced airfoil is two times that of the clean one.On the other hand,the stalling angle and the maximum lift coefficient experience 10°and 50%reductions,respectively,when span wise ridge ice is considered which is hazardous for an airplane.Furthermore,for horn ice,the stalling angle and the maximum lift coefficient decrease about 4°and 21%,respectively.Besides,compared to the clean airfoil,horn ice increases the drag coefficient about 110%at highly negative angles of attack(-8°).Whereas,at positive angles of attack,the drag coefficient of the iced airfoil can increase up to 6.7 times compared to that of the clean airfoil at a 6°angle of attack and 3.5 times compared to that of the clean airfoil at a 12°angle of attack.Eventually,it is found that the ice accretion affects the aerodynamic performance of the airfoils in two modes:(1)local effect,and(2)basic effect.Moreover,it can be concluded that in comparison to horn ice,spanwise ridge ice has more negative effects on the aerodynamic performance.This can reflect the importance of reliable operation of anti-icing systems on the leading edge of a wing.In fact,unreliable operation of these systems can be more dangerous than their failure to operate,because as ice accretes behind these systems,span wise ridge ice is formed.
Finally,it is suggested that to get a better perception of the flow pattern as well as the characteristics of the separation bubble, flow visualization methods such as smoke visualization and/or PIV technique need to be used.In addition,the flow pattern around an iced airfoil could be examined by numerical simulations.On the other hand,it is suggested that the mechanism of icing effect on the aerodynamic performance of an airfoil,which is presented in this study,can be employed for other types of iced airfoils and its generalization be veri fied.
1.Venkataramani K,McVey L,Holm R,Montgomery K.Inclement weather considerations for aircraft engines,Report No.:AIAA-2007-0695.Reston:AIAA;2007.
2.Mason J,Strapp W,Chow P.The ice particle threat to engines in flight,Report No.:AIAA-2006-0206.Reston:AIAA;2007.
3.Bragg MB,Paraschivoiu I,Saeed F.Aircrafticing.New York:Wiley Interscience Publication;2002,p.12–40.
4.Ramezanizadeh M,Pouryoussefi SMH,Mirzaei M,Pouryoussefi SG.Experimental investigation on the ice accretion effects of airplane compressor cascade of stator blades on the aerodynamic coefficients.J Appl Fluid Mech 2013;6(2):167–75.
5.Potapczuk MG,Reinmann JJ.Icing simulation:A survey of computer and experimental facilities,Report No.:AGARD CP-496.NASA Lewis Research Center;1991.
6.Broeren AP,Whalen EA,Busch GT,Bragg MB.Aerodynamic simulation of run back ice accretion.J Aircraft 2010;47(3):924–39.
7.Bragg MB,Broeren AP,Blumenthal LA.Iced-airfoil aerodynamics.Prog Aerosp Sci 2005;41(5):323–62.
8.Roberts WB.Calculation of laminar separation bubbles and their effect on airfoil performance.AIAA J 1980;18(1):25–31.
9.Potapczuk MG,Bragg MB,Kwon OJ,Sankar LN.Simulation of iced wing aerodynamics.68th AGARD Fluid Dynamic Specialist Meeting;Toulouse,France;1991.
10.Bragg MB,Khodadoust A,Spring SA.Measurements in a leading-edge separation due to simulated airfoil ice accretion.AIAA J 1992;30(6):1462–7.
11.Lee S,Bragg MB.Experimental investigation of simulated large droplet ice shapes on airfoil aerodynamics.J Aircraft 1999;36(5):844–50.
12.Miller DR,Addy Jr HE,Ide RF.A study of large droplet ice accretion in the NASA-Lewis IRT at near-freezing conditions,Report No.:AIAA-1996-0934.Reston:AIAA;1996.
13.Addy Jr HE.Ice accretion and icing effects for modern airfoils,Report No.:NASA-TP-2000-210031.Cleveland,Ohio:NASA Glenn Research Center;2000.
14.Mirzaei M,Ardekani MA,Doosttalab M.Numerical and experimental study of flow field characteristics of an iced airfoil.Aerosp Sci Technol 2009;13(6):267–76.
15.Diebold JM,Broeren AP,Bragg MB.Aerodynamic classification of swept-wing ice accretion, Report No.: AIAA-2013-2825.Reston:AIAA;2013.
16.Ansell PJ,Bragg MB.Characterization of low-frequency oscillations in the flowfield about an iced airfoil.AIAA J 2014;53(3):629–37.
17.Pouryoussefi SG,Mirzaei M,Hajipour M.Experimental study of separation bubble control behind a backward-facing step using plasma actuators.Acta Mech 2015;226(4):1153–65.
Sohrab Gholamhosein Pouryoussefijoined K.N.Toosi University of Technology as a researcher in Aerospace Engineering after completion of his Ph.D.degree in 2015.He received his M.S.degree in Aerodynamics from K.N.Toosi University of Technology in 2009.His research interests include experimental aerodynamics,wind tunnel testing,aircraft icing effect,active flow control,and physics and application of plasma actuators.
Masoud Mirzaeireceived his M.S.degree in Energy Conversion from Amirkabir University of Technology in 1993.He got his Ph.D.degree from Tarbiat Modarres University in 2000.He is currently a professor and Ph.D.advisor at Aerospace Engineering Faculty of K.N.Toosi University of Technology.His main research interests are computational fluid dynamics in compressible flow,experimental aerodynamics,and active flow control.He is now the head of the Aerodynamics Laboratory at K.N.Toosi University of Technology.
Mohammad-Mahdi Nazemireceived his M.S.degree in Aerodynamics from K.N.Toosi University of Technology in 2015.His main research interests are experimental aerodynamics,wind tunnel testing,and aircraft icing effects.
Mojtaba Fouladireceived his B.Sc.degree in Aerospace Engineering from K.N.Toosi University of Technology in 2013.His main research interests are experimental aerodynamics,wind tunnel testing,and aircraft icing effects.
Alireza Doostmahmoudireceived his M.S.degree in Aerodynamics from K.N.Toosi University of Technology in 2010.His main research interests are aeronautics,experimental aerodynamics,wind tunnel testing,aircraft icing effects,and active flow control.
19 June 2015;revised 3 August 2015;accepted 28 September 2015
Available online 7 May 2016
Airfoil icing;
Aviation accidents;
Horn ice;
NACA 23012 airfoil;
run back ice;
Separation bobble;
Spanwise ridge ice
?2016 Chinese Society of Aeronautics and Astronautics.Production and hosting by Elsevier Ltd.This is an open access article under the CC BY-NC-ND license(http://creativecommons.org/licenses/by-nc-nd/4.0/).
*Corresponding author.Tel.:+98 21 73064279.
E-mail address:gh.pouryoussef i@dena.kntu.ac.ir(S.G.Pouryoussef i).
Peer review under responsibility of Editorial Committee of CJA.
 CHINESE JOURNAL OF AERONAUTICS2016年3期
- CHINESE JOURNAL OF AERONAUTICS的其它文章
- Optimization on cooperative feed strategy for radial–axial ring rolling process of Inco718 alloy by RSM and FEM
- Measuring reliability under epistemic uncertainty:Review on non-probabilistic reliability metrics
- Optimum blade loading for a powered rotor in descent
- Parachute dynamics and perturbation analysis of precision airdrop system
- Simulative technology for auxiliary fuel tank separation in a wind tunnel
- Large-eddy simulation of shock-wave/turbulent boundary layer interaction with and without SparkJet control