
Differential Diagnostic Value of Texture Feature Analysis of Magnetic Resonance T2 Weighted Imaging between Glioblastoma and Primary Central Neural System Lymphoma
2019-04-11 09:26BotaoWangMingxiaLiuZhiyeChen
Chinese Medical Sciences Journal 2019年1期
Botao Wang, Mingxia Liu*, Zhiye Chen, *
1Department of Radiology, Hainan Hospital of Chinese PLA General Hospital, Sanya, Hainan 572013, China
2Department of Radiology, PLA 305 Hospital, Beijing 100017, China
3Department of Radiology, Chinese PLA General Hospital, Beijing 100853, China
Key words: glioblastoma; primary central neural system lymphoma; texture analysis;T2 weighted imaging; differential diagnosis
G LIOBLASTOMA and primary central neural system (CNS) lymphoma are both intracerebral malignant tumors. Cerebral glioblastoma is a common primary brain tumor, which usually is treated by surgery. While the incidence of primary CNS lymphoma has been increasing in recent decades, which is very sensitive to radiotherapy. Therefore, the accurate diagnosis of these two brain tumors would be helpful to make a reasonable treatment plan in clinical practice.[1-2]
previous studies have demonstrated that tumor cells were arranged densely and rich reticular fibers were contained in primary CNS lymphoma, and the solid part of the tumor presented a slightly hypointense, isointense or slightly hyperintense on T2 weighted imaging (T2WI). In clinical practice, primary CNS lymphoma usually shows isointense to gray matter. Although glioblastoma also has a high density of tumor cells, the solid part of glioblastoma usually presents slightly hyperintense on T2WI because of its abundant blood vessels.[3-6]In the current study we used gray-level co-occurrence matrix (GLCM)[7]to quantitatively transform T2WI gray values and subtle changes of pixel arrangement of the tumors' solid part into texture feature parameters, aiming to improve the differential diagnostic accuracy for these two tumors by combining the imaging features.
PATIENTS AND METHODS
Patients
Between July 2012 and July 2018, 81 patients with glioblastoma and 28 patients with primary CNS lymphoma were diagnosed by magnetic resonance (MR)scan and pathology at the Chinese pLA General Hospital and Hainan Hospital of Chinese pLA General Hospital. The patients of glioblastoma included 42 males and 39 females with a mean age of 52.8±11.7 (range 24-75) years, one of whom was confirmed as gliosarcoma by pathology. The patients of primary CNS lymphoma including 18 males and 10 females with a mean age of 53.0±12.5 (range 21-76) years, were all diagnosed as diffuse large B cell lymphoma and had no autoimmune deficiency diseases or immunosuppressive agents administration. All patients did not receive any treatment before they underwent MR examination.
MR imaging
All the data were acquired on a 3.0T whole body MR imaging system (Signa Hdxt, GE Healthcare, Milwaukee, WI, USA) with a conventional eight channel phased-array head coil. Axial T2WI parameters were listed as follows: repetition time (TR) 5500 ms, time echo (TE) 103 ms, slice thickness 5 mm, and slice space 1 mm. Gadodiamide (0.1 mmol/kg, Omniscan,GE Healthcare) was given intravenously at a rate of 2 ml/s using a power injector (Spectris; MedRad, Warrendale, pA, USA) for the post-contrast T1 weighted imaging (T1WI) scan.
Imaging analysis
Axial T2 weighted images of intracerebral tumors were exported as DICOM format from picture Archiving and Communication Systems (pACS), and then was imported to ImagJ (1.41v, https://imagej.nih.gov/ij/)to perform texture analysis with its texture feature analysis plugin. The plugin was set as default values:the size of the step in pixels 1 mm and the direction of the step 0 degree. The regions of interest (ROIs) was extracted as follows: ROI was placed on the solid part of the tumor with maximal area (Figure 1), avoiding the part with hemorrhage, necrosis, cystic change and non-enhancement to ensure the texture of lesions to be uniform and consistent. The size of ROI was depended on the size of the solid part and should include all the pixels in the solid part. To improve the accuracy of the measurement, ROI was placed for 3 times by the same neuroradiologist on the same image, and the mean value of texture parameter was regarded as the final value. The texture parameters included Angular Second Moment (ASM), Contrast, Correlation, Inverse Difference Moment (IDM) and Entropy.
Statistical analysis
The data of texture parameters with normal distribution were expressed as means ± SD and comparison of intergroup was performed with independent t test,while the non-normally distributing data were expressed as median (quantile range) and comparison was performed with Mann-Whitney U test. The categorized data were compared by Chi-square test between the two groups.
The Binary Logistic regression analysis was performed as follows: (1) Glioblastoma and primary CNS lymphoma were considered as the dependent variables; (2) Eight variables with significantly statistical difference including cystic and necrosis changes(yes=1, no=-1), ‘Rosette’ changes (yes=1, no=-1),‘incision sign’ (yes=1, no=-1) as well as ASM, Contrast, Correlation, IDM and Entropy were regarded as the independent variables; (3) The image signs, texture features, and image signs plus texture features with significantly statistical difference entered the Binary Logistic regression analysis, respectively; (4) The variables were selected using backwards method, and the variables that would be enrolled in the logistic regression equation were determined by Wald χ2value;(5) The diagnostic point was computed based on the false positive rate according to the actual clinical requirements of this group of data.[8]
Receiver operating characteristic (ROC) curve was also built. The pathological diagnosis of cerebral tumors is the gold standard. Assuming that glioblastoma is positive and primary CNS lymphoma is negative, the ROC curve was drawn with 1-specificity as horizontal ordinate and sensitivity as vertical coordinate, and the point with the maximal sum of texture parameters specificity plus sensitivity was regarded as the optimal diagnostic point, then the corresponding sensitivity and specificity were obtained. The differential diagnostic value and efficacy of single variable and three combined variables entering logistic regression model were evaluated according to the area under ROC curve(AUC).
Statistical analyses were performed using the SpSS Statistics Software Version 22.0 (SpSS Inc., Chicago, IL, USA). Statistically significant difference was set at a P value less than 0.05.
RESULTS
MR imaging findings
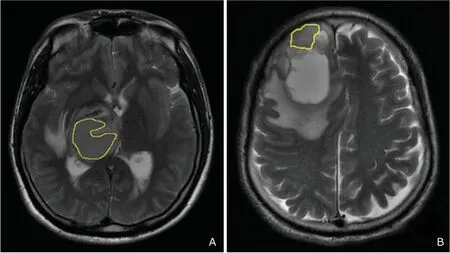
Figure 1. A. A 33 year-old male patient with lyphoma; B. A 50 years old man with glioblastoma. The region of interest was placed on the solid part of the lesion to measure the texture parameters on the T2 weighted image.
The imaging findings of 81 cases of cerebral glioblastoma were listed as follows: (1) onset location:13 located in frontal lobe, 8 in parietal lobe, 32 in temporal lobe, 3 in occipital lobe, 3 in insular lobe,6 in corpus callosum, 9 in basal ganglia, 4 in thalamus and 3 in hippocampus; (2) signal of solid part on T2WI: 66 (82%) showing slightly hyperintense, 9(11%) isointense and 6 (7%) slightly hypointense;(3) imaging signs: 66 (82%) cases with cystic and necrosis changes and 45 (56%) cases with ‘flamelike’ peritumoral edema. The imaging findings of 28 cases of primary CNS lymphoma were listed as follows: (1) onset location: 3 in frontal lobe, 4 in parietal lobe, 2 in temporal lobe, 1 in septum pellucidum, 14 in basal ganglia, 1 in the cerebellum and 3 cases in corpus callosum; (2) signal of solid part on T2WI: 13(46%) slightly hyperintense, 5 (18%) isointense, and 10 (36%) slightly hypointense; (3) imaging signs: 7(25%) cases with cystic and necrosis changes, and 17 (61%) cases with ‘flame-like’ peritumoral edema(Figure 2A). Chi-square test demonstrated that cystic and necrosis changes presented significantly statistical difference (P=0.000, χ2=30.009) between the two tumors, and ‘flame-like’ edema presented no statistical difference (P=0.635, χ2=0.226). Fifty-five (68%)cases of glioblastoma presented ‘Rosette’ changes(Figure 2B), while none of primary CNS lymphoma showed this feature on MRI post-contrast scan, which presented significantly statistical difference (P=0.000,χ2=38.377). Twelve (43%) cases of primary CNS lymphoma showed ‘incision sign’ (Figure 2C) and 4 (5%)cases of glioblastoma showed ‘incision sign’, which also presented significantly statistical difference (P=0.000,χ2=23.888).
Texture features
Table 1 indicated that there was significant difference in the texture ASM (P=0.006, U=820.000), Contrast (P=0.000, U=618.500), Correlation (P=0.002,U=760.000), IDM (P=0.000, t=4.089) and Entropy(P=0.000, t=2.758) between the glioblastoma and primary CNS lymphoma groups. ROC analysis demonstrated that the AUC were 0.671, 0.752, 0.695, 0.720 and 0.646, and the optimal diagnostic points were 0.015, 5.267, 0.050, 0.409 and 4.683 for ASM, Contrast, Correlation, IDM and Entropy, respectively (Table 2). The AUC were 0.757, 0.779 and 0.684 for cystic and necrosis changes, ‘Rosette’ changes and ‘incision sign’ respectively (Figure 3).
The Binary Logistic regression analysis of the image signs, texture features and image features plus texture features was performed with eight independent variables including cystic and necrosis changes, ‘Rosette’ changes, ‘incision sign’ as well as ASM, Contrast, Correlation, IDM and Entropy,which showed significantly statistical difference between the two groups. And then three regression models were obtained: (1) Pimagingsigns=1/1 +e-(-0.303-1.062×cysticandnecrosis+1.226×incisionsign), the diagnostic point was 0.380 according to the false positive rate(R = 10%) based on the current clinical data. If P>0.380, the case should be diagnosed as primary CNS lymphoma; if P<0.380, the case should be diagnosed as glioblastoma. (2) Ptexturefeatures=1/1+e-(-18.107+303.253×ASM-0.197×contrast+3.043×entropy), the diagnostic point was 0.360 according to the false positive rate(R=10%) based on the current clinical data. If P>0.360, the case should be diagnosed as primary CNS lymphoma; if P<0.360, the case should be diagnosed as glioblastoma. (3) Pimagingsigns+texturefeatures=1/1 +e-(-8.362-0.188×contrast-0.442×cysticandnecrosis-10.111×rosette+1.206×incision),the diagnostic point was 0.435 according to the false positive rate (R=10%) based on the current clinical data. If P>0.435, the case should be diagnosed as primary CNS lymphoma; if P<0.435, the case should be diagnosed as glioblastoma. The three equations and diagnostic points were applied to the current 109 cases of glioblastoma and primary CNS lymphoma, and the predictive accuracy for the differential diagnosis was 75.3%, 81.7%, 82.6% respectively.Further ROC analysis demonstrated that AUC were 0.818, 0.769, 0.917 for the combined variables enrolled in these three regression equations, respectively (Figure 3).
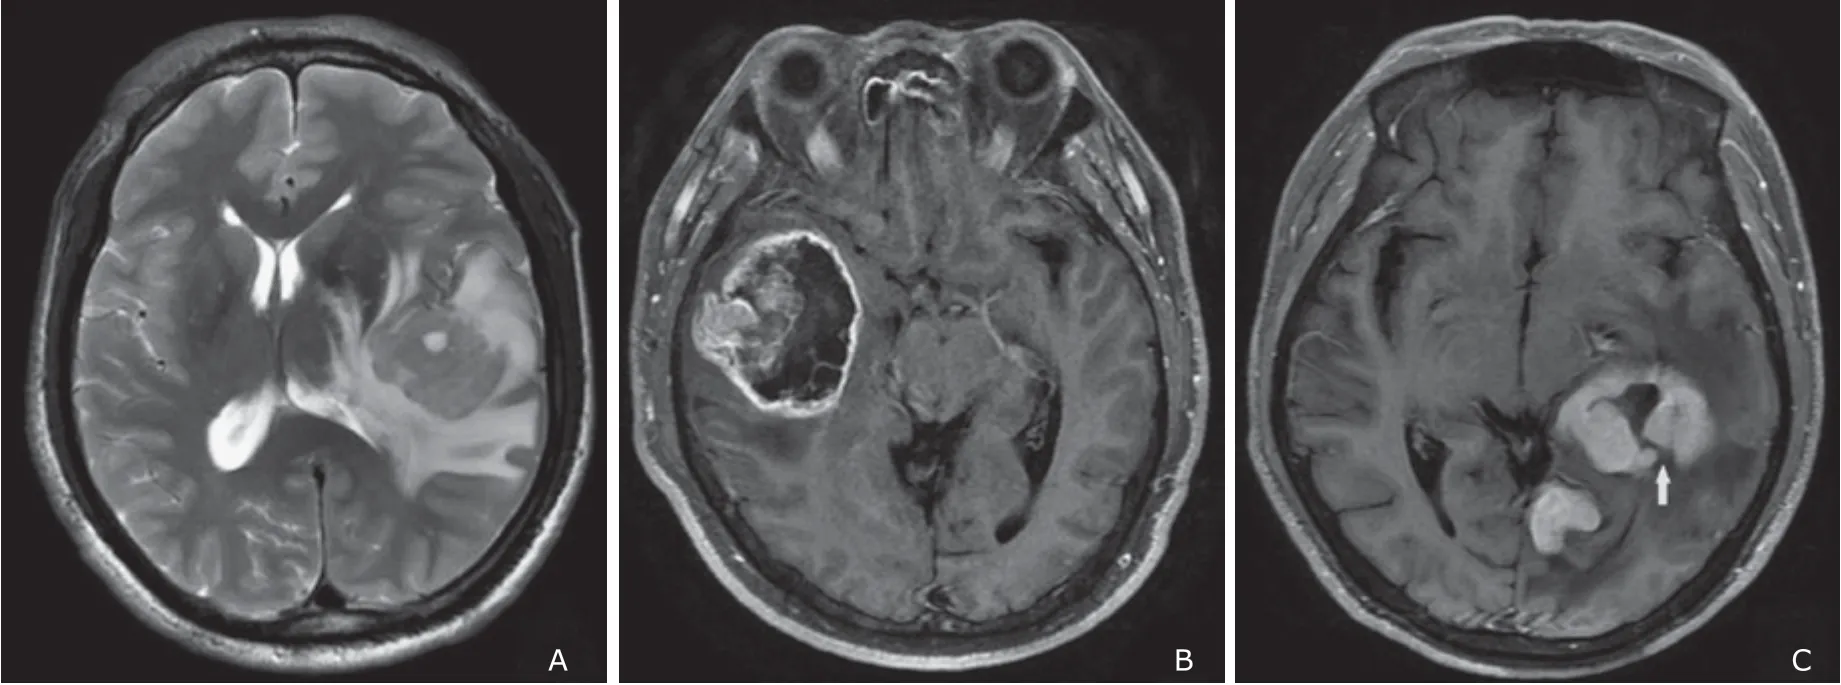
Figure 2. A. The lymphoma of the left temporal lobe presented ‘flame-like edema’; B. The glioblastoma of the right temporal lobe presented ‘Rosette’ enhancement; C. The lymphoma of the left temporal lobe and hippocampus presented ‘incision sign’ (arrow head), which pointed to the dura is aligned with the blood supply arteries and white matter fibers.
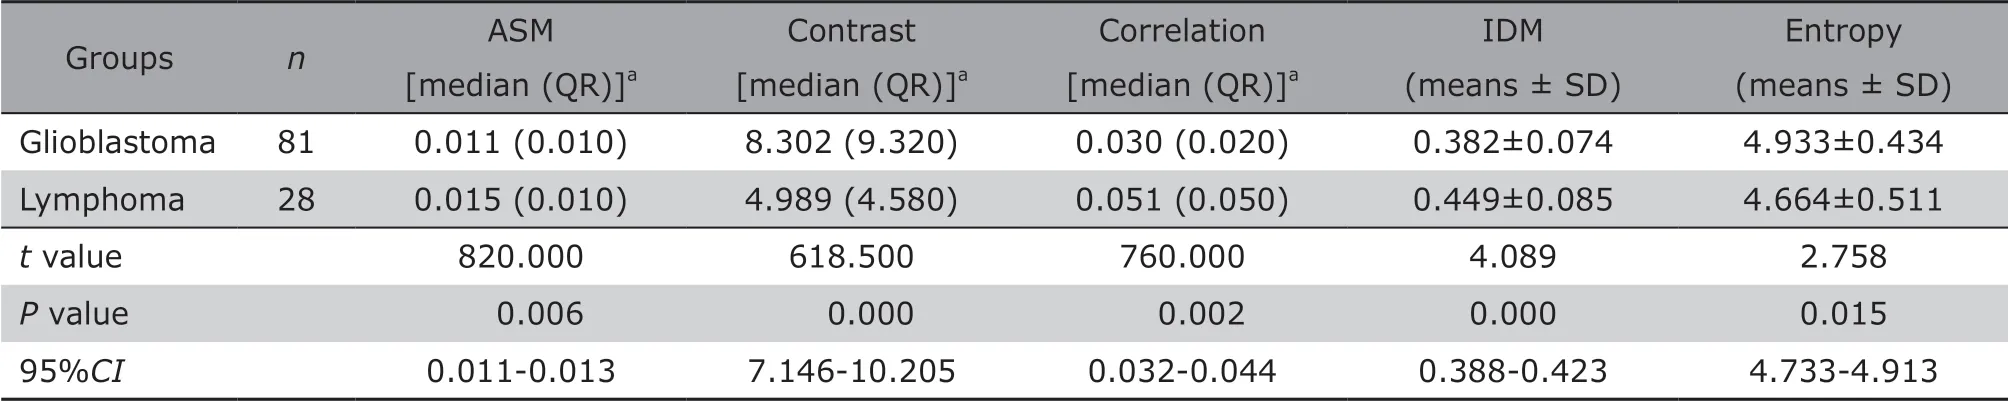
Table 1. Comparisons of the five texture parameters of DWI between 81 patients with cerebral glioblastoma and 28 patients with primary central neural system lymphoma
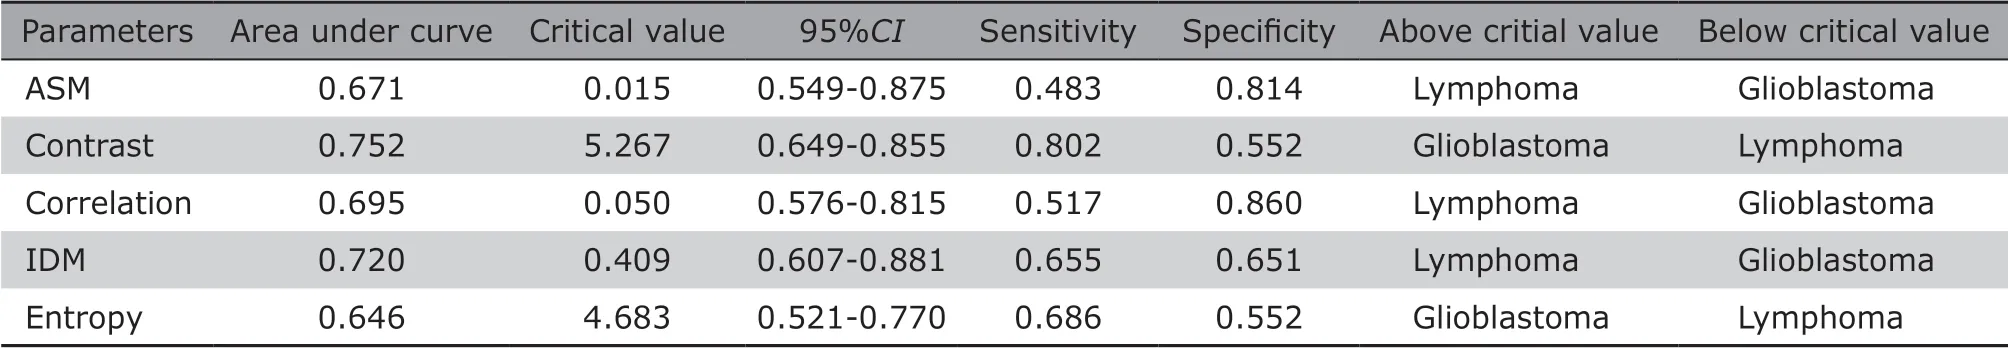
Table 2. Receiver operating characteristic curve evaluation of the texture ASM, Contrast, Correlation, Entropy, and IDM of the model of Logistic regression between cerebral glioblastoma and primary central neural system lymphoma
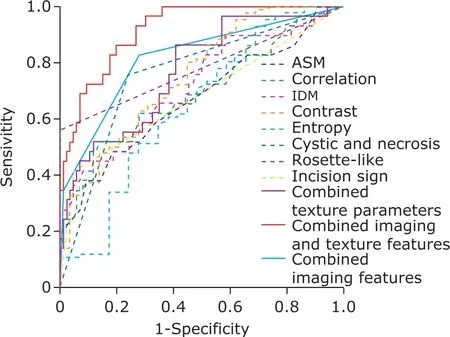
Figure 3. ROC curve of each texture parameter and the combined texture parameters of the model of Logistic regression for glioblastoma and primary central neural system lymphoma.
DISCUSSION
Glioblastoma and primary CNS lymphoma are intra-axial malignant tumors, whose biological behavior determines their respective imaging characteristics. The differential diagnosis of these two tumors mainly depends on the conventional imaging observation. However, some tumors present similar in MRI feature, and it is difficult to differentiate them according to the naked observation of conventional MR images. This study included 28 cases of primary CNS lymphoma, most of which located in the deep brain tissue adjacent to the midline of supratentorial area (18/28, 64%). While most glioblastoma mainly located in temporal lobe,frontal lobe and parietal lobe (53/81, 65%). Therefore,there was difference in the predilection site between these two tumors. Glioblastoma was more prone to cystic change and necrosis than lymphoma, in addition most of glioblastoma showed ‘Rosette’ enhancement on post-contrast scan. Small cystic change and fissure-like necrosis were observed in a few cases of primary CNS lymphoma in this study, and no cases of lymphoma showed ‘Rosette’ enhancement. Chi-square test demonstrated that ‘Rosette’ changes and ‘incision sign’ presented significant difference between glioblastoma and primary CNS lymphoma. The differences in the predisposing sites, cystic change, necrosis and enhancement pattern between these two tumors were consistent with the results of the previous reports.[3-6]previous study also demonstrated that ‘flame-like’edema was helpful in the diagnosis of lymphoma,[9]however, the current study suggested that there was no significant difference between the two groups. We also found that not all cases had characteristic imaging manifestations, and atypical cases still accounted for a certain proportion, which made it difficult to differentiate them on images.
The texture analysis essentially quantitatively described the spatial distribution of pixels on the image,and converted the grayscale information into texture feature, which could be used to quantitatively evaluate the regional characteristics of lesion and objectively diagnose the disorders for the clinician.[10]GLCM was a common method for the extraction of the texture features, which could inflect the relationship in distance,direction and altered magnitude of the selected two points, and further intuitively present the spatial attribute of the image texture features.[11]This method has been applied in imaging diagnosis of multiple disorders.[12-14]The previous study suggested that there was no need to perform multiple parameter setting for the texture feature analysis because the texture of lesions tended to be uniform.[15]Therefore, the current study extracted 5 common texture parameters based on the default settings (pixel step=1 and the direction of the step=0 degree).
In recent years, the texture analysis of the brain tumors using MR images reported at home and abroad mainly focused on the differential diagnosis of intra-axial tumors, the glioma grading and the therapy evaluation of brain tumors. For example, the texture analysis was used to evaluate the tumor cell atypia of gliomas on the post-contrast T1WI images to improve the accuracy of the glioma grading.[16]GLCM was also used to distinguish the recurrence from radiation necrosis after surgery of glioblastoma with an accuracy rate of 86.4%.[17]However, texture analysis was relatively rare to be applied in the differential diagnosis between glioblastoma and primary CNS lymphoma. MR images applying to the texture analysis mainly involved post-contrast T1WI, and the methods mainly included histogram texture analysis, GLCM, gray level running length matrix and so on.[18-22]Especially for differentiating primary CNS lymphoma from high grade glioma using the histogram texture analysis on the post-contrast T1WI images, it was demonstrated that the texture parameter Entropy and heterogeneity had high discriminant value.[23]The current study mainly used GLCM texture analysis on the raw T2WI images to differentiate these two tumors, and contrast agents was not required in this study.
This study demonstrated that texture Contrast and Entropy of glioblastoma were significantly higher than those of primary CNS lymphoma. According to the texture feature attributes, the texture Contrast reflects the wrinkled texture of an image and the texture Entropy represents the texture complexity of an image. Therefore, glioblastoma presented with deeper wrinkled texture and higher texture complexity compared with primary CNS lymphoma. The texture ASM,Correlation and IDM of glioblastoma showed significant decrease compared with primary CNS lymphoma. The texture ASM and IDM reflect homogeneity, and the texture Correlation reflects similarity and grey-levels correlation, which are used to measure the local changes of image texture. This result indicated that glioblastoma stroma has lower homogeneity than primary CNS lymphoma. Therefore, the texture analysis technology could detect heterogeneity change of brain tumor that could not be observed by naked eye, and thus may have a capacity to differentiate glioblastoma from primary CNS lymphoma.
In the current study, texture parameters screened by independent sample t-test have some value in differentiating primary CNS lymphoma from glioblastoma.It is also necessary to take a comprehensive analysis of multi-parameters combined with imaging features to improve the accuracy of differential diagnosis and obtain the correlation of each parameter in differentiating these two tumors. Three binary logistic regression models were obtained and were applied to validate 109 cases of glioblastoma and primary CNS lymphoma in this study. The predictive accuracy was 75.3%, 81.7%and 82.6%, respectively. The regression models based on texture features and image signs + texture features have high predictive accuracy.
In this study, ROC analysis was used to evaluate the diagnostic value and efficacy for single texture parameter and three combined variables enrolled in the Logistic regression equation in differentiating glioblastoma from primary CNS lymphoma. The AUC of the combined variables enrolled in the three Logistic regression models was 0.818, 0.769, 0.917, respectively. The AUC of signal variable was in the range of 0.646 to 0.779. The AUC of regression model based on image signs plus texture features was 0.917, and it’s diagnostic efficacy was obviously better than that of the other two regression equations and the signal texture parameter. For AUC values in the range of 0.5-1.0, the larger the AUC value is, the higher the diagnostic accuracy is. Therefore, the logistic regression model composed of four variables including cystic and necrosis changes, ‘Rosette’ changes, ‘incision sign’ and texture has higher predictive accuracy and diagnostic efficiency in differentiating the two tumors.
The cut-off value of texture parameters with statistical differences, i.e. the maximum specific value of sensitivity plus specificity of ROC curve near the upper left corner, was obtained, which could be used to pre-differentiate glioblastoma and primary CNS lymphoma. However, the diagnostic efficiency of single texture parameter is lower than that of logistic regression equation, which can only be considered as one of the reference data for differential diagnosis.
There are some limitations in this study: (1) The sample size was relatively small for the primary CNS lymphoma, although the incidence of lymphoma has increased in recent years, it is still one of the rare malignant tumors in the brain; (2) This study was a preliminary study of texture analysis in differentiating intracerebral tumors, and only texture analysis of T2WI images were performed and the other MR images should be used in the future.
In summary, this study demonstrated that the heterogeneity of glioblastoma and primary CNS lymphoma can be reflected by combining the imaging features cystic and necrosis changes, ‘Rosette’ changes, ‘incision sign’ and texture parameter Contrast on T2WI. The combined variables enrolled in the logistic regression equation had a considerable clinical value in differentiating the two tumors.
Conflict of interest statement
The authors have no conflict of interest to disclose.
 Chinese Medical Sciences Journal2019年1期
- Chinese Medical Sciences Journal的其它文章
- Value of Texture Analysis of Intravoxel Incoherent Motion Parameters in Differential Diagnosis of Pancreatic Neuroendocrine Tumor and Pancreatic Adenocarcinoma
- MRI Histogram Texture Feature Analysis of the Optic Nerve in the Patients with Optic Neuritis
- Value of Texture Analysis on Gadoxetic Acid-enhanced MR for Detecting Liver Fibrosis in a Rat Model
- Value of Magnetic Resonance Imaging Texture Analysis in the Differential Diagnosis of Benign and Malignant Breast Tumors
- Prediction of Hidden Blood Loss During Posterior Spinal Surgery
- Bilateral Peripheral Facial Paralysis Combined with HIV Meningitis During Acute HIV-1 Infection: A Case Report