
MRI Histogram Texture Feature Analysis of the Optic Nerve in the Patients with Optic Neuritis
2019-04-11 09:26HongjuanLiuHuanfenZhouLinxiongZongMengqiLiuShihuiWeiZhiyeChen
Chinese Medical Sciences Journal 2019年1期
Hongjuan Liu, Huanfen Zhou, Linxiong Zong,Mengqi Liu, , Shihui Wei, Zhiye Chen, *
1Department of Ophthalmology, 3Department of Radiology,Chinese PLA General Hospital, Beijing 100853, China
2Department of Radiology, Hainan Hospital of Chinese PLA General Hospital, Sanya, Hainan 572013, China
Key words: histogram analysis; optic nerve; optic neuritis; texture analysis; Energy; Entropy
O pTIC neuritis (ON) is an inflammatory demyelinating disorder of the optic nerve,presenting as the most common optic neuropathy affecting young adults. It is typically characterized by subacute monocular visual loss in company with pain during eye movement. The diagnosis of ON greatly relies on the clinical presentation and other examinations, including magnetic resonance imaging (MRI).[1-2]
MRI plays an essential role in the diagnosis and management of patients with suspected demyelinating inflammation, damage and atrophy.[3]Contrast-enhanced T1-weighted imaging (T1WI) and T2 weighted imaging (T2WI) with fat saturation could simultaneously detect demyelinating inflammatory lesions, which classically present with high-signal-intensity in the images. previous studies also indicated the predictive value of MRI for the prognosis of visual impairment,suggesting the crucial importance of orbital MRI for ON.[4-5]However, the sensitivity of MRI enhancement is greatly suffered by the dosage of contrast medium,duration from ON onset and visual perception of radiologists.[6-7]
MRI histogram texture, which is the automated pattern to make recognition and image analysis, could reduce this variability and provide objective information to support clinical decision-making. It describes a wide range of techniques that enable quantification of the gray-level patterns, pixel interrelationships, and the spectral properties of an image.[8]Thus, our study was aimed to evaluate the optic nerve impairment by using MRI histogram texture features analysis in the patients with ON, trying to make improvements of sensitivity and accuracy for ON diagnosis.
PATIENTS AND METHODS
Participants
The subjects admitted to the Ophthalmology Clinic of Chinese pLA General Hospital and Hainan Branch of Chinese pLA General Hospital during 2009 and 2018 were retrospectively recruited into this study. This was a retrospective study and did not require informed consent from the subjects because the involved MRI sequences were routinely performed in clinical practice at our hospital. Sixty patients with ON and 20 normal controls were consecutively enrolled, who received MRI examinations, including coronal T2WI with fat saturation and contrast-enhanced T1WI. The diagnosis criteria of ON were as follows: (1) eye pain at onset; (2) decreased monocular or binocular visual acuity; (3) visual field defect in the affected eye; (4) normal appearance or mild optic disc edema at onset. Those were excluded if they met one of the following conditions: (1) with amblyopia, glaucoma or other neuropathy; (2) with infection; (3) with non-demyelinating central nervous system (CNS) inflammatory syndromes or connective tissue disorder and neuromyelitis optica (NMO); (4)whose visual loss associated with ocular injury.
Study design
ON was a clinical diagnosis, and the orbit MRI with gadolinium contrast was mainly used to look for optic nerve enhancement or not for ON patients. In acute ON, 94% of the affected optic nerves presented enhancement, and chronic ON commonly showed no enhancement.[9]To investigate the T2 texture difference, we firstly categorized the affected optic nerves based on MRI enhancement. Diffusion tensor imaging technique had proved that the contralateral optic nerves could present fractional anisotropy (FA) value decreased in monocular ON.[10]Therefore, the contralateral optic nerves in monocular ON were classified as normal appearing group.
In the current study, the optic nerves were classified into four groups: (1) the affected optic nerve with enhancement (ONwEN); (2) the affected optic nerve without enhancement (ONwoEN); (3) the contralateral normal appearing optic nerve (NAON) for monocular onset; (4) the normal optic nerve (NON). MR image classification was performed on picture Archiving and Communication Systems (pACS) by one reader (ZY Chen) with >10 years of experience in MR imaging.
MR imaging
Image data of all patients and controls were acquired on a GE 3.0T MR system (SIGNA EXCITE, GE Healthcare, Milwaukee, WI, USA) with a conventional eight channel quadrature head coil. The Iterative Dixon water-fat separation with Echo Asymmetry and Leastsquares estimation (IDEAL) sequence was applied,which including axial, sagittal and coronal T1WI and T2WI. The contrast agent (Gadodiamide, 0.1 mmol/kg,Omniscan, GE Healthcare Milwaukee, WI, USA) were injected intravenously. After contrast administration,axial, sagittal and coronal T1WI sequence images were acquired. The detailed imaging parameters of the coronal T2WI were listed as follows: repetition time/echo time (TR/TE)=3962 ms/87 ms, flip angle=111°, echo train length=16, pixel band width=325, acquisition matrix=320×224, field of view=16 cm×16 cm, and slice thickness=3 mm.
Imaging processing
All MR coronal T2WI data with fat saturation was processed on Omni-Kinetics workstation (V2.1.0.R, GE Healthcare, LifeScience, China). The regions of interest(ROIs) were drawn on the affected orbital optic nerve on coronal T2WI, which simultaneously presented enhancement on T1WI or hyperintensity on T2WI with no enhancement on T1WI (Figure 1). The normal appearing and normal optic nerve’s ROIs were drawn on the posterior 1/3 orbital optic nerve. The area of all ROIs ranged from 25 mm2to 32 mm2and drawn by one experienced technician (ZL Zong). The histogram texture Skewness, Kurtosis, Uniformity, Energy and Entropy were automatically measured within the Omni-Kinetics workstation.
Statistical analysis
The data with normal distribution were presented as means ± STD, and non-normal distribution data presented median (minimum, maximum). Age was compared using independent samples t test, and sex was compared using Chi-Square test between groups. Kruskal-Wallis one-way ANOVA was applied to compare the difference for texture features among groups. Receiver operating characteristic (ROC) curve was used to compare the diagnostic value of texture features between compared groups. Area under ROC curve (AUC) more than>0.7 was defined as having reasonable diagnostic value.[11]Statistically significant difference was set at a P value of less than 0.05. Statistical analyses were performed using the pASW Statistics Software Version 18.0 (SpSS Inc., Chicago, IL, USA) and MedCalc for Windows, version 11.4.2.0 (MedCalc Software, Ostend,Belgium).
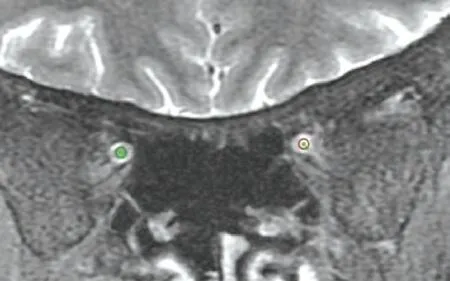
Figure 1. A 51 year-old female patient with left optic neuritis. Red circle (30 mm2), the affected left optic nerve;Green circle (31 mm2), the normal appearing optic nerve.
RESULTS
Clinical characteristics of optic neuritis patients and normal controls
The ON patients included 17 monocular and 12 binocular onset with the enhancement of the affected optic nerve. The non-enhanced affected ON included 16 monocular and 15 binocular onset patients. The numbers of the classified optic nerves were listed as follows: 41 optic nerves with enhancement in ON patients, 45 optic nerves without enhancement in ON patients, 34 normal appearing optic nerves for monocular ON patients, and 40 normal optic nerve.
There was no significant difference in the age between ON patients (33.70±15.27 years) and normal controls (38.65±18.40 years) (t=1.19, P=0.16). The sex also showed no significant difference between ON patients (female 38, male 22) and normal controls (female 8, male 12) (χ2=2.46, P=0.12).
Comparisons of histogram texture of the intraorbital optic nerve in the ON
Table 1 indicated that the texture Skewness, Kurtosis and Uniformity presented no significant difference among ONwEN, ONwoEN, NAON and NON (H=1.833,4.037 and 2.154, P=0.608, 0.257 and 0.541 respectively). The texture Energy and Entropy showed significant difference among each group (H=28.031 and 28.384, both P<0.001). Further between group comparisons demonstrated that ONwEN presented a lower texture Energy value (H=40.328, P=0.000)and a higher texture Entropy (H=40.512, P=0.000)than ONwoEN (Table 2). Table 2 indicated that there was a significantly lower texture Energy in ONwEN (H=47.064, P=0.000) and NAON (H=33.743,P=0.011) and a significantly higher texture Entropy in ONwEN (H=47.284, P=0.000) and NAON (H=34.128,P=0.010) compared with NON.
ROC analysis for the histogram texture of the intraorbital optic nerve between groups
ROC analysis indicated that texture Energy and Entropy both had a relative higher AUC for ONwEN vs.ONwoEN, ONwEN vs. NON and NAON vs. NON (>0.70) (Table 3, Figure 2). The texture Energy and Entropy had the highest diagnostic specificity (both 92.5%) in ONwEN vs. NON (cut-off value=0.030 and 5.101, respectively) (Z=0.143, P=0.887), and the texture Energy and Entropy had the highest diagnostic sensitivity (both 78.0%) in ONwEN vs. ONwoEN (cutoff value=0.040 and 4.681, respectively; Z=0.097,P=0.923).
DISCUSSION
Conventionally, MRI enhancement needs gadolinium-based contrast agents to be administered to improve the visibility of tissue structure or lesions.[12]However, this method is invasive for the patient. In the current study, the texture Energy and Entropy had the highest diagnostic specificity and sensitivity in ONw-EN-NON and ONwEN-ONwoEN, suggesting the potential value of being a surrogate for MRI enhancement to evaluate the impairment of optic nerve in ON. previous studies indicated that contrast enhancement can be observed on (fat-suppressed) T1-weighted images in about 94% of patients with acute ON, which is affected by the severity of inflammation and visual perception of radiologists.[7]Compared with the traditional method, the texture Energy and Entropy were relatively objective and could also be performed for the quantitative evaluation. Furthermore, this method could be used in a variety of applications and easy to performwith plain MRI scan, which was suitable for most of hospitals that in the absence of high-end equipment.
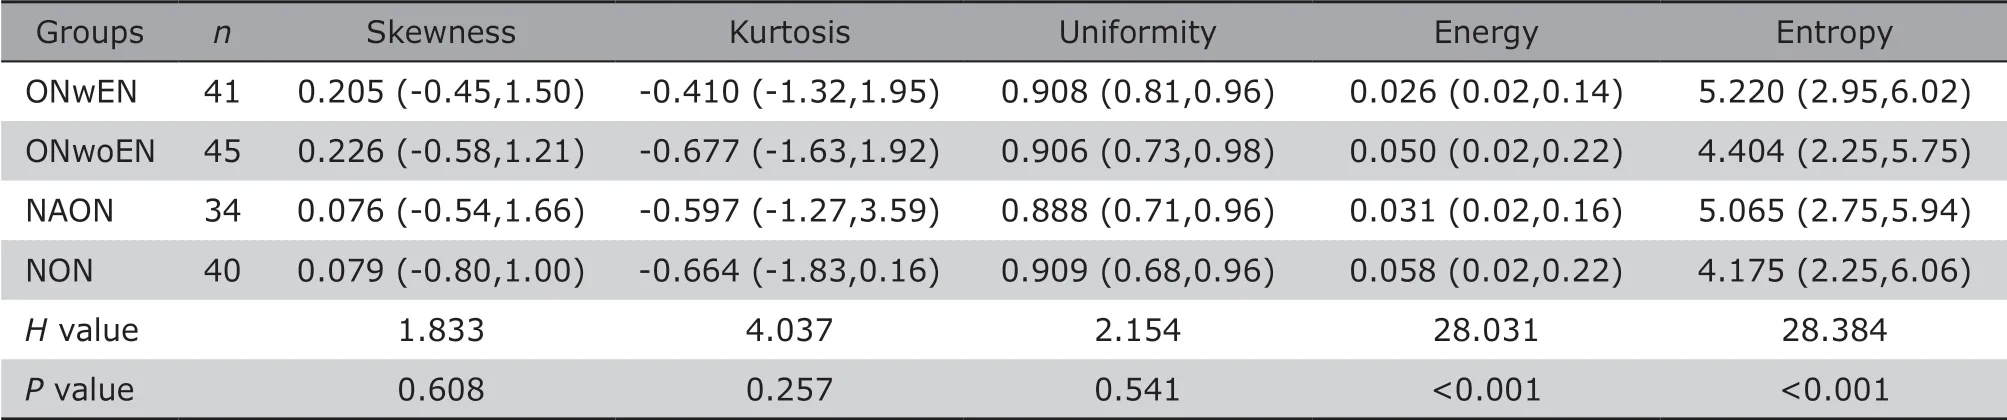
Table 1. Multiple comparisons of histogram texture features of the optic nerve in optic neuritis patients
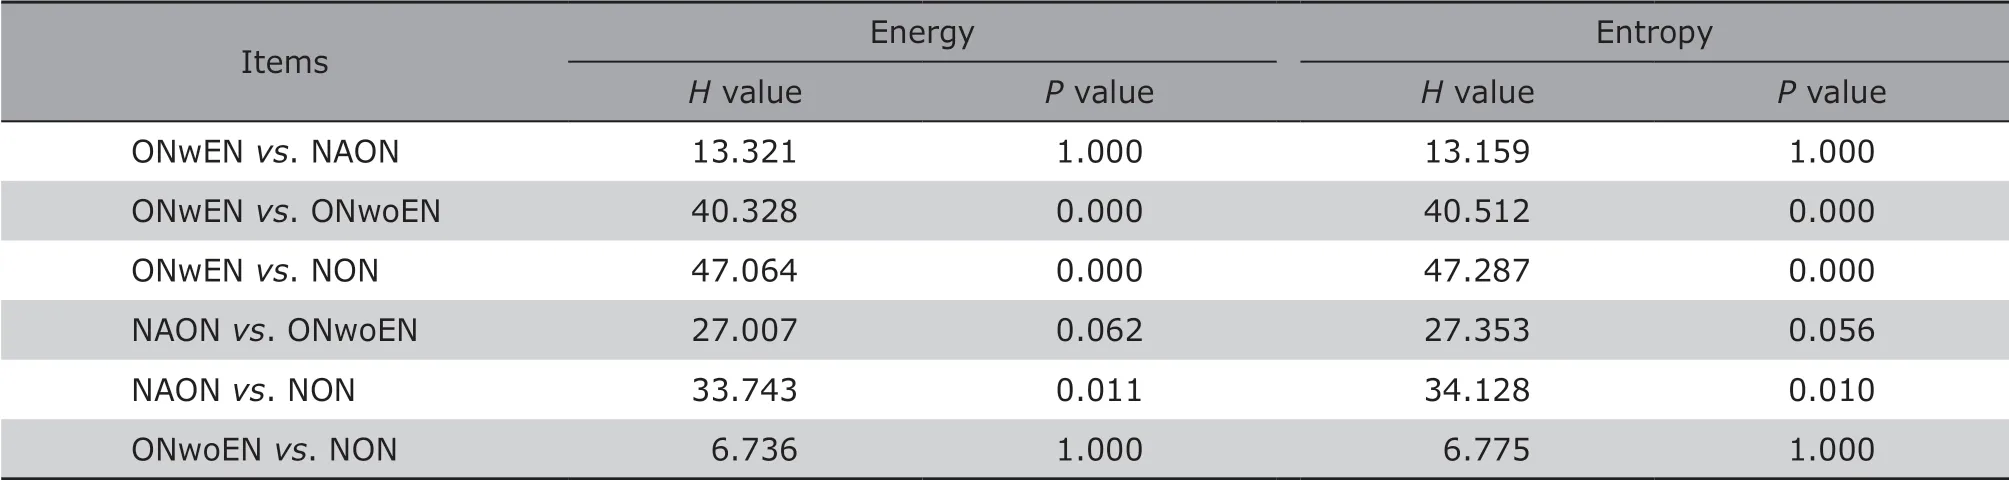
Table 2. Comparisons of histogram texture Energy and Entropy between the ONwEN, ONwoEN, NAON and NON groups
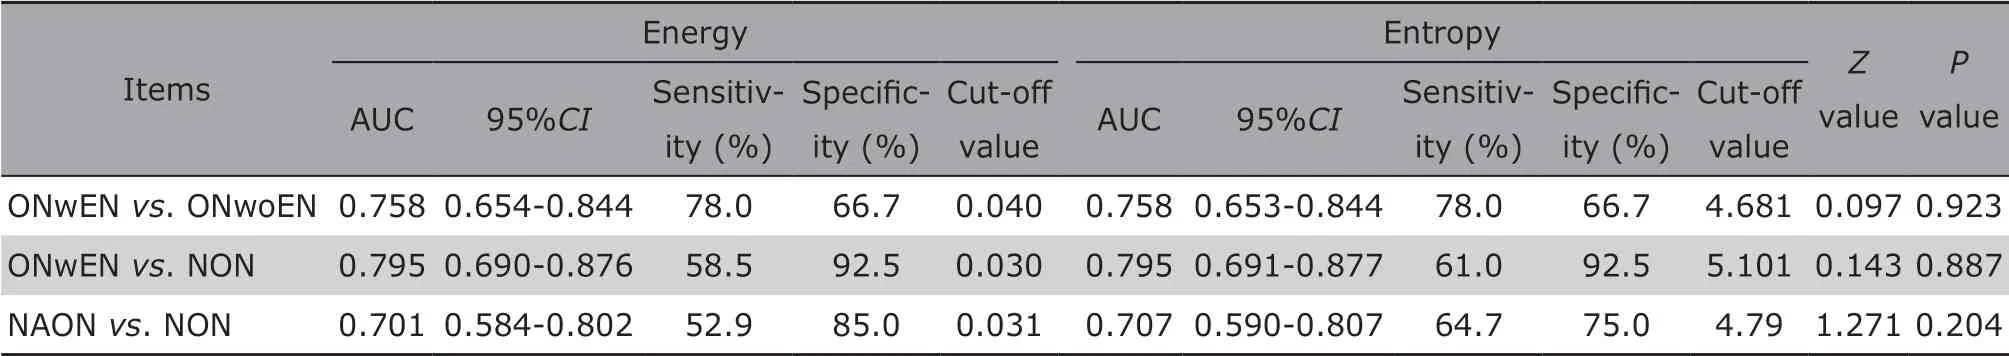
Table 3. ROC analysis of histogram texture features of the optic nerve in the patients with optic neuritis and normal controls
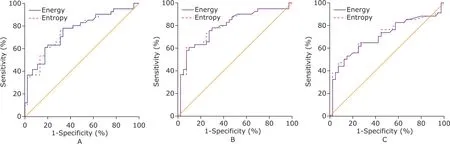
Figure 2. ROC map for the each compared groups. The texture Energy and Entropy of ONwEN vs. NON had the highest AUC [0.795, 95%CI (0.690-0.876) and 0.795, 95%CI (0.691-0.877), respectively].
The texture feature was the intrinsic characteristics of MR images, and could be used to detect the subtle changes of lesions, which could not be observed by naked eye. For monocular ON, the affected optic nerve could be observed on T2WI or enhanced on T1WI, while the opposite optic nerve commonly appeared normal on conventional MR images. Therefore, texture feature analysis was performed to evaluate the normal appearing optic nerve and try to find occult changes.
In our cohort study, the texture analysis could provide a noninvasive method to identify the lesions of optic nerve in ON patients. Notably, it was demonstrated that the texture Energy and Entropy presented a significant difference between the NAON group and NON group, which indicated a potential impairment in the opposite eye in the patients with monocular ON. In the previous study,[10]FA value could also be used to identify the potential impairment in the NAON by diffusion tensor imaging (DTI). Compared with DTI, texture analysis measured on the conventional T2WI did not increase the MRI scan time and had a wide application in the clinical practice. Therefore, the texture Energy and Entropy had the capacity to identify the insidious ON, which was crucial for ON patients on the choice of treatment and prognosis estimation.
Based on the conventional viewpoints, the acute ON commonly presented enhancement while chronic ON showed no enhancement on post-contrast T1WI.Therefore, the patient must receive the MRI contrast administration when the acute phase was distinguished from the chronic phase. However, the texture Energy and Entropy of T2WI could be used to diagnose the acute and chronic phases and improve the diagnosis efficacy in the current study, which might avoid the MRI contrast administration and be more adapt to the patients with renal insufficiency.
There are some limitations of this study. First, a selection bias is present due to the fact that this was a single-center study. Second, the cohort was relatively small, and ON was not classified further based on the etiopathogenisis. A larger sample with a variety of ON is required to further confirm the prognostic value of texture Energy and Entropy in the diagnosis of ON.
In conclusion, MRI histogram texture Energy and Entropy could be used to distinguish acute phase from chronic phase for the involved optic nerve, and to evaluate the lesions of optic nerve in ON.
Conflict of interest statement
The authors have no conflict of interest to disclose.
 Chinese Medical Sciences Journal2019年1期
- Chinese Medical Sciences Journal的其它文章
- Value of Texture Analysis of Intravoxel Incoherent Motion Parameters in Differential Diagnosis of Pancreatic Neuroendocrine Tumor and Pancreatic Adenocarcinoma
- Differential Diagnostic Value of Texture Feature Analysis of Magnetic Resonance T2 Weighted Imaging between Glioblastoma and Primary Central Neural System Lymphoma
- Value of Texture Analysis on Gadoxetic Acid-enhanced MR for Detecting Liver Fibrosis in a Rat Model
- Value of Magnetic Resonance Imaging Texture Analysis in the Differential Diagnosis of Benign and Malignant Breast Tumors
- Prediction of Hidden Blood Loss During Posterior Spinal Surgery
- Bilateral Peripheral Facial Paralysis Combined with HIV Meningitis During Acute HIV-1 Infection: A Case Report