
On the structural and optical properties investigation of annealed Zn nanorods in the oxygen flux*
2021-11-23 07:31FatemehAbdi
Chinese Physics B 2021年11期
Fatemeh Abdi
Department of Engineering Sciences,Faculty of Advanced Technologies,University of Mohaghegh Ardabili,Namin,Iran
Keywords: nano rod,optical spectra,refractive index,reverses homogenization
1. Introduction
In the nano scale, the properties of nanostructures are highly dependent on the shape and size of nanostructures. On the other word,by preparing nanostructures from the same material but with different shapes and sizes, different behaviors can be observed.[1-7]So,by thin films engineering,properties of materials can be controlled for specific applications.
Glancing angle deposition and oblique angle deposition(OAD)are two methods of preparing nanostructures with different shapes,geometries and dimensions. By controlling the shape, dimensions and porosity of the film, the optical properties such as transmission, reflection, absorption, refractive inde,etc.,can be controlled.[8-12]
Nano rods are widely used in biomedical,[13]photovoltaic devices,[14]nano electronics,[15-17]field emitter,[18,19]nano optics,[20]crystal photonics,[21]and gas sensors.[22]Study of physical and chemical properties of nano rods to understand the advantages and limitations of this most widely used material is very attractive, which is why in recent years researchers have extensively studied their optical and electrical properties.[23-26]
There are several methods for nano rods preparation,the most common of which is the physical vapor deposition at oblique angle(oblique angle deposition deposition).[18-20]The advantage of physical deposition method over chemical methods is the high purity of the obtained films and the controllability of the size and shape of the nano rods by controlling the deposition parameters such as deposition rate, deposition angle,substrate seeds,substrate temperature and so on.
In oblique angle deposition method, nano rods create shadow areas around them, the length of which depends on the orientation of the nano rod. The angle of the nano rods(β)relative to the line perpendicular to the surface,calculated from the tangent and tait relations[27]
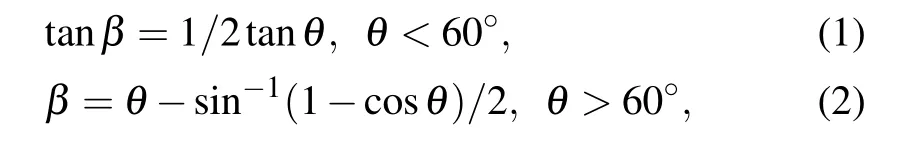
in these relationsθis deposition angle of nano rods. So, due to the shadowing effect, some areas are protected from flux landing. The larger the angle of the nano rods,the greater the shadow effect and the more areas of flux landing are protected.Thus,with deposition angle increasing the porosity of the films increase and the density of the nano rods decrease. Therefore,nano rods are anisotropic structures whose properties can be controlled by controlling the deposition condition.
So far, various metal nanorods such as silver,[28-34]gold,[35-37]aluminum,[38-40]copper,[41-43]magnesium[44]titanium,[45]manganese,[46]nickel,[47]cobalt,[48]cadmium,[49]silicon,[50]germanium,[51]and metal oxides such as titanium oxide,[52]cadmium oxide,[53]calcium oxide, SnO2[54]Y2O3,[55]SiO2,[56]zinc oxide[57-63]have been formed with different deposition conditions and their optical and electrical properties have been investigated. Studying the structure that is a combination of two types of materials can be more interesting,which is discussed in this work.
Due to the fact that nano rods are inhomogeneous and anisotropic structures, their optical properties depend on the incident light angle. By obtaining the experimental optical spectrum at a specific incident light angle and by fitting the experimental transmission and reflection spectrum obtained with the homogenization theory,the porosity percentage and refractive index of the structures can be calculate.On the other word the reverse homogenization method is a suitable method for studying the optical properties of anisotropic and inhomogeneous structures such as sculptured thin film,which also gives the void fraction of the structure. In this work,using this theory, the optical constants such as refractive index and permeability of annealed Zn nano rods in oxygen flux are calculated and the effect of deposition angle on these properties is investigated. Also,void fraction of the structures is obtained.
2. Experiment
To begin with, the glass substrates were cleaned in acetone and then alcohol in the ultrasonic bath,and pasted to the substrate holder using vacuum adhesive. Oblique angle deposition method was performed,at room temperature,base pressure of 2×10?7torr,using electron beam technique at different deposition angles of 0°,30°,45°,and 60°. For all deposition angles,100 nm thin films(with 2 ?A/s deposition rate)were produced. The produced nano rod structures were annealed in 250 sccm of oxygen flux at 340°C for 2 h. The samples were cooled in the presence of oxygen gas for six hours,to bring the samples temperature to the room temperature.
The crystal structure of the samples was investigated using x-ray diffraction pattern (CuKradiation; 40 kV, 30 mA)with a step size of 0.02°and count time of 1 s/step and the oxide thickness of the thin films was investigated with XPS depth profile.The surface morphology and roughness were investigated by means of AFM(Auto Probe Pc, Park Scientific Instrumen,USA;in non-contact mode,with low stress silicon nitride tip of less than 200 ?A radius and tip opening of 18°)and FESEM(Hitachi S-4100 SEM,Japan)images.
Because nano rods are inhomogeneous and anisotropic structures,the optical spectrum of the structure,including the transmission and reflection spectrums, were obtained using spectrophotometer for p polarized light at 10°incident light angle. Using reverse homogenization theory and fitting between experimental and theoretical result,the complex refractive index of structures (N=n+ik) and void fraction of the structures at different deposition angles were obtained. Using these refractive indexes, the permeability of the structures as well as the optical conductivity of the structures was calculated and their changes with deposition angle were investigated.
Due to the importance of homogenization theory in studying the optical properties of sculptured thin films,it is summarized below.
3. Homogenization theory
Because the thin films obtained from the oblique angle and glancing angle depositions are inhomogeneous and anisotropic structures,the study of the theory of optical properties of these nanostructures is different from ordinary thin films and is done by the homogenization theory. Due to the importance of the homogenization process in the optical property’s investigation of these films, and for avoiding from reworking, a summary of this theory is presented and more details are mentioned in our previous work.[3]
Because of the porosity nature of the thin films obtained from glancing angle and oblique angle deposition, these layers considered as a combination of two phases of matter and empty space. The volume fraction of the material phase (fs)and the volume fraction of porosity(fv)are related by the following relation:

Empty space and matter space are considered as a string of elongated ellipse. Each ellipse in Cartesian coordinates is given by the following equation:
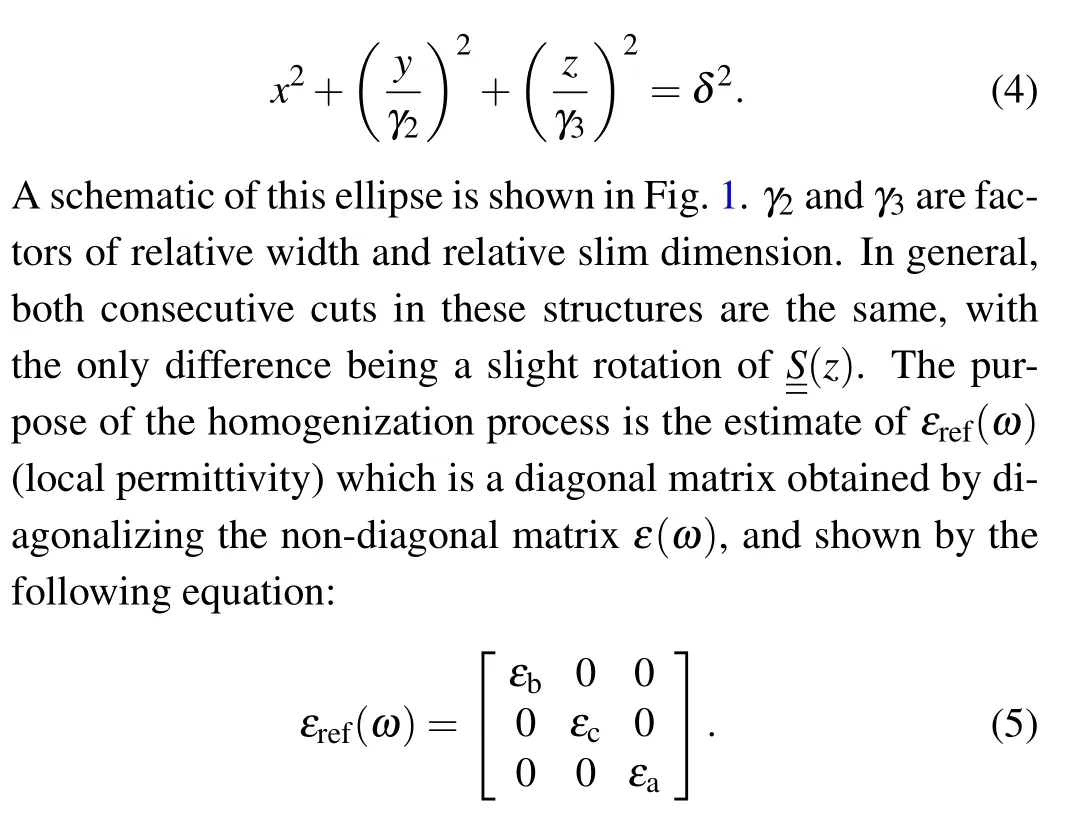
In other words,these porous thin films are considered to be a set of very thin layers that are arranged on top of each other in thezdirection. By homogenization process,each very thin layer is considered as a homogeneous layer that the permittivity of which is a diagonal matrix. There are different methods for homogenization andεref(ω) calculating, but Brugman’s homogenization method is remarkable for its simplicity. In this method,the following equation is solved:
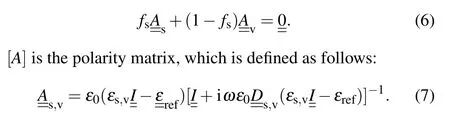
In this relation,Iis unit matrix,ε0is the permittivity of free space, and [D] is the matrix which is given by the following relation:
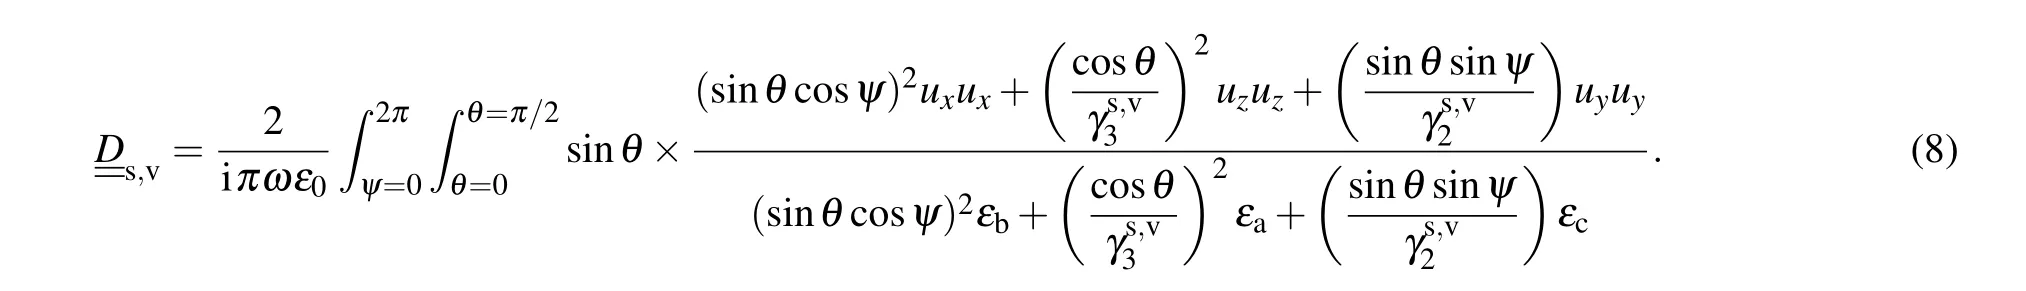
In these equations,kis the wave vector,θspecifies the incident light angle (with respect tozaxis) andψindicates the direction of the incident light(with respect toxaxis). One can show the wave vector of light as follows:
In the above relation,Mthe transfer matrix and thekmatrix,which include the angles of incidence of light,are as follows:
With the help of computational software,the above matrix can be solved to obtain the transmission and reflection spectra of oblique angle deposition layers(nano rods structures).[64]
4. Result
4.1. FESEM and AFM results
Figures 2(a)-2(d)show the FESEM images of nano rods formed at different deposition angles of 0°, 30°, 45°, and 60°, respectively. It is clear from the figure that the formed structures have a hexagonal cross section. It is also obvious from the figure that the nano rods formed at 0°deposition are denser structures adhered to each other with the least porosity.As the deposition angle increases, the porosity of the structures increases due to the increasing of shadowing effect. Figure 1(d) shows that the nano rod thin film formed at a 60°deposition angle has the highest porosity percentage. Because with increasing the angle of deposition,the angle of the nano rods(relative to the surface)increases,[27]so the length of the shadow increase. In other word, with increasing deposition angle (with respect tozaxes (zaxes is perpendicular to the substrate)), according to Tate and tangent law, the angle of nano rods(with respect tozaxes)increase,so,nano rods shading on the substrate increases and these regions are protected from flux landing. Therefore,the percentage of porosity of the films increases. The nano rods angles(with respect to the line perpendicular to the surface)were calculated from the tangent law.[27]These angles for the nano rods deposited at different angles of 0°,30°,40°,and 60°,were obtained 0°,16°,28°,and 40.9°,respectively. These results are given in the first column of Table 1. The porosity of thin films deposited at different angles will be calculated using homogenization theory,which will be explained in the optical results section.
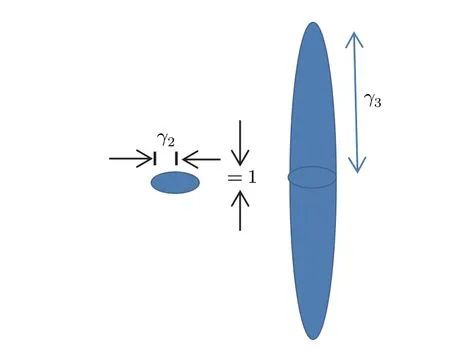
Fig.1. Schematic of ellipses in homogenization theory.
Figures 3(a)-3(d) show AFM images (two-dimensional and three-dimensional image) of nano rod structures formed at different deposition angles of 0°,30°,40°,and 60°respectively. Figure 3(a), which shows the surface of the sample formed at the deposition angle of 0°, shows that it has the largest grains due to less shadowing effect. Figures 3(b)-3(d)show that the grain size decreases with increasing deposition angl,due to the increase in the shadowing effect and porosity.The average grain size (D), surface roughness (R) and deviation from this mean(RMS)which was calculated using Nova software are shown in Table 1.
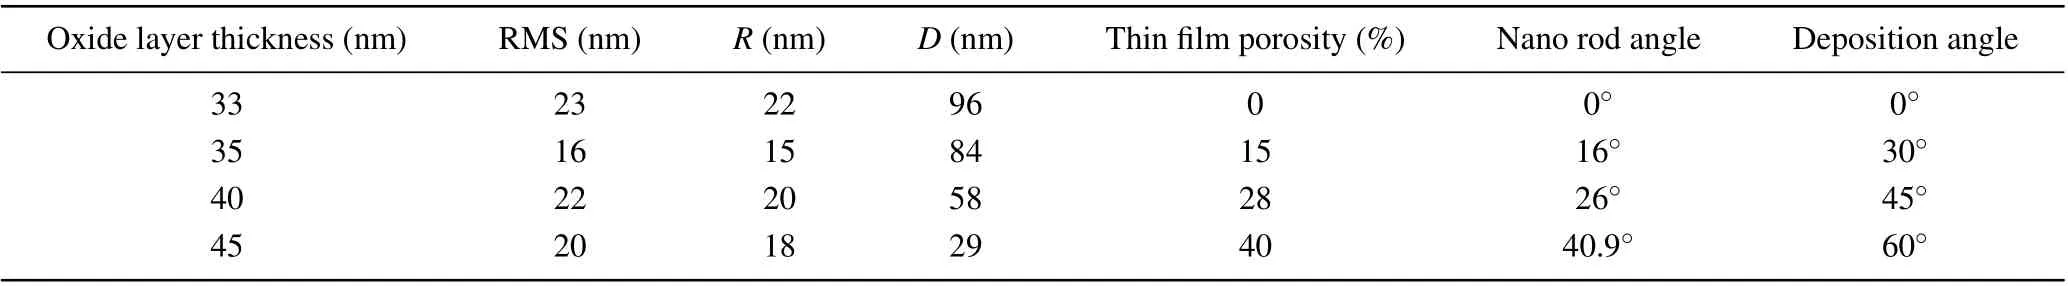
Table 1. Experimental details of ZnO nano rod analysis.
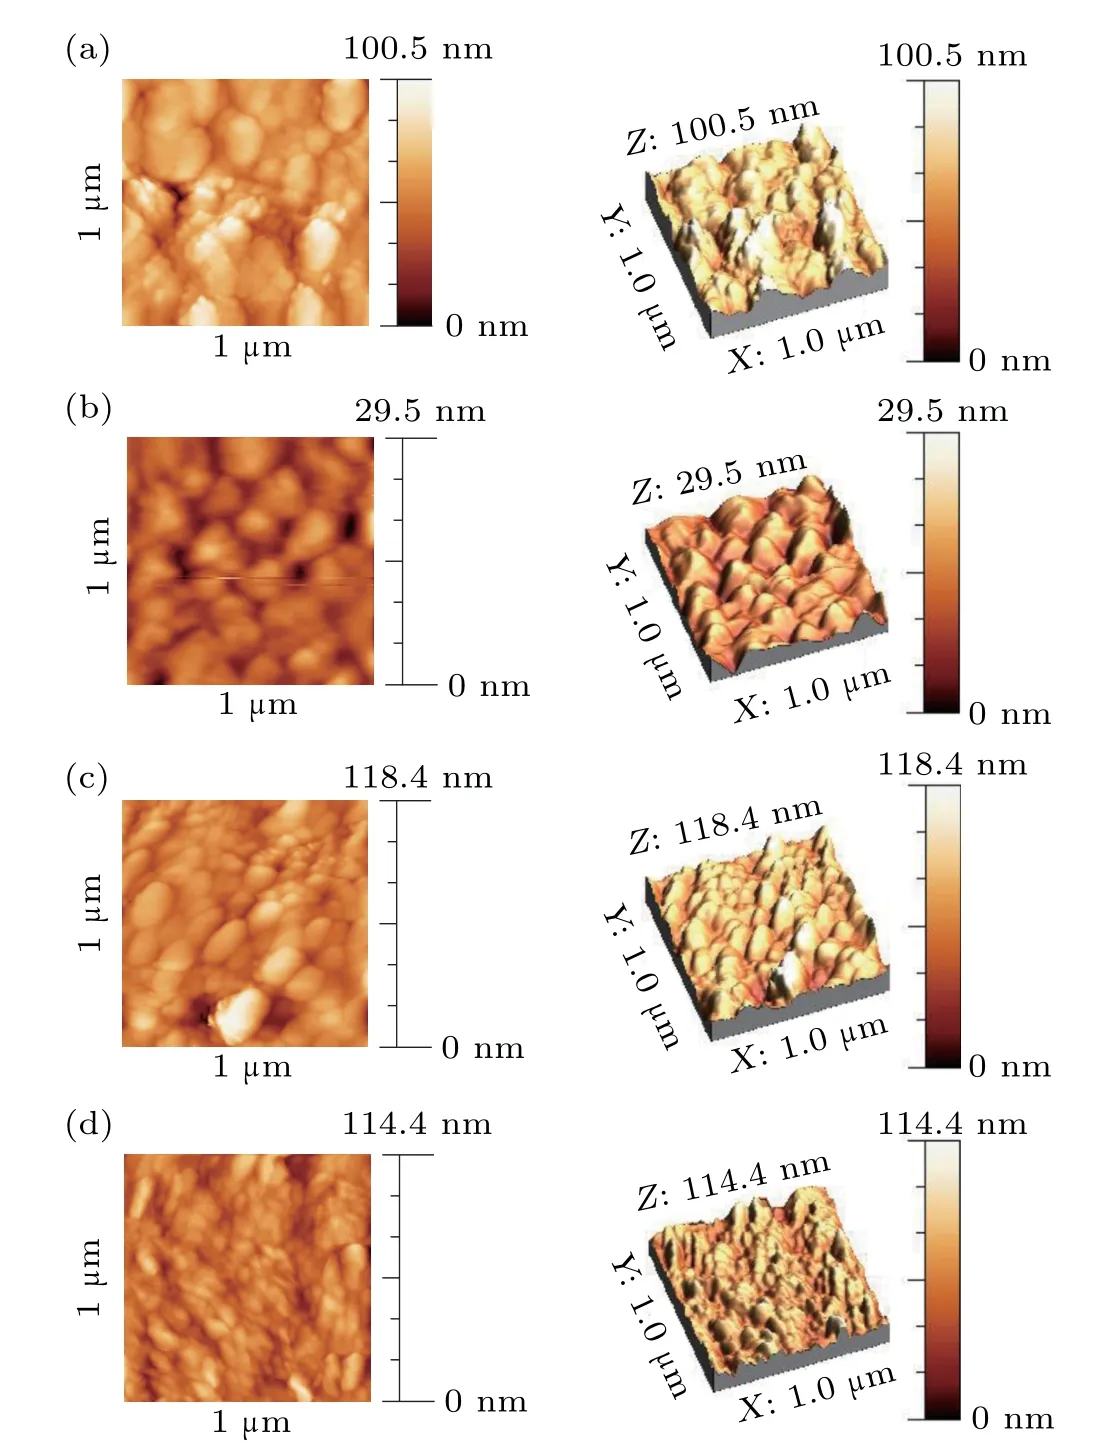
Fig.2. AFM images of nano rods produced at different deposition angles of(a)0°,(b)30°,(c)45° and(d)60°.
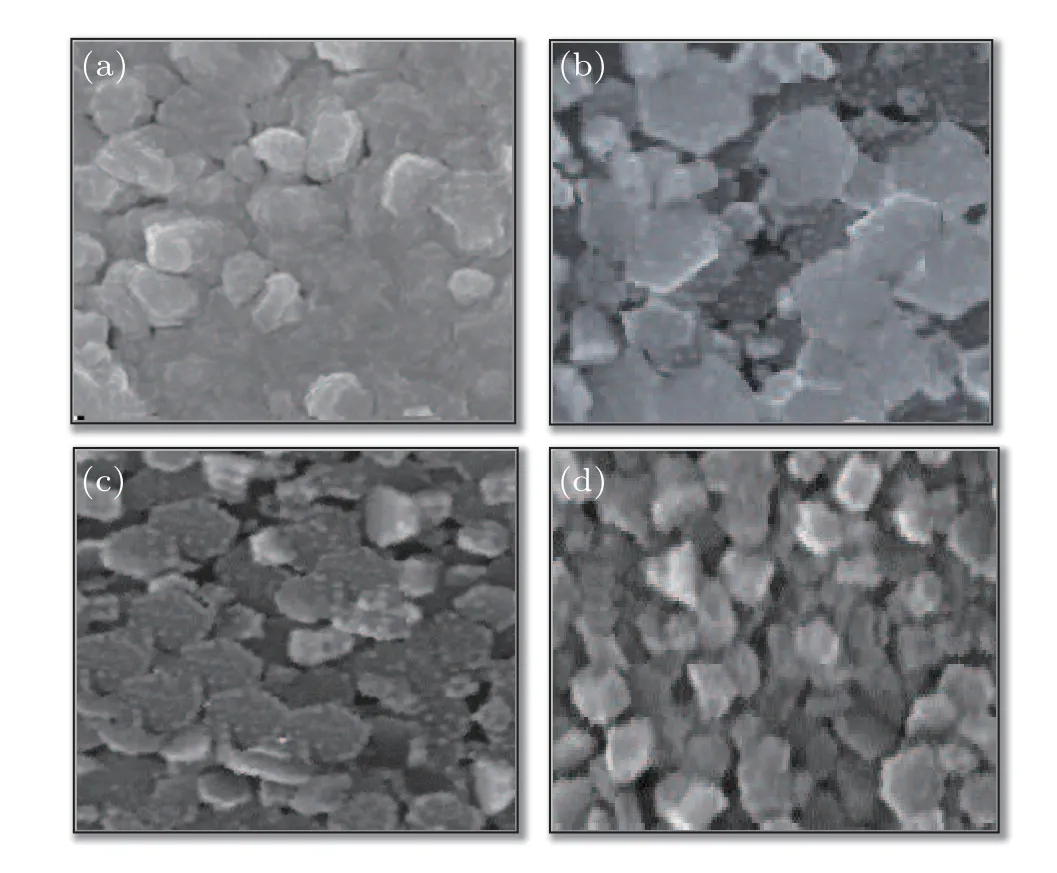
Fig.3. FESEM images of nano rods produced at different deposition angles of(a)0°,(b)30°,(c)45° and(d)60°.
4.2. XRD results
Figures 4(a)-4(d) show the XRD pattern of ZnO nano rods formed at different deposition angle. It is clear from the figure that the spectrum of all samples has 8 diffraction peaks. The peaks at the diffraction angles of 2θ=38.99°,2θ= 43.22°, 2θ= 54.32°, and 2θ= 70.63°indicate the growth of the Zn (100), Zn (101), Zn (102), and Zn (110)phases, respectively (Standard Card No. C0087-713) and the existing peaks at 2θ=31.85°,2θ=34.55°,2θ=36.35°,and 2θ=77.22°diffraction angles represent the ZnO(100),ZnO(102), ZnO (101), and Zno (202) phases, respectively (Standard Card No.C00-079-0205).
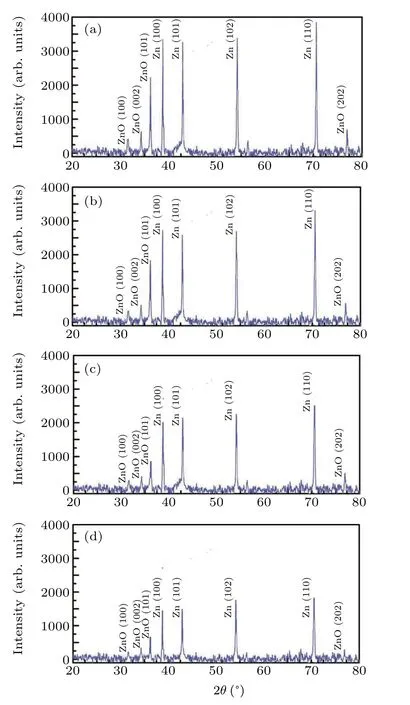
Fig.4. XRD spectrum of nano rods produced at different deposition angles of(a)0°,(b)30°,(c)45° and(d)60°.
It is clear from the figures that with increasing the deposition angle, the intensity of all phases of zinc and zinc oxide decreases so that all phases have the lowest intensity in the deposition angle of 60°and even some of the oxide phase diffraction peaks disappeared in this deposition. This is due to the smaller grain size due to the reduction of the diffusion phenomenon due to the increase of the shadowing effect.
4.3. XPS depth profile results
The XPS results of nano rods formed at different deposition angles of 0°, 30°, 45°, and 60°are shown in Figs. 5(a)-5(d), respectively. These figures show that by forming a zinc nano rod and oxidizing it in the oxygen flux, the whole nano rod is not oxidized.These results showed that only a thin layer of oxide is formed on the surface of the nano rods. To calculate the approximate thickness of the oxide layer, a distance from the surface of the nano rod was considered that the oxide intensity reached half of its maximum value. Using these calculation,the oxide layer thickness for Zn nano rods deposited at different deposition angles of 0°,30°,45°,and 60°,and annealed at oxygen flux was obtained as 33 nm, 35 nm, 40 nm,and 45 nm, respectively. These results are given in the last column of Table 1.
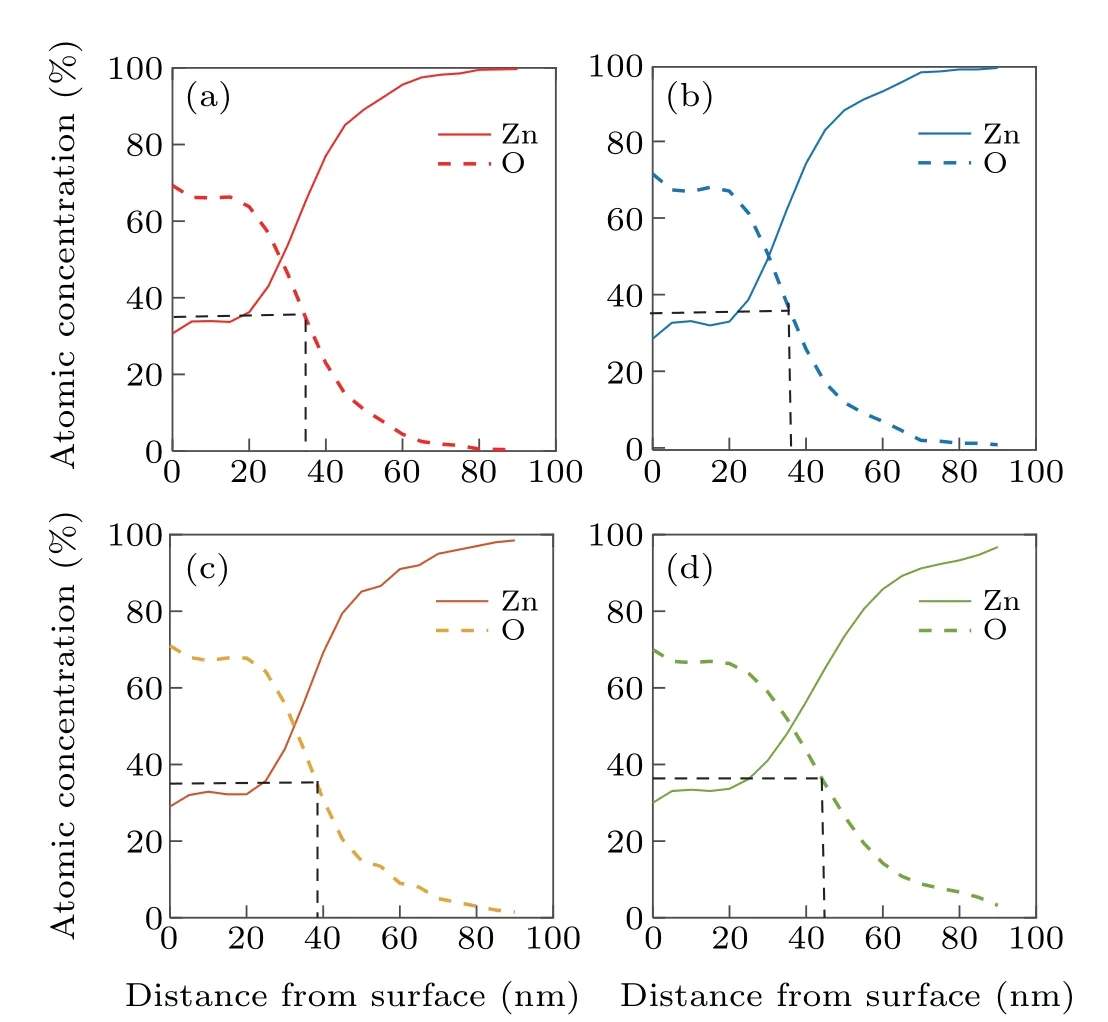
Fig.5.XPS depth profile of nano rods produced at different deposition angles of(a)0°,(b)30°,(c)45° and(d)60°.
As the results show,with increasing deposition angle,the thickness of the oxide layer increase. The reason for this increase is the increase in porosity and the increase in the cross section of the oxygen gas collision with increasing the deposition angle.
4.4. Optical results
Figure 6 shows the transmission (T) and reflection (R)spectra of nano rod structures formed at different deposition angles of 0°, 3°, 45°, and 60°, for p-polarized light at 10°incident light angle. It is clear from the figure that the structures formed at the 0°deposition angle have less amount of transmission and reflection than the structures formed at other deposition angles, and the transmission of these structures is about 0%. As the deposition angle increases, the transmission and reflection increase. The reason for the increase in transmission and reflection with increasing deposition angle is increasing of the porosity with increasing deposition angle.Because with increasing deposition angle, the shadow effect increases,thus the porosity of the structures increases.
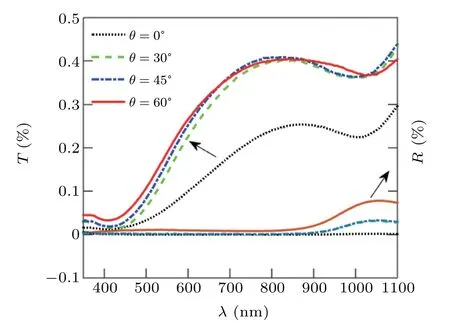
Fig.6. Optical spectrum(T: transmittance,R: reflection)of nano rods produced at different deposition angles.
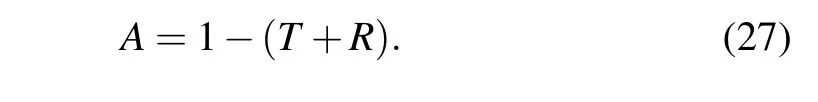
Although with deposition angle increasing,due to the increase in the porosity of structures,the transmission increase,but nevertheless,the transmission of structures is less than ten percent. This indicates that although the structures were annealed in the oxygen flux and the x-ray diffraction pattern was indicated the presence of ZnO peak, these structures tend to behave metallically. The absorption spectra of these structure,calculated from Eq.(27),and shown in Fig.7,indicate that the structures have a very high absorption intensity, which confirms the metal behavior of the structures. Because semiconductor structures are transparent in the visible region of light(for semiconductor structures,the percentage of transmission,especially in the visible region, is much higher than the absorption) the annealed Zn nano rods in oxygen flux in this work, cannot be semiconductor nano rods. In fact, because of almost 0%transmittance,Zn nano rods annealed in oxygen flu,behave like metal.
It is clear from the figure that the structures formed at the 0°deposition angle have the highest amount of absorption due to the lowest porosity. The absorption spectrum of this structure has two absorption peaks at wavelengths of 430 nm and 1015 nm,which are due to plasmonic oscillations. That is,the structures have a metal behavior and the absorption of structures is done in the form of plasmonic oscillations. As the deposition angle increases,the absorption of the structures decreases due to the increase in the porosity of the samples. This figure shows that by increasing of deposition angle,main peak(first peak) of absorption spectra shift toward shorter wavelengths.
Because the basis of adsorption in these structures is plasmonic oscillation. The first peak is the longitudinal mode and indicates oscillations along the axis of the nano rods(oscillations due to the electric field component along the line perpendicular to the substrate). With increasing the deposition angle, the field component increases in this direction, so the amplitude of oscillations decreases and the longitudinal mode shifts to short wavelengths.[1,2]With increasing deposition angle, due to the reduction of the number of oscillations in the direction perpendicular to the axis of the nanorod,the absorption intensity decreases at long wavelengths.
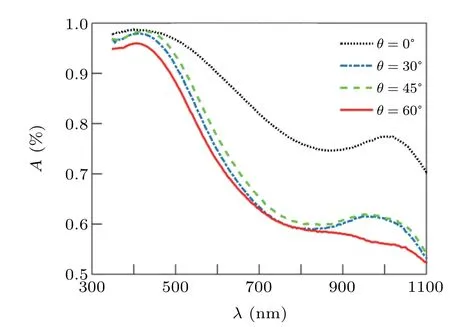
Fig. 7. Absorption spectrum of nano rods produced at different deposition angles.
4.5. Refractive index
The complex refractive indexes of the Zn nano rods(produced at different deposition angles of 0°, 30°, 45°, and 60°and annealed in oxygen flux)were calculated using the reverse homogenization theory, and void fractions of these structures were obtained.
Table 1 shows the void fraction (porosity percentage) of the nano rods produced at different deposition angles. It is clear from the results that with increasing deposition angle,due to the increase of shading effect,the porosity of the films increases. The percentage of porosity obtained from the reverse homogenization theory, for nano rods produced at different deposition angles of 0°,30°,45°and 60°,is 0%,15%,26%, and 40% respectively. These results are in good agreement with the results obtained by other researchers.[65]
In previous works by researchers, both experimentally and theoretically (using other theories), the porosity of nano rods produced at different deposition angles of 0,30,45,and 60 reported to be 0%, 10%, 20%, and 40% respectively.[65]These results show that the theory of homogenization is in good agreement with their theory.
The fit between the theoretical and experimental results of the transmission and reflection spectrum, which was performed to calculate the refractive index of the produced nano rod structures at different deposition angle,is shown in Fig.8.The refractive index obtained from the fit between the theoretical and experimental results for the nano rod structures at the 0°deposition angle,is given in Fig.6 and compared with the Zn and ZnO bulk refractive index. Figures 9(a) and 9(b)show the the real part (n) and imaginary (k) part of the complex refractive indexes(N=n+ik)respectively.Results show that the refractive index obtained for Zn nano rods annealed in oxygen flux behaves similarly to the behavior of the metal,and its changes with wavelength are similar to the changes of the refractive index of Zn with wavelength,but its value is reduce.
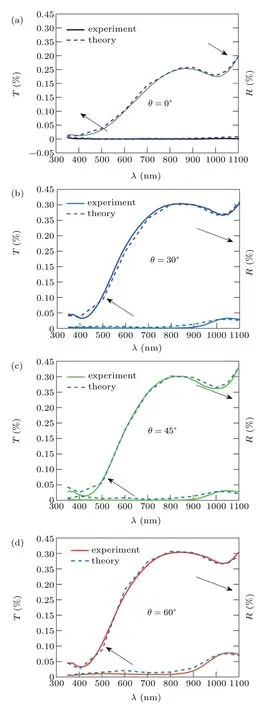
Fig.8.Fitting of experimental and theoretical optical spectrums for refractive index calculation.
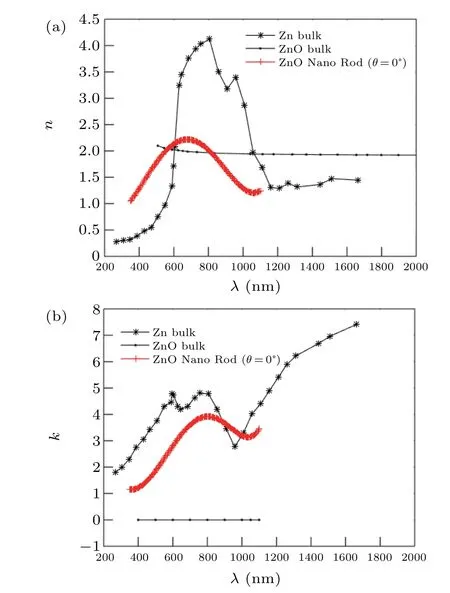
Fig.9. Refractive index comparison of annealed Zn nano rod in oxygen flux (10° deposition angle), bulk Zn and bulk ZnO, (a) real part and (b)imaginary part.
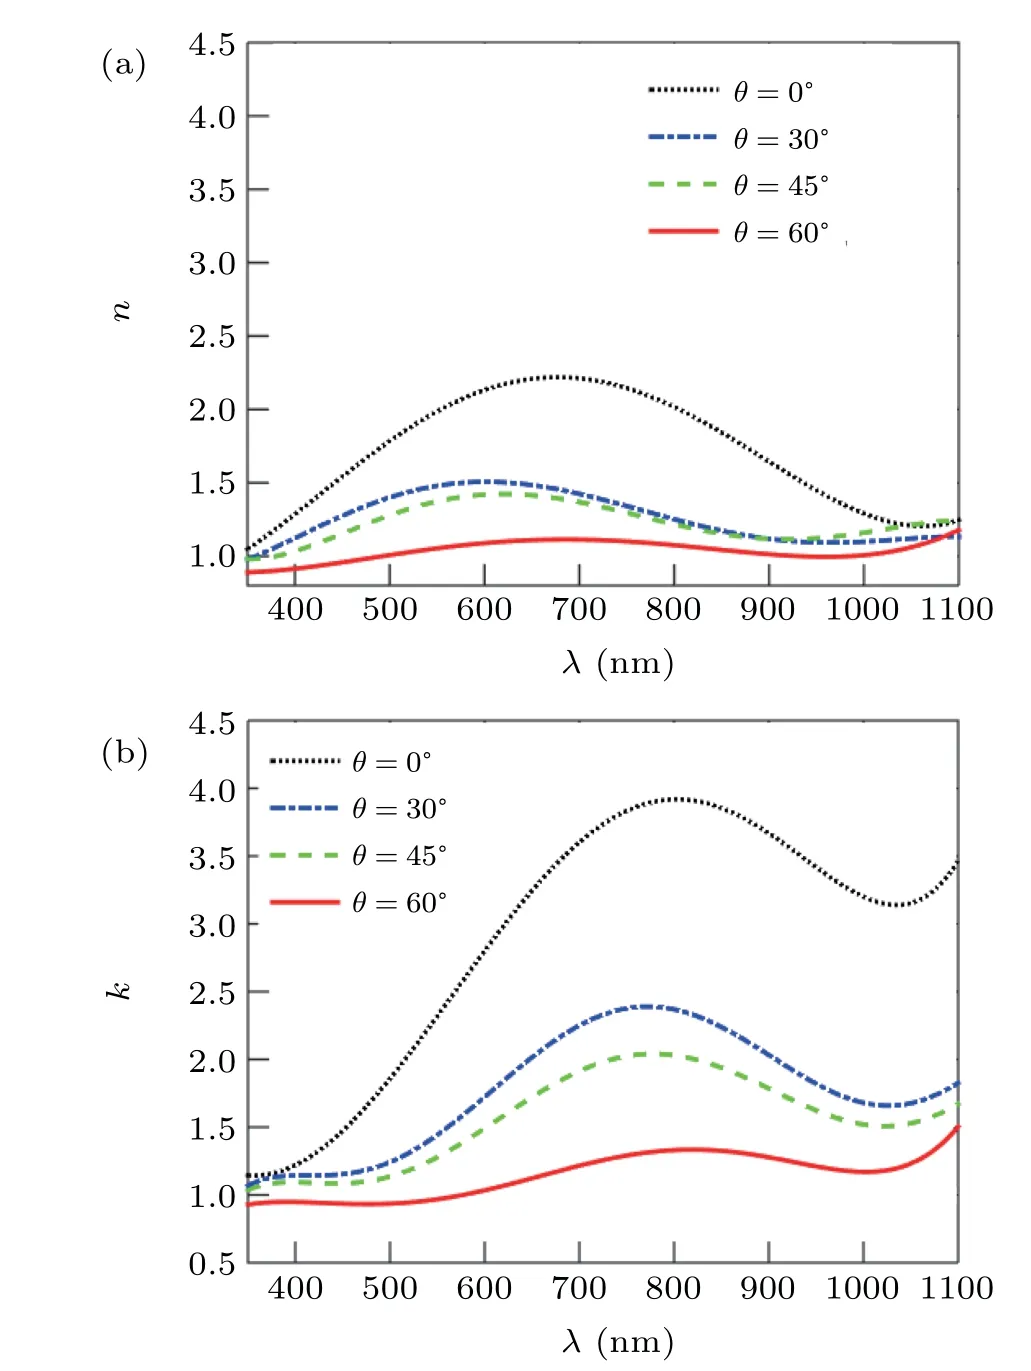
Fig.10. Refractive index of annealed Zn nano rod deposited at different deposition angles of 0°,30°,45°,and 60°,(a)real part and(b)imaginary part.
The refractive index obtained from this fit for nano rods produced at different deposition angles is shown in Fig.10. It is clear from the results that the structures formed at 0°deposition angle have the highest real part (n) and imaginary part(k) of refractive index because these structures have the least porosity and the highest absorption. Increasing the porosity and decreasing the absorption, the imaginary and real part of the refractive index decreases. As can be seen from the figure,the imaginary part of the refractive index has a peak that shifts toward shorter wavelengths by increasing the deposition angle.This is in good agreement with the results of the absorption spectrum. Because with increasing the deposition angle,main peak (first peak) of the absorption spectra was shifted to short wavelengths (longitudinal mode shift toward shorter wavelength results(first peak in experimental absorption spectra)).
4.6. Permittivity and optical conductivity
Permittivity of the samples calculated from relations bellow are shown in Fig.8:
Figures 11(a)and 11(b)show real and imaginary parts of the permittivity respectively for the samples produced at different deposition angles of 0°,30°,45°,and 60°.
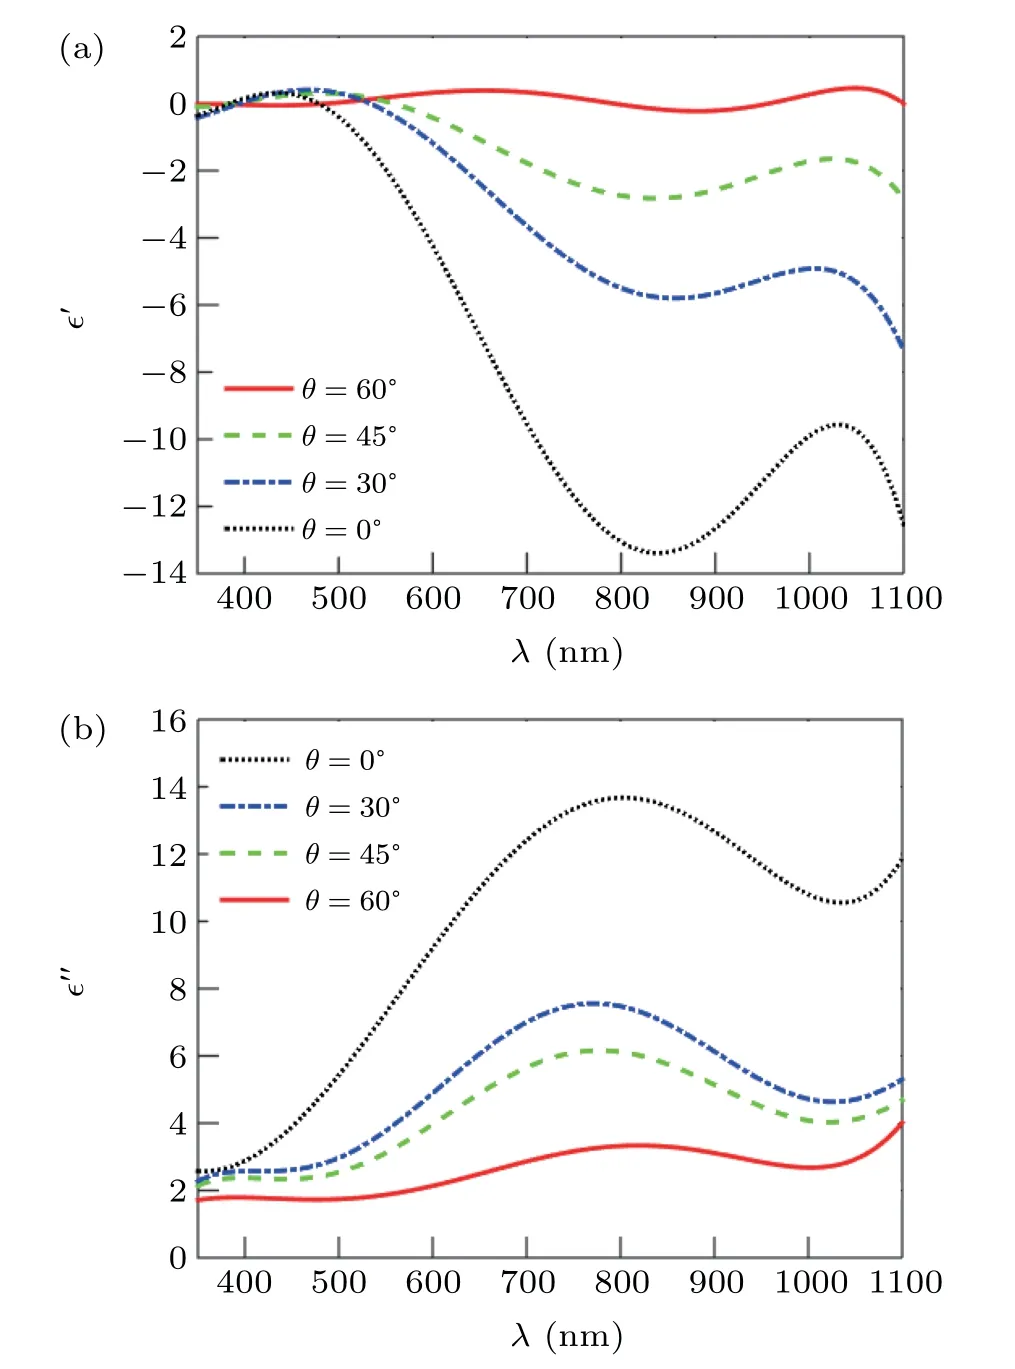
Fig.11. Permittivity of annealed Zn nano rod deposited at different deposition angles of 0°,30°,45°,and 60°,(a)real part and(b)imaginary part.
It is clear from the figure that all of the structures have negative real part of the permittivity, and this indicates the metal behavior of the structures. It is known that, If the real part of the permittivity has a negative sign, it means that the excited field is in opposite direction to the external field, and this phenomenon seen in metallic material. This indicates that only the outer surface of the nano rods has a very thin oxide and in general,these structures show metallic behavior.
Real part of the permittivity represents the ability of the material to store the electric energy, or in terms the ability to permit the electric field go through it. On the other word,real part of permittivity is the lossless permittivity(due toLandC)and the imaginary part represents the loss in the energy and indicates the ohmic resistance of the material and energy lost as heat(R). Also the imaginary part of the dielectric function describes the density of the plasmon excitations in a system.[66]
On the other words, the larger the imaginary part, the better the conductivity of the material. Figure 8 shows that the structure formed at a 0°deposition angle has the highest amount of real and imaginary part of the permittivity among all of the samples. Also the figure shows that,with increasing the deposition angle, the imaginary part decreases, which indicates a decrease in the conductivity of these structures with increasing deposition angle. The optical conductivityσobtained from the relationε''=(σ/2πυ) whichνis the oscillation frequency andλis the wavelength is shown in Fig.12.This figure shows that the structure formed at a 0°deposition angle have the highest conductivity and with increasing the deposition angle,the conductivity of the structures decreases,which is due to the increase in porosity with increasing deposition angle.

Fig.12. Conductivity of annealed Zn nano rod deposited at different deposition angles of 0°,30°,45°,and 60°,(a)real part and(b)imaginary part.
5. Conclusion
In this work,Zn nano rods were fabricated on glass substrates using oblique deposition method at different deposition angles of 0°, 30°, 45°and 60°and were subjected to flux of oxygen gas for oxidation. Using the laws of Tate and tangent,the angle of the nano rods with the line perpendicular to the substrate was obtained. The transmission, reflection and absorption spectra of the structures were obtained using a spectrophotometer for p-polarization light at 10°incident light angle and the spectral changes were investigated by changing the deposition angle. The results showed that the structure produced at 0°deposition angle has the highest absorption and the lowest value for transmission and reflection so that the transmission of these structures is 0%. These results indicate the metallic behavior of the annealed Zn nano rods in the oxygen flux. As the deposition angle increases, the absorption of the structures decreases and the reflection increases so that the increase in transmission is very small. The reason for the decrease in adsorption with increasing deposition angle was attributed to the increase in porosity with increasing deposition angle, due to the increase in shadowing effect by increasing the deposition angle. Examination of these spectrums showed that absorption is the predominant phenomenon for all structure, indicating that the structures exhibit metallic behavior despite being oxidized (the XRD spectrum also confirmed the formation of the zno phase). This indicates that only the outer surface of the nano rods has a very thin oxide,and in genera these structures behavior as metallic structure.
For further investigation, the percentage of porosity as well as the complex refractive index of the structures were calculated using reverse homogenization theory and from the fit of the experimental and theoretical results.The results showed that with increasing the deposition angle, the void fraction of the structures increases and the real and imaginary part of the refractive index decreases. The decrease in the real and imaginary parts of the refractive index with increasing deposition angle was attributed to the increase in porosity and the decrease in absorption of the structures. For better investigation,the permeability and conductivity of the structures were obtained and it was found that the structures have a negative real part of permeability and this confirms the metallic behavior of the structures. The results also showed that with increasing the deposition angle,the conductivity decrease,which was attributed to the increase in porosity with increasing the deposition angle.
Acknowledgment
Fatemeh Abdi is grateful to the Iran National Science Foundation(INSF)for partial support of this work.

- Chinese Physics B的其它文章
- Numerical investigation on threading dislocation bending with InAs/GaAs quantum dots*
- Connes distance of 2D harmonic oscillators in quantum phase space*
- Effect of external electric field on the terahertz transmission characteristics of electrolyte solutions*
- Classical-field description of Bose-Einstein condensation of parallel light in a nonlinear optical cavity*
- Dense coding capacity in correlated noisy channels with weak measurement*
- Probability density and oscillating period of magnetopolaron in parabolic quantum dot in the presence of Rashba effect and temperature*