
Parameter optimization of control system design for uncertain wireless power transfer systems using modified genetic algorithm
2022-12-31 03:44XudongGaoWenjieCaoQiangYangHonglinWangXiaoleiWangGuangJinJunZhang
Xudong Gao|Wenjie Cao|Qiang Yang|Honglin Wang|Xiaolei Wang|Guang Jin|Jun Zhang
1School of Artificial Intelligence/School of Future Technology,Nanjing University of Information Science and Technology,Nanjing,China
2School of Electronic and Information,Zhongyuan University of Technology,Zhengzhou,China
3Graduate School of Engineering,Tokyo University of Agriculture and Technology,Koganei,Tokyo,Japan
Abstract The closed‐loop wireless power transfer(WPT)system can realize constant voltage output in the presence of perturbation.However,the parameter design of the controller is a difficult problem.The traditional trial‐and‐error method is time‐consuming and difficult to find optimal parameters.A parameter optimization strategy of control systems for uncertain WPT systems using the modified genetic algorithm(MGA)is proposed.Firstly,because the system has different characteristics at different periods,the simulation process is divided into three stages.The first one is the start‐up stage,in which we mainly consider the overshoot and the rate of the voltage rise.The second one is the tracking stage,in which the tracking time and switching loss are mainly considered.The third one is the stabilisation stage,in which the steady‐state error and switching loss are mainly considered.Secondly,three cost functions are designed according to the characteristics of the three stages,and then the optimal controller parameters of each stage are obtained by using MGA.Finally,the effectiveness of the proposed method is verified by simulation.The optimization results show that compared with the previous parameter optimization method,the optimal controller parameters obtained by the proposed method make the WPT system achieve better performance.
1|INTRODUCTION
Wireless power transfer(WPT),as a new energy transfer method,has changed the way we use energy and has the characteristics of flexibility,position‐free,and movability.It has been widely used in undersea applications[1,2],implanted medical devices[3–5],electric vehicles[6,7],Internet of Things(IoT)devices[8],and so forth.However,there are still many problems to be solved before WPT technology can achieve leapfrog development,such as displacement flexibility,electromagnetic interference,and output voltage fluctuation[9],where the variation of the output voltage will degrade the system performance,such as the decrease of voltage will cause the increase of equipment loss and serious heating[10].
In order to achieve output voltage regulation,a lot of research studies have been done,such as utilising primary and secondary communication to regulate output voltage[11],using the voltage and current of the primary side to adjust the output voltage[12],and using the DC‐DC converter in the treceiving side to manage the final output voltage[13].Among them,the DC‐DC converter used in the receiving circuit is a common method because of its simple topology,modelling does not require complex mathematical derivation and ability to continuously tune the parameters in WPT systems.
Many control schemes are used in WPT systems with the DC‐DC circuit,such as the tneural network method[14,15],the model predictive control method[16–18],the sliding mode control(SMC)method[19–22],and so on.Sliding mode control is considered as a promising control method because of its fast response,simple design,and insensitivity to disturbance.However,how to obtain the optimal controller parameter combination is an open and challenging problem.
In[23],Komurcugil presented a non‐singular terminal sliding mode control method for DC‐DC buck converters and compared it with sliding‐mode implementation of proportional integral derivative control(SM‐PID)method and conventional SMC method.The steady‐state error obtained by these three methods was 3.2mV,4.5,and 9mV,respectively.Although it is improved to a certain extent compared with SMC and SM‐PID control methods,the parameters of the controller are obtained by observing experimental phenomena,so the search process of optimal parameters is time‐consuming and inaccurate.Moreover,only the robustness of the controller itself is used,and there is no special robust algorithm to maintain the stability of the system.
In order to solve parameter optimization problem,[24]proposed a parameter optimization strategy by using ant colony optimization(ACO).By using ACO to optimise the controller parameters,the switch pressure is relieved and the tracking performance is improved.Although the method has some improvement compared with the observation method,there are still two problems.First,the simulation process is considered as a whole without considering the characteristics of the system at different periods.Second,only the optimization of sliding coefficientαwas considered,and the hysteresis modulation method hysteresis bandhwas not considered.So,previous methods were either time‐consuming[23]or did not consider the characteristics of the WPT system at different periods[24].
An operator‐based robust right coprime factorization approach could be used to guarantee the bounded input and bounded output stability of nonlinear systems[25–28].Since the approach is useful when dealing with robust stability of the nonlinear system[29–31],it has been adopted in many industrial applications,such as L‐shaped arm,Peltier actuated thermal process,and so on[32–34].In this paper,we use this method to guarantee the robust stability of the WPT system.
According to the characteristics of each stage of the WPT system,a multi‐stage parameter optimization strategy by using operator theory and modified genetic algorithm(MGA)is proposed in this paper.First,operator‐based right coprime factorization could be used to guarantee the robust stability of the WPT system.Besides,according to the characteristics of the system itself,the simulation process is divided into three stages:start‐up stage,tracking stage,and stabilisation stage.The first stage is the start‐up stage.The moment the equipment is powered on,there will be a large current overshoot.We should try to avoid this phenomenon and at the same time ensure that the rate of voltage rises.The second stage is the tracking stage,in which we ensure the output voltage of the system can quickly reach the reference voltage we set and minimise switching loss.The third stage is the stabilisation stage,after the output voltage of the system reaches the reference voltage,we should try our best to keep the voltage near the reference voltage and reduce the switch vibration.In this way,the system can be guaranteed to achieve optimal performance at every stage.
The rest of this article is organised as follows.Section 2 introduces the preliminaries and states the problem.Section 3 describes the proposed multi‐stage parameter optimization strategy.Section 4 shows the simulation results.Finally,conclusions are summarised in Section 5.
2|PRELIMINARIES AND PROBLEM STATEMENTS
2.1|Modelling of the WPT system with a buck circuit
The circuit diagram of the open‐loop WPT system is shown in Figure 1,which is composed of three parts:coupling system,full‐bridge rectifier,and DC‐DC buck converter.The mathematical modellingPof the WPT system is as follows.

whereD1is the duty cycle of switchS,eis the Euler's constant,and
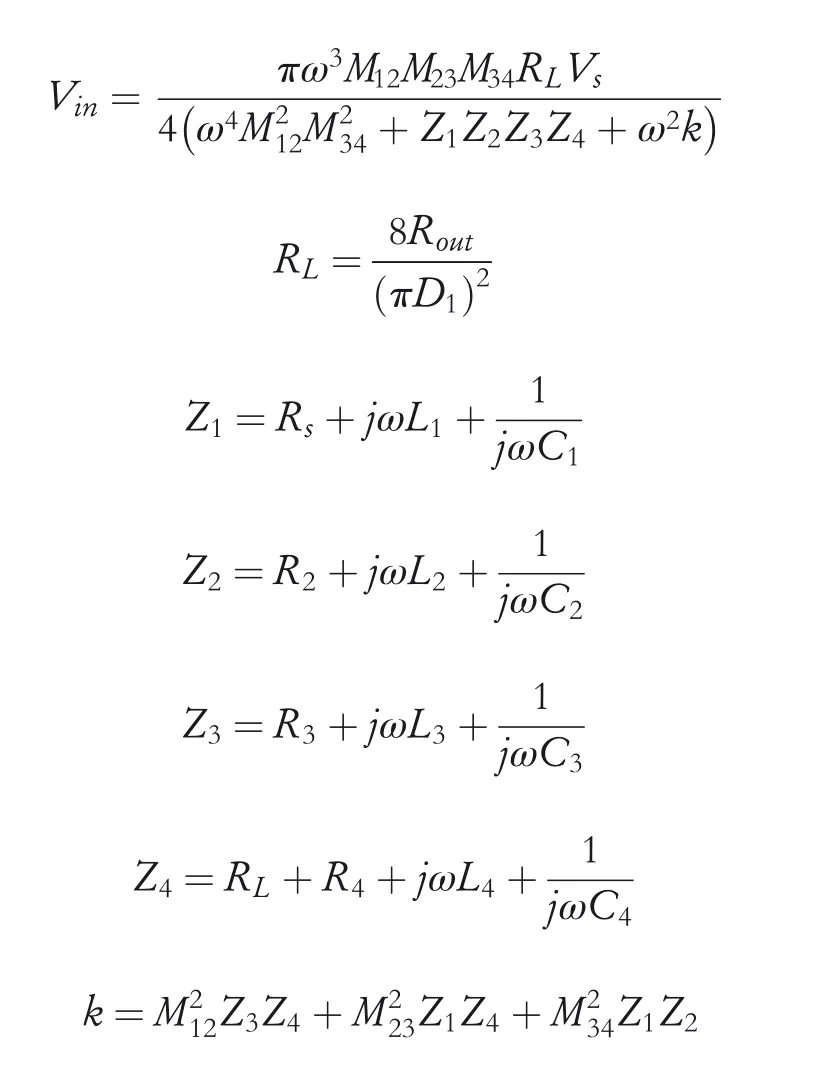

FIGURE 1 Circuit diagram of the open‐loop wireless power transfer(WPT)system

The value of each component of the WPT system is shown in Table 1.
2.2|Sliding mode control
Sliding mode control is a relatively simple control method.The key of the design of sliding mode controller is to design sliding mode surfacesand the control lawu,and the specific forms are shown in equations(3)and(4).


TABLE 1 Specification of the wireless power transfer(WPT)system

whereu+(x)≠u?(x).
Generally,in the reaching state,the state variables move rapidly to the sliding mode surface under the action of the control lawu.Then,the state variables converge to zero and enter the sliding mode.To keep the error variables along the sliding surface,the inequality(5)needs to be satisfied.

2.3|Genetic algorithm
Genetic algorithm is an optimization model that simulates Darwinian evolution,commonly used in image processing,pattern recognition,and combinational optimization problem.It was first proposed by Professor Holland and his students in 1970 and is mainly used for adaptive search and adaptive system design.The genetic algorithm has been proven to be an effective strategy by many users in design of control systems.For example,Yang used the genetic algorithm to obtain the optimal parameters of the H‐Infinite controller[10].Dang used the genetic algorithm to obtain the optimal parameters of fuzzy controller,which can ensure the robust stability of the dynamic positioning system(DPs)and improve the quality of the system even if there is environment influence[35].
2.4|Operator‐based control system design
The proposed robust controller based on an operator theory for the uncertain WPT system is shown in Figure 2,whereris the reference signalVref,yis the output voltageVout,andVinis a variable voltage described in(2).
The mathematical plantP+ΔPof the WPT system considering the uncertainties can be expressed as follows:

whereΔis the uncertain term of the WPT system(‖Δ‖<1).
The plant can be right factorised as follows:

FIGURE 2 Proposed robust controller based on the operator theory

The operatorsAandBare shown in equations(9)and(10).

whereA=N?1.
Then,compensatorsCandχ1using sliding mode technology are as follows:

whereKis a designed number satisfyingK>1 andα>0.The tracking performance of the system can be guaranteed by using the compensators.
2.5|Problems statements
Based on the strategy of multi‐stage optimization,in this paper,we divide the simulation process into three stages.The goal of the first stage is to obtain small current overshoot and fast rate of voltage rise,the goal of the second stage is to obtain fast tracking time and small switching fluctuation,and the goal of the third stage is to obtain small steady‐state error and switch fluctuation.For our purpose,we use MGA to get the optimal combination of controller parameters.
3|MAIN RESULT
3.1|Cost function design
In order to find the optimal combination of parameters at each stage,in this paper,we design a cost function for each stage,Q1for the start‐up stage,Q2for the tracking stage,andQ3for the stabilisation stage.And each stage has two indicators for evaluating system performance.
For cost functionQ1described in(15),it is used to balance overshoot and voltage rise rate.Its two indicators corresponding tof11,andf12are calculated as

wheret0is the start time,t1is the time step for measuring the current overshoot indicator,iLis the real‐time inductance current of buck circuit,i*Lis the maximum current limit,andv1is the voltage at timet1.
For cost functionQ2described in(18),it is used to balance tracking time and switching vibration.Its two indicators corresponding tof21,andf22are calculated as

wheret2is the critical moment after which the error between the reference voltage and output voltage is less than 0.02 and?2is the number of switch vibration in the tracking stage.
For cost functionQ3described in(21),it is used to balance steady‐state error and switching vibration.Its two indicators corresponding tof31,andf32are calculated as

wheret3is the end time of simulation,vois the system output voltage(load voltage),Vrefis the output reference voltage,and?3indicates the number of switching fluctuation.
In the above formula,ωijis the penalty factor of each indicator and represents the contribution to the cost functionQn,where{i|i=1,2,3},{j|j=1,2},{n|n=1,2,3}.The specification of constants in the cost functionQnis shown in Table 2.And the specification of penalty factors of the cost functions at each stage is shown in Table 3,Table 4,and Table 5,respectively.
3.2|Analysis of the performance of designed parameters
To investigate the impact of the operator‐based control system parameters on system performance at different stages,three groups of figures are shown in Figure 3,Figure 4,and Figure 5.In the three groups of figures,(a)indicates the impact of the operator‐based control system parameterhon systemperformance,and(b)indicates the impact of the operator‐based control system parameterαon system performance.

TABLE 2 Specification of constants in the cost functions

TABLE 3 Specification of penalty factor of the cost function Q1

TABLE 4 Specification of penalty factor of the cost function Q2

TABLE 5 Specification of penalty factor of the cost function Q3
In Figure 3a,you can see that the reciprocal of voltage rise rate fluctuates obviously on the whole,and the current overshoot changes little with the increase ofh.In Figure 3b,whenαis less than 33,there is no obvious current overshoot,and then the current overshoot begins to appear,which indicates that the system performance deteriorates.For the reciprocal of voltage rise rate,whenαless than 33,the curve shows a downward trend,indicating that the output voltage shows an upward trend att1,and this indicator increases significantly from 32 to 33,after which the change is no longer significant.In Figure 4a,whenhis less than 0.77 with the increase ofh,the tracking time curve generally shows an upward trend representing the tracking time is getting longer and then decreases rapidly.For switch vibration,the curve shows a gradual downward trend with the increase ofh,which means less switching loss.In Figure 4b,whenαis less than 32,the tracking time curve shows a sharp downward trend meaning that the less tracking time and better system performance,with a significant increase from 32 to 33 and a gradual decline thereafter.For the switch vibration,the curve shows a downward trend on the whole,which means that the switch loss is decreasing with the increase ofα.Whenαis less than 33,the curve shows a gradual downward trend with a sharp decline from 33 to 34 and a steady decline thereafter.In Figure 5a,whenhis less than 0.77,the steady‐state error curve shows a steady upward trend,rising sharply from 0.77 to 0.82,and then presents a trend of fluctuation.For switch vibration,the curve shows a downward trend.In Figure 5b,both the steady‐state error curve and the switch vibration curve show a downward trend with the increase ofα,which means better system performance.

FIGURE 3 The impact of the operator‐based control system parameters on cost function Q1 indicator f11,f12.(a)Impact of operator‐based control system parameter h on the wireless power transfer(WPT)system performance indicators at stage 1.(b)Impact of the operator‐based control system parameter α on the WPT system performance indicators at stage 1
Figures 3–5 show that the control system parameters greatly affect the WPT system performance,and it is not realistic to get the optimal combination of parameters through the traditional observation method.On the one hand,the control system has more than one parameter and the parameters are interdependent.On the other hand,the curve of each system indicator is non‐monotonic,which also increases the difficulty of parameter selection.Control system parameter selection is a very time‐consuming process,and it is difficult to get the optimal parameters,so it is very necessary to use MGA to select the optimal control system parameters.
3.3|MGA parameter settings

FIGURE 4 The impact of the operator‐based control system parameters on cost function Q2 indicator f21,f22.(a)Impact of the operator‐based control system parameter h on the wireless power transfer(WPT)system performance indicators at stage 2.(b)Impact of the operator‐based control system parameter α on the WPT system performance indicators at stage 2
The optimization range of the key parameters for MGA is shown in Table 6,and the optimal values of key parameters at each stage are shown in Table 7.The influence of crossover probability and mutation probability on fitness at each stage is shown in Figure 6,Figure 7,and Figure 8,respectively,whereXaxis represents the crossover probabilityPc,Yaxis represents mutation probabilityPm,andZ‐axis represents fitness,which is the average of 30 programme runs.The star represents the optimal parameters.
3.4|Searching for optimal parameters
The main procedure for searching the optimal parametersαandhat each stage is as follows.
Step1(Initialisation):Initialise population randomly by

wherepopis the population size,nis the number of the decision variable,andlengthis the coding length of a single decision variable,the phenotype for each genotypeXicorresponds to a combination of the control system parametersαandh,and its corresponding performance indicators are used to calculate the cost functionQn.

FIGURE 5 The influence of the operator‐based control system parameters on cost function Q3 indicator f31,f32.(a)Impact of the operator‐based control system parameter h on the wireless power transfer(WPT)system performance indicators at stage 3.(b)Impact of the operator‐based control system parameter α on the WPT system performance indicators at stage 3

TABLE 6 The optimization range of the crossover probability Pc and mutation probability Pm for the modified genetic algorithm(MGA)

TABLE 7 The optimal value of the crossover probability Pc and mutation probability Pm for the modified genetic algorithm(MGA)at each stage
Step2(Selection):Use roulette as the selection operator.


FIGURE 6 The influence of crossover probability Pc and mutation probability Pm on fitness at stage 1

FIGURE 7 The influence of crossover probability Pc and mutation probability Pm on fitness at stage 2
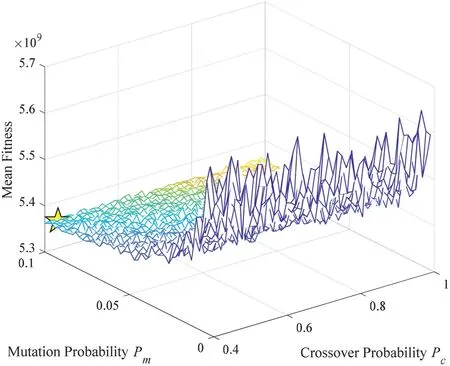
FIGURE 8 The influence of crossover probability Pc and mutation probability Pm on fitness at stage 3
whereris a random number between 0 and 1,qis the cumulative probability,andVjis the individual selected to enter the next generation.Obviously,individuals who can make the WPT system perform better at this stage have a greater chance of being selected.
Step3(Crossover):If the random number generated byrandis less than the crossover probabilityPc,the crossover operation is performed by

whereκis the intersection.After that,progeny can have individuals that are different from their parents,that is,different combinations of control system parameters.
Step4(Mutation):The mutation of chromosomes acts on genes.For each gene of chromosomes in the new population after crossover operation,the mutation probabilityPmwill be used to judge whether the gene position is mutated by

Step5:Judge whether the programme satisfies the termination condition.If so,end the programme and output the optimal solution(corresponding to the optimal combination ofαandhat this stage),otherwise back to Step 2.
The pseudocode of MGA is shown in Algorithm 1.
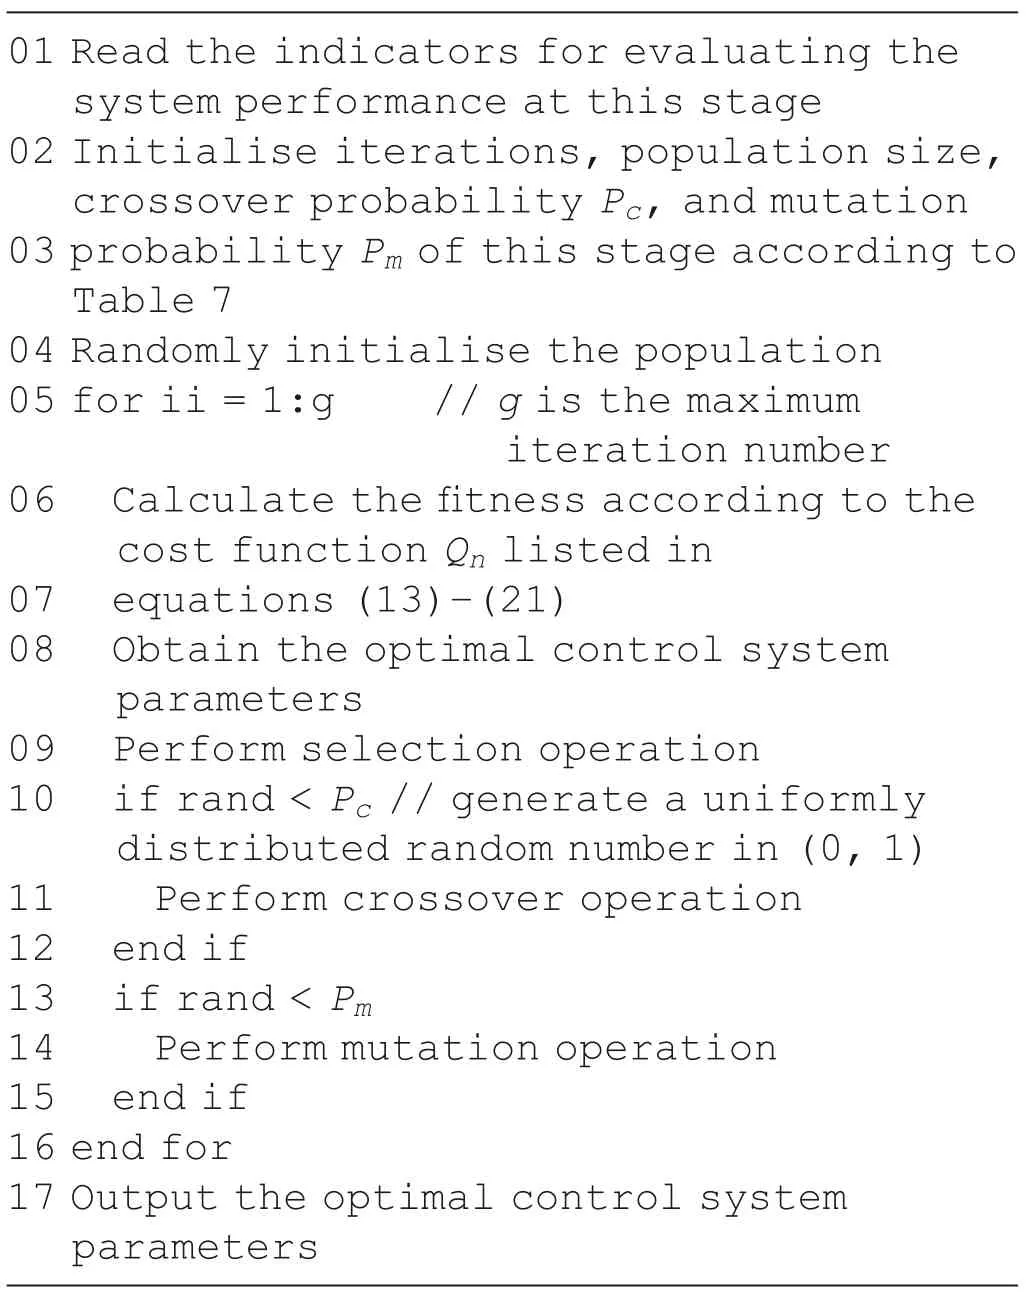
Algorithm 1 Modified genetic algorithm to search optimal parameters
4|SIMULATION
4.1|Circuit configurations

FIGURE 1 0 Output voltage tracking curve of the wireless power transfer(WPT)system

FIGURE 1 1 Inductive current of the buck circuit

FIGURE 1 2 Results of the multi‐stage optimization at the start‐up stage.(a)Inductance current of buck circuit at stage 1.(b)The output voltage tracking curve of the wireless power transfer(WPT)system at stage 1.(c)System performance indicators corresponding to physical quantities at stage 1

FIGURE 9 Simulation diagram of the wireless power transfer(WPT)system

TABLE 8 The optimal controller parameter combination at the start‐up stage
In order to verify that the proposed scheme can make the WPT system obtain better performance,we use Simulink as the simulation platform as shown in Figure 9.It is a closed‐loop WPT system with five parts,namely a four‐coils power transfer inductive links acts as the coupling system to achieve contactless transmission of energy,a full‐bridge rectifier circuit with a filter capacitor acts as the rectifier to convert ac signals into dc signals,a classical buck converter as the power conversion stage to achieve power conversion,as a feedback controller,and the operator‐based control system ensures the tracking performance and robustness of the non‐linear WPT system.As a multi‐stage controller,the parameter switching module can change the operator‐based control system parametersαandhto make the system reach the optimal state in each stage of simulation.
The first three parts constitute an open‐loop WPT system.Its equivalent circuit diagram is shown in Figure 1 and the parameter settings are shown in Table 1.The operator‐based control system receives four signals,including the control signal from the parameter switching module,capacitance currentiCs,input voltageVinand output voltagevo,from the power conversion stage,and then output control signal to the electronic switchS.Furthermore,the“Stop Time”is set to 1.5 s and the‘Sample Time’is set to 3e?8seconds,in simulation.
4.2|Simulation results and comparisons
The overall optimization results are shown in Figures 10 and 11,in which Figure 10 is the output voltage tracking curve and Figure 11 is the inductance current curve of the buck circuit.From Figures 10 and 11,we can see the switch points of the three stages and the influence of the comparison controller and optimised controller on system performance,respectively.As can be seen from Figure 10,compared with our previous method,the multi‐stage optimization method proposed in this paper obtained a larger output voltage at the end of the first stage and a faster tracking speed at the second stage.According to Figure 11,the current overshoot of the comparison controller is slightly smaller than the optimised controller,but neither exceeded the maximum current limit.
The optimization results of the start‐up stage are shown in Figure 12.Figure 12a represents the inductance current curve.According to the figure that the comparison controller is slightly better than the optimised controller in terms of current overshoot,but neither of them exceeds the maximum current limit.Figure 12b represents the output voltage curve.The figure shows that the output voltage obtained by using the optimised controller is larger than that obtained by using the comparison controller at 0.02 s end time of the first stage.Figure 12c describes the system performance indicators corresponding to physical quantities in Figure 12a and Figure 12b;theXaxis represents the current overshoot and theYaxis represents the reciprocal of the voltage rise rate,and the star mark indicates the optimization results:current overshoot indicator is 0 and the reciprocal of voltage rise rate is 0.8627.The optimal controller parameters are shown in Table 8.

FIGURE 1 3 Results of the multi‐stage optimization at the tracking stage.(a)The output voltage tracking curve of the wireless power transfer(WPT)system at stage 2.(b)Switch vibration waveform of certain periods at stage 2.(c)System performance indicators corresponding to physical quantities at stage 2
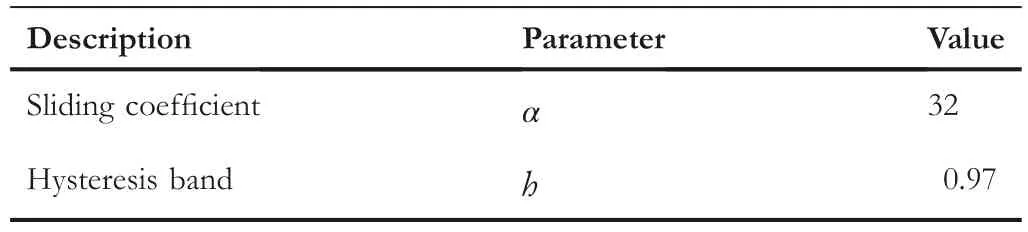
TABLE 9 The optimal controller parameter combination at the tracking stage
The optimization results of the tracking stage are shown in Figure 13.Figure 13a represents the output voltage curve.Be apparent from the figure that the tracking time obtained by using the optimised controller is much smaller than that obtained by using the comparison controller.Figure 13b represents the switch fluctuation of the second stage in a certain period.Obviously,the number of switch fluctuation obtained by using the optimised controller is much less than that obtained by using the comparison controller.Figure 13c describes the system performance indicators corresponding to physical quantities in Figure 13a and Figure 13b;theXaxis represents the tracking time and theYaxis represents the switch vibration,and the star mark represents the optimization results:tracking time is 0.15,884 and the number of switch vibration is 114,983.The optimal controller parameters are listed in Table 9.
The optimization results of the stabilisation stage are shown in Figure 14.Figure 14a represents the output voltage curve.We can see from the figure that the steady‐state error obtained by using the optimised controller is smaller than that obtained by using the comparison controller.Figure 14b represents the switch fluctuation of the third stage in a certain period.It is obvious that the number of switch fluctuation obtained by using the optimised controller is less than that obtained by using the comparison controller.Figure 14c describes the system performance indicators corresponding to physical quantities in Figure 14a and Figure 14b;theXaxis represents the steady‐state error and theYaxis represents the switch vibration,and the star mark represents the optimization results:steady‐state error is 0.000,926 and the number of switch vibration is 442,778.The optimal controller parameters are listedin Table 10.
5|CONCLUSION
In this paper,an MGA‐based optimization strategy of control system parameters is proposed to balance the performance of the uncertain WPT system at different periods.This method can find the optimal parameter combination of controller at different periods.Compared with the previous method,the WPT system can obtain better performance at each stage by using the optimised controller,while the system performance is relatively poor by using the comparison controller.Therefore,the effectiveness of the proposed method is verified.

FIGURE 1 4 Results of the multi‐stage optimization at the stabilisation stage.(a)The output voltage tracking curve of the wireless power transfer(WPT)system at stage 3.(b)Switch vibration waveform of certain periods at stage 3.(c)System performance indicators corresponding to physical quantities at stage 3

TABLE 10 The optimal controller parameter combination at the stabilisation stage
ACKNOWLEDGEMENTS
This work was supported in part by the National Natural Science Foundation of China under Grant 62006124,in part by the Nature Science Foundation of Jiangsu Province under Project BK20200811,in part by the Natural Science Foundation of the Jiangsu Higher Education Institutions of China under Grant 20KJB520006,and in part by the Startup Foundation for Introducing Talent of NUIST.
CONFLICT OF INTEREST
The author declares that there is no conflict of interest that could be perceived as prejudicing the impartiality of the research reported.
DATA AVAILABILITY STATEMENT
The data that support the findings of this study are available from the corresponding author upon reasonable request.
ORCID
Xudong Gaohttps://orcid.org/0000-0002-0750-9198
 CAAI Transactions on Intelligence Technology2022年4期
- CAAI Transactions on Intelligence Technology的其它文章
- Modelling of a shape memory alloy actuator for feedforward hysteresis compensator considering load fluctuation
- Apple grading method based on neural network with ordered partitions and evidential ensemble learning
- An improved bearing fault detection strategy based on artificial bee colony algorithm
- Passive robust control for uncertain Hamiltonian systems by using operator theory
- Humanoid control of lower limb exoskeleton robot based on human gait data with sliding mode neural network
- Research on trend prediction of component stock in fuzzy time series based on deep forest