
NUMERICAL STUDY OF HYDRODYNAMICS OF MULTIPLE TANDEM JETS IN CROSS FLOW*
2011-05-08 05:55XIAOYangTANGHongwu
水動力學研究與進展 B輯 2011年6期
XIAO Yang, TANG Hong-wu
State Key Laboratory of Hydrology-Water Resources and Hydraulic Engineering, Nanjing 210098, China College of Water Conservancy and Hydropower Engineering, Hohai University, Nanjing 210098, China, E-mail: sediment_lab@hhu.edu.cn
LIANG Dong-fang
Department of Engineering, University of Cambridge, Cambridge, UK
ZHANG Jiu-ding
College of Water Conservancy and Hydropower Engineering, Hohai University, Nanjing 210098, China
NUMERICAL STUDY OF HYDRODYNAMICS OF MULTIPLE TANDEM JETS IN CROSS FLOW*
XIAO Yang, TANG Hong-wu
State Key Laboratory of Hydrology-Water Resources and Hydraulic Engineering, Nanjing 210098, China College of Water Conservancy and Hydropower Engineering, Hohai University, Nanjing 210098, China, E-mail: sediment_lab@hhu.edu.cn
LIANG Dong-fang
Department of Engineering, University of Cambridge, Cambridge, UK
ZHANG Jiu-ding
College of Water Conservancy and Hydropower Engineering, Hohai University, Nanjing 210098, China
(Received June 28, 2011, Revised October 14, 2011)
The hydrodynamics of a single jet and four tandem jets in a cross flow are simulated by using the Computational Fluid Dynamics (CFD) software Fluent. The realizable k?ε model is used to close the Reynolds-Averaged equations. The flow characteristics of the jets, including the jet trajectory, the velocity field and the turbulent kinetic energy are obtained with various jet-tocross flow velocity ratios R in the range of 2.38-17.88. It is shown that a single jet penetrates slightly deeper than the first jet in a jet group at the same R, although the difference decreases with the decrease of R. It is also found that the way in which the velocity decays along the centerline of the jet is similar for both a single jet and the first jet in a group, and the speed of the decay increases with the decrease of R. The downstream jets in a group are found to behave differently due to the sheltering effect of the first jet in the group. Compared with the first jet, the downstream jets penetrate deeper into the cross flow, and the velocity decays more slowly. The circulation zone between the two upstream jets in the front is stronger than those formed between the downstream jets. The Turbulent Kinetic Energy (TKE) sees a distinct double-peak across the cross-sections close to each nozzle, with low values in the jet core and high values in the shear layers. The double-peak gradually vanishes, as the shear layers of the jet merge further away from the nozzle, where the TKE assumes peaks at the jet centerline.
multiple tandem jets, jet in cross flow, realizable k?ε model, flow dynamics
Introduction
Jets in cross flow configurations exist in many natural environments and industrial applications, such as pollutant dispersion, fuel injection and dilution holes in combustors. These flow fields have an important bearing on the control of the mixing process, the industrial design and the environmental risk assessment.
In this field, a single jet is much studied. Margason[1]and Lee and Chu[2]provided an extensive review in this respect. The velocity evolution in the jet center-plane[3], the vortex development[4], the jet trajectories[5], the scalar-mixing and transport properties[6], the two-phase flow structure and the particle dispersion[7]were investigated, along with other associated phenomena.
Multiple jets in cross flow are widely used in discharging municipal wastewater due to their high mixing efficiency. Compared with a single jet in cross flow, multiple jets were not much studied. The earliest experimental studies on the twin jets in cross flow were performed by Ziegler and Wooler[8]. They obtained data for trajectories of tandem air jets in cross flow. Their main conclusion is that the rear jet is less deflected than the front jet due to the sheltering effect. Issac and Schetz[9]proposed a momentum integral method to analyze the interaction between jets. Their results show that the trajectory of the rear jet is signi-
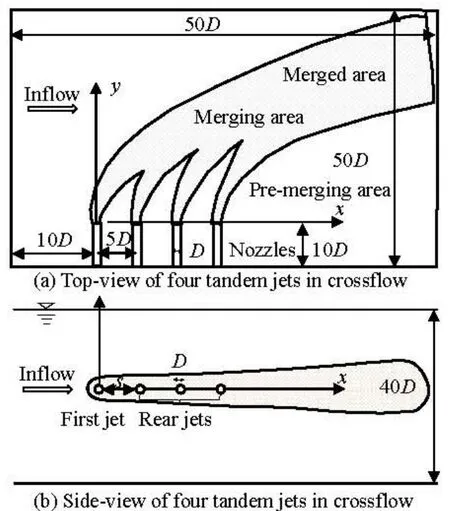
Fig.1 Flow regime definition of multiple tandem jets in cross flow
Most of existing studies focused on the twin jets. Other configurations of multiple jets, such as four jets group, have not been extensively studied. In this article, we apply the validated numerical model to conduct a series of computations on the flow fields of a single jet and four tandem jets at a series of jet-tocross flow velocity ratios.
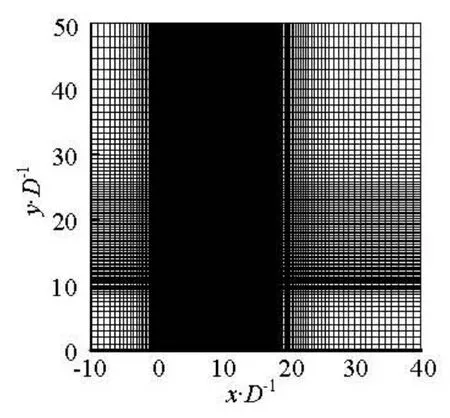
Fig.2 Computational grid in jet center plane
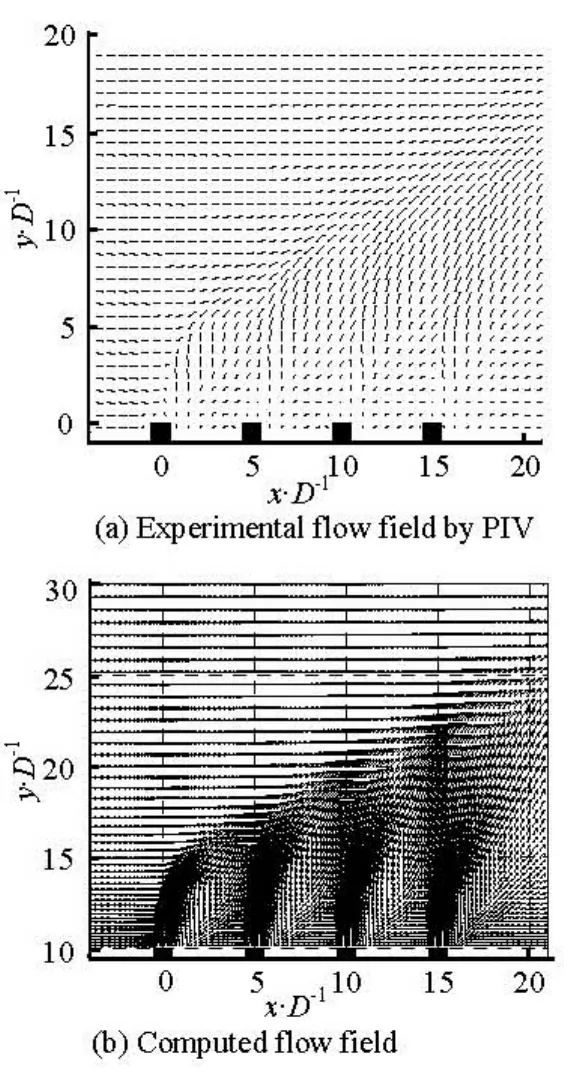
Fig.3 A comparison of experimental and computed flow fields of four tandem jets in cross flow[13]
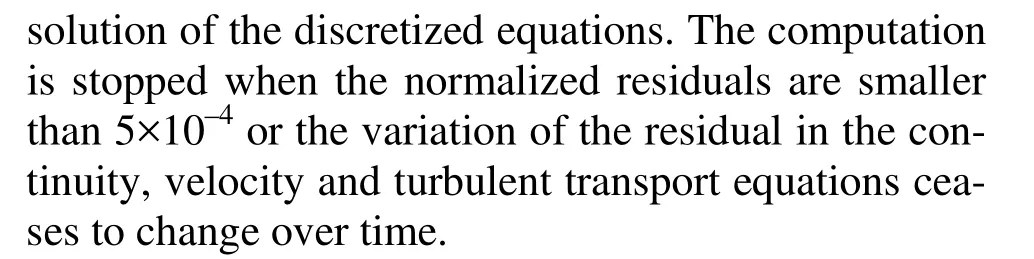
1. Computational setup
The numerical model of this study is similar to that in Xiao et al.[13]. Steady, three-dimensional and incompressible turbulent flows are considered. The realizable k?ε model is selected for the turbulent closure. The finite volume method is used to solve the governing equations. The quadratic upwind interpolation (Quick) approximation is selected for the spatial discretization. The SIMPLEC algorithm is employed for the velocity-pressure correction and the iterative
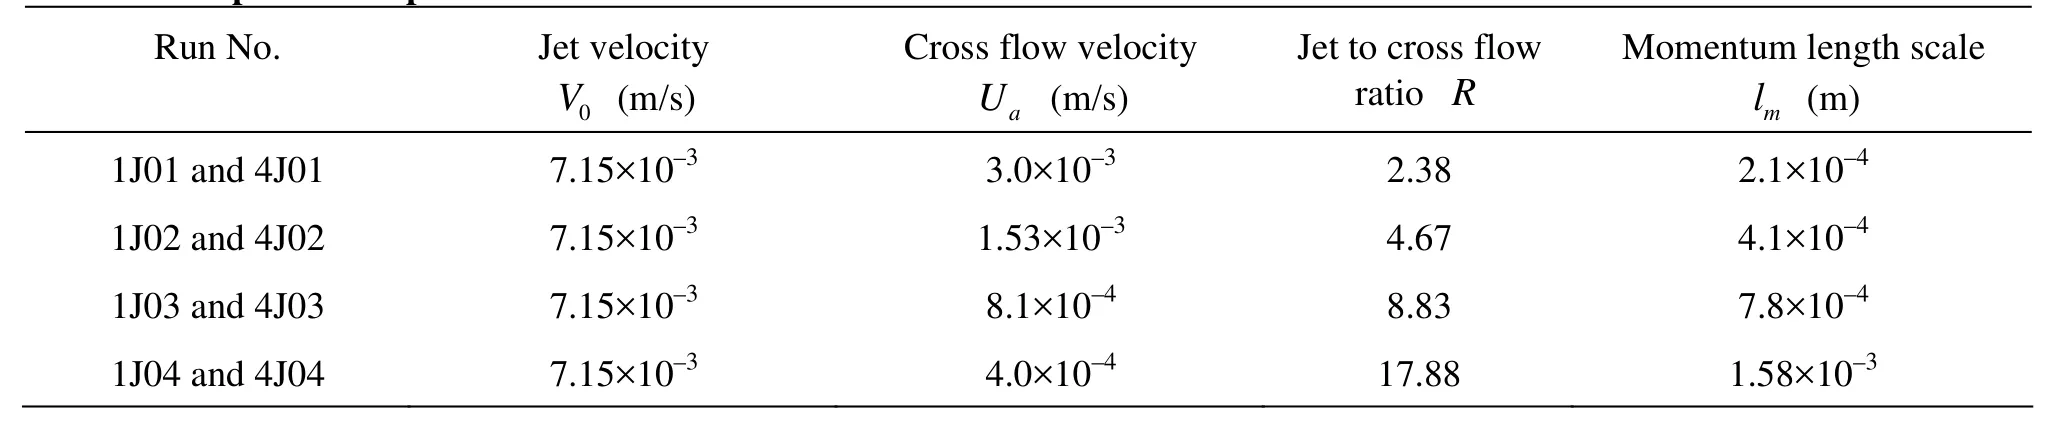
Table 1 Computational parameters
As shown in Fig.1, the four tandem jets are discharged horizontally into a perpendicular cross flow from the right side, with the jet diameter D being 0.01 m and the jet center-to-center spacing s being 5D. The numbering of the jets starts from the front upstream jet. The origin of the coordinate system is in the center of the first nozzle. (U, V, W )are the velocities in the longitudinal, transversal and vertical (x, y, z) directions, respectively. The single jet is formed by switching off the boundary conditions for the rear jets.
The computational domain is inside a rectangle box of 50 D× 50 D × 40D and four tandem pipes, of 10D in length. The center of the first jet is 10D downstream of the cross flow inlet plane (Figs.1 and 2). A total of 1 496 180 cells are used, including the fluid domain of 182×90×88 orthogonal grids and the four pipe domains each of 13 685 hexahedron grids. The minimum grid sizes are Δx=0.00125 m, Δy= 0.001m, and Δz=0.00125 m , respectively.
The boundary conditions of the fluid domain are as follows. The upstream inflow boundary: U = Ua, where Uais the cross flow velocity, V = W = C =0, the turbulent intensity I=0.01, the hydraulic diameter DH=0.4 m , the turbulence length scale l= 0.07DH, k =1.5(UaI)2, ε=Cμ3/4k3/2/l, Cμ= 0.09. The outflow boundary: ?v /? x = ?W /? x = ?C/? x=0. Other boundaries: the free-slip boundary conditions and the standard wall function are adopted. The boundary conditions of four pipes include: the interface condition is applied at the pipe outlet junction. The pipe inlet: U=0, V = V0, where V0is the jet velocity, W=0, C = C0, I=0.1, DH= 0.01m, k=k0, and ε = ε0. The computational grid along the jet center plane is shown in Fig.2. An example of the computed flow fields, compared with the experimental results measured by PIV, is shown in Fig.3. The jet velocity is not measured as shown in Fig.3(a), due to the big velocity difference between jets and cross flow.
In order to compare the results of a single jet and a four jet group, computations are performed for a single jet and four jets with the same initial jet velocity and ambient velocity as shown in Table 1, where R is the jet-to-crossflow ratio, lm=M01/2/Uais the momentum length scale and M0= πD2V02/4 is the jet momentum flux.
2. Results and discussions
2.1 Jet trajectory
The jet trajectory can be defined normally as the velocity trajectory or the concentration trajectory, which are the path through the locations of the maximum time-averaged velocities and concentrations, respectively, in jet cross sections. The velocity trajectory is considered in this article.
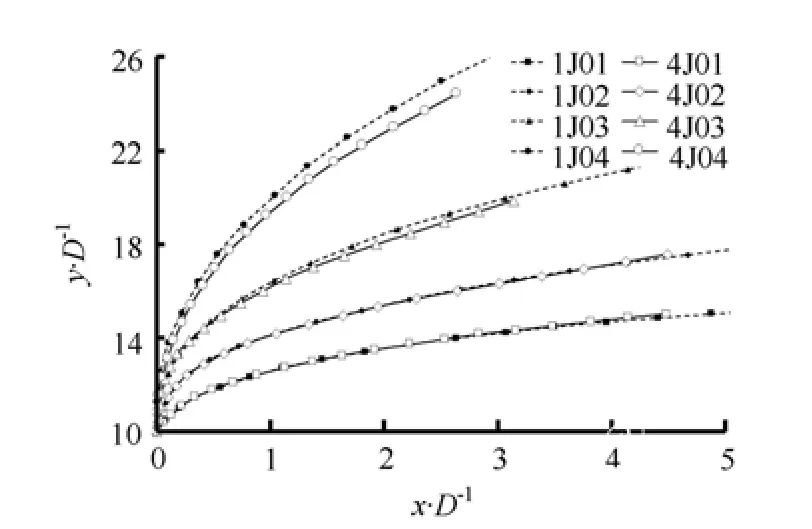
Fig.4 The comparison of the velocity trajectories of the first jet and a single jet, with solid line representing the first jet and dashed line a single jet
Figure 4 shows the velocity trajectories of the first of the multiple tandem jets in comparison with a single jet with various R. It is found that, for the same R, the trajectories of a single jet are slightly higher than those of the first jet in the group. Gutmark et al.[14]found the similar phenomenon when investigating tandem twin jets in cross flow. The main reason is that the fluid downstream of the first jet is entrained by both the first and the second jet, which contributes to the drop of the pressure downstream of the first jet.The larger pressure gradient causes the first jet to bend more than a single jet in a cross flow. The difference becomes smaller for smaller R, which suggests that the influence from the downstream jet decreases in a strong cross flow.

Fig.5 Velocity trajectories of four jets in various cases
Figure 5 compares the velocity trajectories of all jets in all cases listed in Table 1. The trajectories of the rear jets look similar, and are less deflected than the first jet, which means that there exists a slow cross flow velocity region in front of the rear jets due to the sheltering of the front jet. When y / D> 17 as shown in Fig.5(b), y / D> 23 as shown in Fig.5(c) and y/ D> 27 as shown in Fig.5(d), the edges of the first and second jets start to merge, to induce the second jet to bend more than the third and fourth jets. When the cross flow is strong (such as that shown in Fig.5(a)), all rear jets are similar as the result of the rapid development downstream.
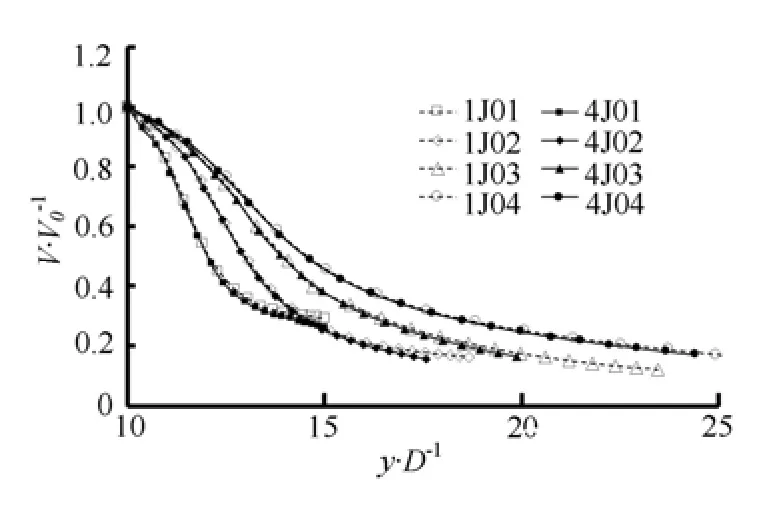
Fig.6 Centerline velocity decay along with jet velocity trajectories
2.2 Mean velocity decay on the jet trajectory
When leaving nozzles, the water entrains ambient fluid to grow the jet volumes. This leads to a velocity and concentration decay gradually along the jet trajectories. Figure 6 shows the decay of the normalized centerline velocity of the first jet with various R, where V0is the mean jet velocity at the nozzle exit. In order to compare with the case of a single jet, the decay of a single jet is also shown in the same figure. The decay of the normalized centerline velocity is accelerated when R decreases. A stronger interaction between the jet and the cross flow can be observed when R is smaller. The velocity decay of the first jet in a group and that of a single jet are almost identical. That means that the cross flow is the main factor to influence the decay of the normalized centerline velocity.
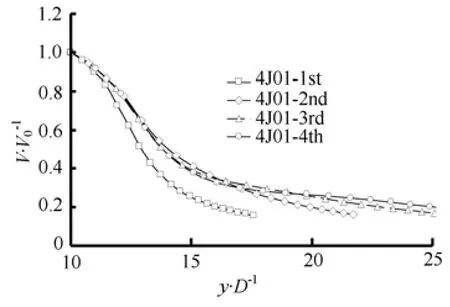
Fig.7 Centerline velocity decay along with jet velocity trajectories for different jets (Run 4J02)
Figure 7 compares the centerline velocity decayalong jet velocity trajectories of all individual jets in Case 2. The velocity decays of the rear jets are similar, and are slower than those of the first jet. For instance, the velocity of rear jets would decay to approximately 46% of the discharging velocity at y / D =15, whereas the first jet would already decay to 38% of the discharging velocity. This can be explained by the weakened strength of the ambient cross flow for the rear jets.
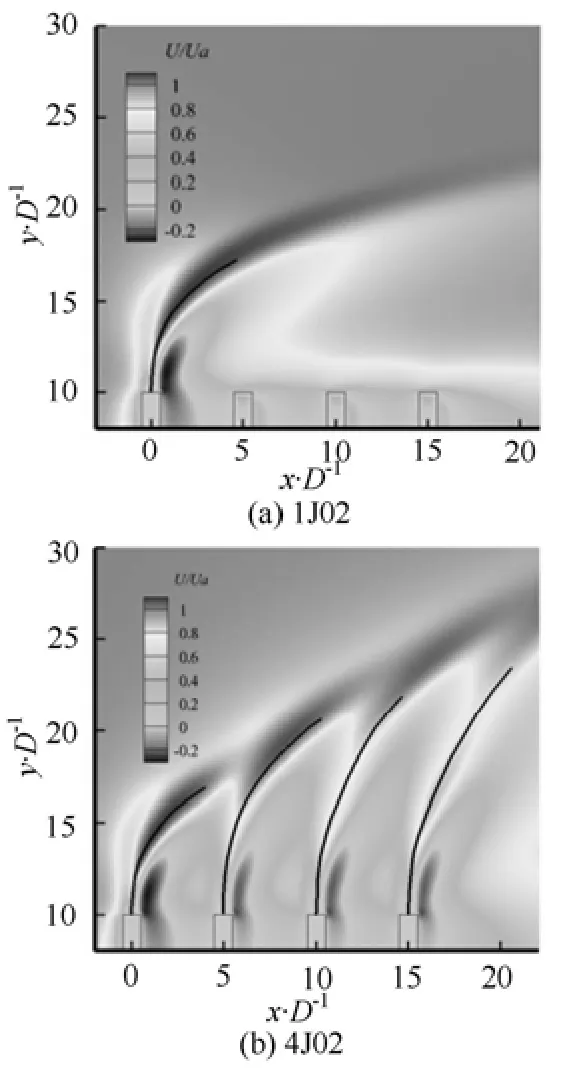
Fig.8 Normalized longitudinal velocity contour with jet centerline trajectories in the jet center plane (z=0)
2.3 Velocity field
2.3.1 Longitudinal velocity U
The contour of the normalized longitudinal velocity U /Uain the symmetric plane (z=0) is shown in Figs.8(a) (1J02) and 8b (4J02), where the velocity trajectories are overlaid. The contours close to the first jet in the group have a similar pattern as those close to a single jet. The velocity decreases gradually in front of the jet, and a reverse flow region is formed in the wake. Between the two adjacent jet nozzles, the flow region can be divided into two parts. One is the wake flow region near the former jet. Another is the upstream region near the latter jet. The reverse flow region between the first and second jets is apparently the largest. The cross flow velocities in front of the rear jets are similar and smaller than those in front of the first jet, which is why the first jet bends more. For instance, the normalized longitudinal velocity in front of the first jet is about 0.8, whereas the velocities in front of the rear jets are only about 0.4.
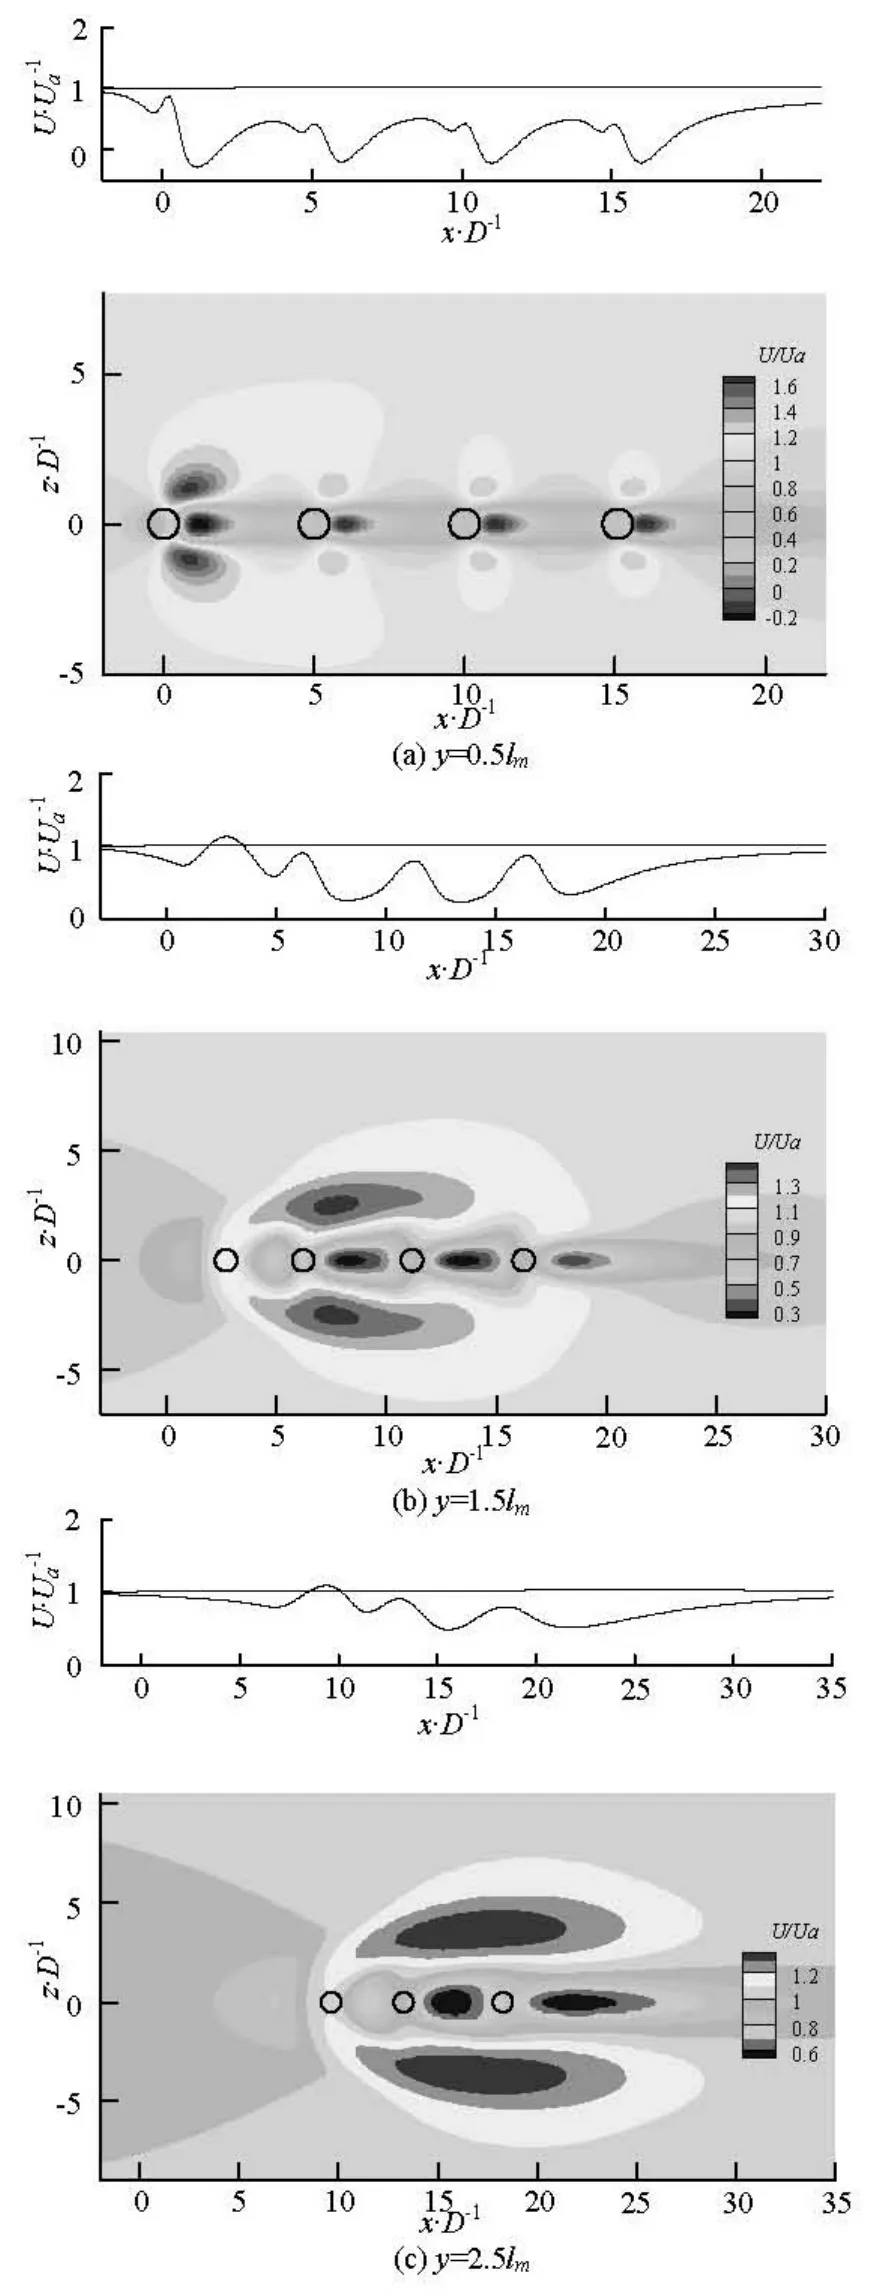
Fig.9 Normalized longitudinal velocity contour in the cross section x-z plane and longitudinal velocity variation in jet center-plane at y/ lm=0.5, 1.5, and 2.5
The contour of the normalized longitudinal velocity U /Uain the x-z plane is shown in Fig.9, where are also marked the jet locations. The variation of the normalized longitudinal velocity along the cen-terline is shown above each contour plot. In the study of a single jet in cross flow, the momentum length scale lmis used to divide the jet region into the momentum dominated near field ( y/ lm? 1) and the momentum dominated far field ( y/ lm? 1). Then, three vertical planes, with y/ lmequal to 0.5, 1.5 and 2.5, are selected to define the near field, the intermediate field and the far field, respectively. The near field shows the individual behavior of the four jets. The intermediate plane shows the interaction of the four jets. The far field shows the merged behavior of the four jets.
In the near field (Fig.9(a)), there are a velocity drop in front of the all jets caused by the blocking of the jet cores and a velocity peak within the jet regions caused by the entrainment of the jet. The accelerating area sees a symmetry in the shoulders of the all jets. The peak velocity due to the first jet in this area is larger than that due to the rear jets due to the sheltering of the first jet. Between nearby jets, the contours show a similar pattern. The only difference is that the velocity behind the first jet drops more than the other jets. In the intermediate region (Fig.9(b)), the edges of the first and second jets start to merge and they start to behave like a single unified jet. The third and fourth jets still remain separate. In the far field (Fig.9(c)), the first jet totally vanishes. The rear jets are merged together. However, the rear jets could still be vaguely observed, which indicates that the rear jets evolve slower than the first jet and the length scale lmneeds to be increased for the rear jets[13].
2.3.2 Transversal velocity V
The contour of the normalized transversal velocity V/V0in the symmetric plane (z=0) is shown in Fig.10 (Runs 1J02 and 4J02). When the jets enter into the cross flow, the jets start to bend. One can see two transversal velocity peaks: one is in the jet volume and the other is in the wake of the jet caused by the Counter Vortex Pair (CVP) for the single jet and the first jet in a group. Between the rear jets, one does not see a transversal velocity peak. The locations of the velocity peaks in the downstream of the second and third jets are in the merged region of the jets. Quantitative comparisons of transversal velocity profiles among jets at various downstream locations are shown in Fig.11. At x/D=0, 5, 10, 15, corresponding to the four jet locations, the jet velocities drop quickly after the jets are discharged into the cross flow. The velocity variations of the rear jets are similar and more gradual than the first jet. For the first jet, with x/D=1, 2.5, 4, two velocity maxima are observed in the velocity profiles, where the upper one is due to the deflected jet and the lower one is induced by the CVP. As the deflected jet entrains more ambient fluid, the upper peak also decreases accordingly. The velocity profiles downstream of the rear jets generally follow the one peak trend. The interaction of jets prevents the CVP to be formed. These profiles exhibit similar features, although the location and the amplitude of the velocity peaks vary slightly.
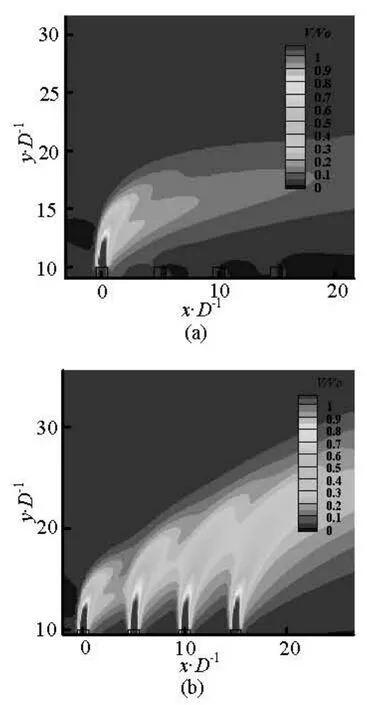
Fig.10 Normalized transversal velocity contour in the jet center plane (z=0)
2.4 Turbulent Kinetic Energy (TKE)
The TKE is defined as
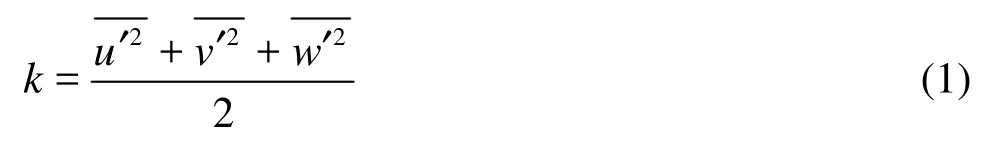
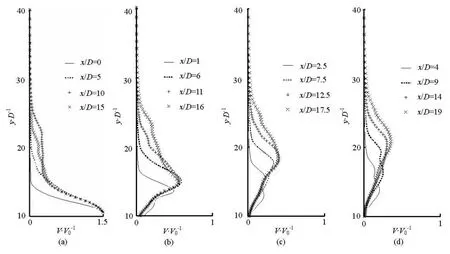
Fig.11 Normalized transversal velocity profiles of all jets along various downstream locations at 4J02. Solid line is the first jet, dashed is the second jet, triangle is the third jet and cross is the fourth jet
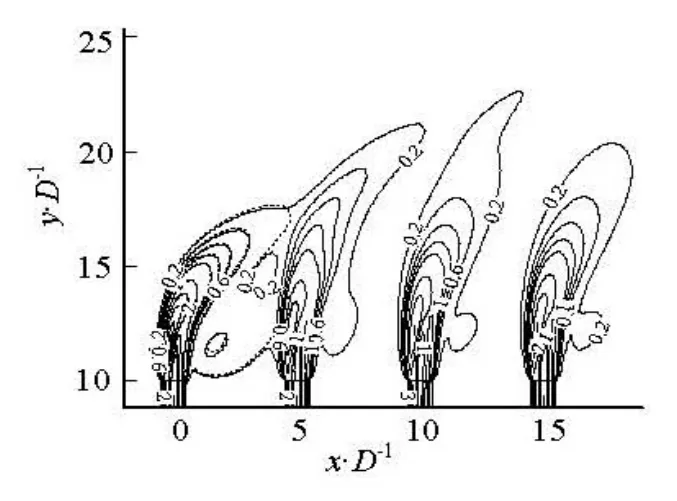
Fig.12 Contour lines of turbulent kinetic energy in jet center plane (dashed, 1J02 and solid, 4J02)
where u′, v′ and w′ are the turbulent velocities and the overbar denotes the Reynolds average. The contours of the normalized TKE (k/ Ua2) distribution within the jet centerplane (z=0) for cases 1J02 and 4J02 are shown in Fig.12. The TKE of a single jet and that of the first of the four tandem jets have very similar distributions. The TKE distributions of three rear jets are very similar to each other. A quantitative comparison of the normalized TKE at different constant y planes is shown in Fig.13. At a very short distance from the nozzle ( y =0.5lm), two TKE peaks are observed at the edge of each jet volume, which connect the low TKE regions of the jet core and the ambient flow region. The upstream peak is always higher than the downstream peak, which indicates the higher shear intensity on the upstream side of each jet. The upstream peak in the first jet takes the largest value among all jets due to the presence of the largest effective cross flow in front of the first jet. The peak value is about 3.2 for the first jet and nearly 2.5 for the rear jets. The double peaks gradually vanish and a single peak TKE distribution appears for each jet at higher y levels, corresponding to the merging of the shear layers. When y =1.0lm, a single peak is formed with a similar value for all jets. After that, the boundaries of the first and second jets start to overlap. The first jet finally loses its own identity and the peak TKE value of 0.91 is found in the second jet volume, whilethelasttwojetsdownstreamhavesimilarTKE values of 0.75. The turbulence intensity is seen to decrease consistently further away from the nozzles.
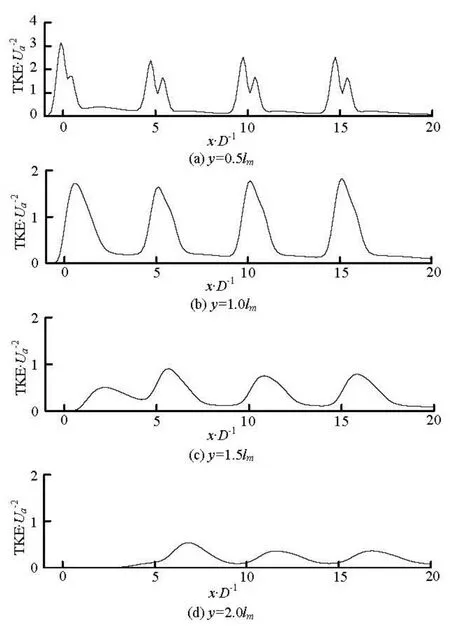
Fig.13 Normalized TKE profiles at different y locations along x direction (4J02)
3. Conclusions
3-D turbulent flows of a single jet and four tandem jets in cross flow configurations are studied, based on a validated numerical model. The flow characteristics of the jets, including the jet trajectory, the velocity decay, the velocity evolution and the turbulent kinetic energy, are analyzed in detail. The main conclusions can be summarized as follows:
(1) The trajectories of a single jet are slightly higher than those of the first jet in a jet group at the same R. The differences decrease with the decrease of R. The trajectories of the rear jets are less deflected than that of the first jet, and with a similar shape.
(2) The velocity decay along the first of multiple jets is similar to that along a single jet. The decay of the normalized centerline velocity is faster at smaller R. The velocity decays in the rear jets are relatively slow, and also with a similar pattern.
(3) The flow fields of a single jet and the first jet in a jet group show a similar development in the near field. The region between two adjacent jets can be divided into two parts. One is the wake flow region downstream of the former jet. The other is upstream of the latter jet. The area of the reverse flow region between the first and second jets is larger than the others.
(4) The TKE of a single jet and that of the first of the four tandem jets show similar distributions. The three rear jets have similar TKE distributions. The jet core and the ambient flow have a low turbulence level, and the shear layers between these two regions have a high turbulence level. The jet core disappears some distance away from the nozzle, with a high turbulence intensity along the jet trajectory. The largest TKE value always occurs where the incoming flow starts to impinge on the jet.
Acknowledgements
The authors thank Prof. Lee Joseph H. W. and two anonymous reviewers for suggestions on improving the article.
[1] MARGASON R. J. Fifty years of jet in cross flow research[C]. AGARD Symposium on a Jet Cross Flow. Winchester, UK, 1993, AGARD CP-534: 1-41.
[2] LEE J. H. W., CHU V. H. Turbulent jets and plumes: A lagrangian approach[M]. Dordrecht, The Netherlands: Kluwer Academic Publishers, 2003.
[3] ANDREOPOULOS J., RODI W. Experimental investigation of jets in a cross flow[J]. Journal of Fluid Mechanics, 1984, 138: 93-127.
[4] NEW T. H., LIM T. T. and LUO S. C. Effects of jet velocity profiles on a round jet in cross flow[J]. Experiments in Fluids, 2006, 40(6): 859-875.
[5] HASSELBRINK E. F., MUNGAL M. G. Transverse jets and jet flames. Part 1. Scaling laws for strong transverse jets[J]. Journal of Fluid Mechanics, 2001, 443: 1-25.
[6] LEE Joseph H. W., KUANG Cui-ping and CHEN Guoqian. The structure of a turbulent jet in a cross floweffect of jet crossflow velocity[J]. China Ocean Engineering, 2002, 16(1): 1-20.
[7] FAN Jing-yu, XU Song-li and WANG Dao-zeng. PDA measurements of two-phase flow structure and particle dispersion for a particle laden jet in crossflow[J]. Journal of Hydrodynamics, 2010, 22(1): 9-18.
[8] ZIEGLER H., WOOLER P. T. Multiple jets exhausted into a crossflow[J]. Journal of Aircraft, 1971, 8(6): 414-420.
[9] ISAAC K. M., SCHETZ J. A. Analysis of multiple jets in a cross flow[J]. Journal of Fluids Engineering, 1982, 104(4): 489-492.
[10] ISAAC K. M., JAKUBOUSKI A. K. Experimental study of the interaction of multiple jets with a cross flow[J]. AIAA Journal, 1985, 23(11): 1679-1683.
[11] KOLAR V., TAKAO H. and TODOROKI T. et al. Vorticity transport within twin jets in cross flow[J]. Experimental Thermal and Fluid Science, 2003, 27(5): 563-571.
[12] YU D., ALI M. S. and LEE J. H. W. Multiple tandem jets in cross flow[J]. Journal of Hydraulic Engineering, 2006, 132(9): 971-982.
[13] XIAO Yang, LEE Joseph H. W. and TANG Hong-wu. Three-dimensional computations of multiple tandem jets in cross flow[J]. China Ocean Engineering, 2006, 20(1): 99-112.
[14] GUTMARK E. J., IBRAHIM I. M. and MURUGAPPAN S. Dynamics of single and twin circular jets in cross flow[J]. Experiments in Fluids, 2011, 50(3): 653-663.
10.1016/S1001-6058(10)60179-5
* Project supported by the National Natural Science Foundation of China (Grant Nos. 50879020, 51179055 and 51125034), the Special Fund of State Key Laboratory of Hydrology-Water Resources and Hydraulic Engineering (Grant No. 2010585512) and the Fundamental Research Funds for the Central Universities (Grant No. 2009B07614).
Biography: XIAO Yang (1974-), Male, Ph. D., Associate Professor

- 水動力學研究與進展 B輯的其它文章
- LATTICE BOLTZMANN METHOD SIMULATIONS FOR MULTIPHASE FLUIDS WITH REDICH-KWONG EQUATION OF STATE*
- NUMERICAL SIMULATION OF HYDRODYNAMIC CHARACTERISTICS ON AN ARC CROWN WALL USING VOLUME OF FLUID METHOD BASED ON BFC*
- DYNAMIC ANALYSIS OF FLUID–STRUCTURE INTERACTION OF ENDOLYMPH AND CUPULA IN THE LATERAL SEMICIRCULAR CANAL OF INNER EAR*
- SIMULATIONS OF FLOW INDUCED CORROSION IN API DRILLPIPE CONNECTOR*
- NUMERICAL SIMULATION OF FLOW OVER TWO SIDE-BY-SIDE CIRCULAR CYLINDERS*
- EXPERIMENTAL STUDY ON SEDIMENT RESUSPENSION IN TAIHU LAKE UNDER DIFFERENT HYDRODYNAMIC DISTURBANCES*