
New Latency Model for Dynamic Frequency Scaling on Network-on-Chip
2014-03-24 05:40ShengNanLiandWenMingPan
Sheng-Nan Li and Wen-Ming Pan
New Latency Model for Dynamic Frequency Scaling on Network-on-Chip
Sheng-Nan Li and Wen-Ming Pan
——Modulating both the clock frequency and supply voltage of the network-on-chip (NoC) during runtime can reduce the power consumption and heat flux, but will lead to the increase of the latency of NoC. It is necessary to find a tradeoff between power consumption and communication latency. So we propose an analytical latency model which can show us the relationship of them. The proposed model to analyze latency is based on the M/G/1 queuing model, which is suitable for dynamic frequency scaling. The experiment results show that the accuracy of this model is more than 90%.
Index Terms——Dynamic programming network, latency model, network-on-chip, power budgeting, regression.
1. Introduction
As the structure size down to 22 nm and smaller[1], there are two big challenges that many network-on-chip (NoC) designers have to face: First, the proportion of time which is spent on the communications of different intellectual property (IP) cores is increasing compared with the time that is spent on calculating in the IPs, so the delay of NoC acts as the performance bottleneck in many NoC designs[2]. Second, as the integration density of a chip increases in an amazing speed, the power consumption and the power density of NoC are also increase rapidly. Eventually, the point will be reached where heat constraints forbid adding more parallelism structures, which becomes a new limiting factor to system performance[3]. The many-core architecture also faces steep design challenges with respect to power consumption[4]. Now more and more people want to controlthe power budget during the runtime dynamically to make the NoC more power saving, and most designs allow the modulation of both clock frequency and supply voltage during runtime by a feature called dynamic voltage and frequency scaling (DVFS)[1]. But two problems became the limitation which seriously affects the development of performance of NoC. In general, if latency is reduced, the power consumption will increase; if power is reduced, the latency of NoC will increase. So it is very important to build a latency model which can show us the relation between the latency and the frequency of NoC and the average latency of NoC in DVFS procedure. But the present analytical model only can be used when the frequency of routers is fixed.
To solve this problem, in this work, we present a latency model which can not only calculate the latency in a normal way, but also analyze the latency when the frequency of routers is changed dynamically. So it will suit for the works which care about both the latency and power and want to make a tradeoff between them or to find the best budget when there is a constraint for power.
The rest of the paper is arranged as follows: In Section 2, we will discuss the related work about latency models and power management by means of DVFS. The new latency model is proposed in Section 3. In Section 4, evaluations on different router frequency and different workloads are given. And the conclusions are drawn in Section 5.
2. Related Work
Two latency models using the queuing theorem were presented in [5] and [6]. The model presented in [5], which is based on an M/G/1 queuing model, is used to develop a thorough performance analysis for wormhole routing with arbitrary size messages and finite buffers under application-specific traffic patterns. The model proposed in [6] is based on a G/G/1 queuing model. It estimates performance metrics, such as the average latency and router blocking time, and can be conveniently used for optimization purposes to find appropriate design parameters and obtain quick performance estimates. Reference [7] analyzed how multiple traffic streams originating at the source could be combined into a single traffic stream without any adverse impact on the statistical characteristicof the destination traffic. The model was derived from the observations of the statistical behaviors of received streams at destinations in a single-source multiple-destinations scenario. Reference [8] presented an analytic formalism that enables powerful modeling of discrete event (DE) systems. There are some other works introduce latency models using the queuing theorem[9],[10].
3. NoC Average Latency
The objective of the NoC power budgeting is to optimize the average latency under a power envelop, which corresponds to minimizing the overall system running time. Lightweight latency models can be derived from the queue model, which will be described in this section. Our goal is to find a quantitative relationship between the network latency and the router frequencies.
In this section, we will first discuss how to model a single router by using the queuing theorem. A router is considered as a set of first-in first-out (FIFO) buffers connected by a crossbar switch. Fig. 1 shows a model of a router for the mesh network, Ch0 is used to connect local IPs, Ch1 to Ch4 are used to connect to the routers nearby. Secondly, we will discuss how to calculate the average latency.
In this work, we assume that a router haspchannels with buffers and the network uses wormhole control and is under deterministic routing algorithms. The model we proposed has been constructed on the M/G/1 queue.

Fig. 1. Router model as a collection of FIFO buffers with five input channels.
3.1 Waiting Time in Each Router
First, we discuss the single queue, the waiting time of theith arrival packet which includes the waiting time in the queue and the service time is

whereXkis the service time of thekth packet, including the time to traverse the router and link, andXkcan be considered to be proportional to the router frequencyfi.Riis the residual service time, which is the time needed to finish the serve of a packet that is being served now, from the aspect of theith incoming packet.

whereE[Wi] means the expected waiting time of theith packet,E[Xk] means the expected service time of thekth packet,Niis the length of the queue when theith packet is coming,Nis the average length of queue,μis the serve rate of the server, andRis the residual service time.
Here we have used the “Poisson arrivals see time averages” (PASTA) property and the independent service time property, from Little’s formula:

whereWis the average wait time andλis the arrival rate of channel.
So we get

whereρ=λμand

whereVis the vacation time andXis the service. The serve of a packet can begin only at the start of a cycle. If the queue is empty at the start of a cycle, the server will not work for this duration of the cycle (vacation). So, the average wait timeWis

Following the description and the assumption above, we can calculate theE[V] andE[V2] easily.
We model the router as a set of FIFO buffers connected with a crossbar (see Fig. 1), if there are more than one input channel want to transmit packets to the same output channel at the same time, an arbitration will take place. SoWiis composed of following four components:
1) The service time that the packets have already waited in the same buffer;
2) The time that packets have waited in the other buffers of the same router and been served before the incoming packet;
3) The residual service time, which is the time needed to finish the serve of a packet that is being served now, from the aspect of the incoming packet (R).
4) The service time of this packet.
So the average waiting time of channeliis

whereis the arrival rate of channeli, andci,jis the confliction rate between input channeliand input channelj. we define ifi=j,ci,j= 0; ifi≠j, then

whereλi,kis the arrival rate at input channeliwhich is routed toward to output channelk. Andλi→jrepresenting the packet rate generated by IPiand routed to IPjcan be expressed as

where ICiis theith input channel, OCjis thejth output channel,sis the source IP, anddis destination IP. AndR(S→D,ICi→ OCj) equals 1 if a packet from routerSto routerDpasses from ICito OCj; otherwise, it equals 0.
3.2 Average Delay of Network
In Fig. 2, a flow is generated in IPsand its destination is IPd. The packet traversesRs,Rm, andRdbefore reaches IPd. The latency of the header flit of this packet is the sum of the time waiting in the input Ch0 ofRs, the time waiting in the input Ch1 ofRm, and the time waiting in the Ch4 ofRd, which is,

and the latency of this packet is,


So, the latency of the network is
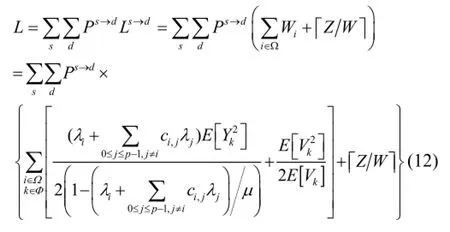
wherePs→dis the probability of a packet is generated inIPsand is delivered to IPd,Ykis the service time of packet served by routerk,Ωis the set of input channels by which the flow is passing, andΦis the set of routers where the flow will passing.

Fig. 2. Two-hops flow from IPs(source) to IPd(destination).
3.3 Latency Model with Dynamic Frequency Scaling


wherelkis the frequency level of routerk.
4. Experiment Results
In this Section, we will verify the accuracy of the proposed model. The model has been validated on a simulator where the injected packets of each router was generated by a generator written in C++, the injection rate of each router is independent distributed, and the routing algorithm behavior works at the flit level. Throughout the experiments, we assume that each input buffer slot can hold a 64-bit flit. If there is no contention and the router is working at the full speed, the service time is 5 cycles forthe header flit and the transition time for the body flit is 1 cycle. In these experiments, the vacation time follows the uniform distribution, so

and

There are 4 batches and each batch includes 100000 up to 1000000 packets depending on the traffic injection rate, the network size, and the frequency of routers. From these batches, we can see the accuracy of the latency model. We consider a 6×6 mesh and an 8×8 mesh in the experiment, respectively, and the frequency of some routers has been changed. Fig. 3 and Fig. 4 are the results for the 6×6 mesh. Fig. 3 shows the result for the mesh where all the routers are working at the full speed. Fig. 4 shows the result for the mesh where the frequencies of some routers have been changed: 6 routers are working at level 9, 6 routers are working at level 8, and 6 routers are working at level 7, and the rest routers are working at level 10. We can see from Fig. 3 and Fig. 4 that in the 6×6 mesh the analytical model is very accurate, The experiment results show that the accuracy of this model is more than 90% when the average injection rate is under 0.045 packet per cycle per router, and is not precisely enough when the injection rate is beyond 0.05 packet per cycle per router.
Fig. 5 and Fig. 6 are the results for the 8×8 mesh. For the mesh to Fig. 6, 6 routers are working at level 9, 6 routers are working at level 9, 6 routers are working at level 7, and the rest routers are working at level 10. It can be seen from these figures that in the 8×8 mesh the analytical model is very accurate, The experiment results show that the accuracy of this model is more than 90% when the average injection rate is under 0.027 per router, and is not precisely enough when the injection rate is beyond 0.03 per router.

Fig. 3. A 6×6 mash with all routers working at full speed.

Fig. 4. A 6×6 mesh with the frequency of some routers beening changed.

Fig. 5. An 8×8 mesh with all routers working at full speed.

Fig. 6. An 8×8 mesh with the frequency of some routers being changed.
5. Conclusions
In this paper, we propose a latency analytical model that can show us the relationship between the NoC average latency and frequency of routers, which is based on the M/G/1 queueing model. The experiment resultsdemonstrate the accuracy and effectiveness of the proposed model. The accuracy more than 90% can be achieved when the injection rate is less than 0.045 (6× 6 mesh) or 0.027 (8× 8 mesh). By using this model, we can make a tradeoff between the power consumption and the latency of NoC. It can help us to find the least latency and optimized parameters of NoC with a constraint on power, and vice versa. And the higher requests on power consumption efficiency and latency will show the utility value and importance of this model in NoC design. In the future, we will do some research on power management by using this model.
[1] A. Kohler and M. Radetzki, “Power management for high-performance applications on network-on-chip-based multiprocessors,” inProc. of IEEE Int. Conf. on Cyber, Physical, and Social Computing, Beijing, 2013, pp. 77-85.
[2] S. R. Sridhara and N. R. Shanbhag, “Coding for system-on-chip networks: a unified framework,”IEEE Trans. on Very Large Scale Integration Systems, vol. 13, pp. 655-667, Jun. 2005.
[3] H. Esmaeilzadeh, E. Blem, R. St. Amant, K. Sankaralingam, and D. Burger, “Dark silicon and the end of multicore scaling,” inProc. of Int. Symposium on Computer Architecture, San Jose, 2011, pp. 365-376.
[4] J. Howard, S. Dighe, S. R. Vangal, G. Ruhl, N. Borkar, S. Jain, and R. Van der Wijngaart. “A 48-core IA-32 processor in 45 nm CMOS using on-die message-passing and DVFS for performance and power scaling,”IEEE Journal of Solid-State Circuits, vol. 46, pp. 173-183, Jan. 2011.
[5] U. Y. Ogras, P. Bogdan, and R. Marculescu, “An analytical approach for network-on-chip performance analysis,”IEEE Trans. on Computer-Aided Design of Integrated Circuits and Systems, vol. 29, pp. 2001-2013, Dec. 2010.
[6] A. E. Kiasari, Z.-H. Lu, and A. Jantsch, “An analytical latency model for networks-on-chip,”IEEE Trans. on Very Large Scale Integration Systems, vol. 21, pp. 113-123, Jan. 2013.
[7] R. Chuggani, V. Laxmi, M. S. Gaur, P. Khandelwal, and P. Bansal, “A traffic model for concurrent core tasks in networks-on-chip,” inProc. of the 6th IEEE Int. Symposium on Electronic Design, Test and Application, Queenstown, 2011, pp. 205-210.
[8] J. Silveira, P. C. Cortez, G. C. Barroso, and C. Marcon,“Employing a timed colored Petri net to accomplish an accurate model for network-on-chip performance evaluation,” inProc. of the 15th Int. Symposium on Quality Electronic Design, Santa Clara, 2014, pp. 55-59.
[9] M. Moadeli, A. Shahrabi, W. Vanderbauwhede, and M. Ould-Khaoua, “An analytical performance model for the Spidergon NoC,” inProc. of the 21st Int. Conf. on Advanced Information Networking and Applications, Niagara Falls, 2007, pp. 1014-1021.
[10] M. Lai, L. Gao, N. Xiao, and Z. Wang, “ An accurate and efficient performance analysis approach based on queuing model for network on chip,” inProc. of the 2009 Int. Conf. on Computer-Aided Design, New York, 2009, pp. 563-570.

Sheng-Nan Li was born in Heilongjiang Province, China in 1990. He received the B.S. degree in computer science from the Mudanjiang Normal University of China in 2013. He is currently pursuing the M.S. degree with the School of Computer Science and Technology, Harbin Institute of Technology
(HIT).
His research
interests include fault tolerant computing and parallel computing.

Wen-Ming Pan was born in Guangdong, China in 1982. He received the B.S. and M.S. degrees in electronic engineering from Jinan University, Guangzhou in 2004 and 2007, respectively. He works as a research assistant with Guangzhou Institute of Advanced Technology, Chinese Academy of Sciences. He has been engaged in the FPGA design research for years. His research interests include networks-on-chip and parallel computing.
Manuscript received August 11, 2014; revised November 20, 2014. This work was supported by the National Natural Science Foundation of China under Grant No. 61376024 and No. 61306024, Natural Science Foundation of Guangdong Province under Grant No. S2013040014366, and Basic Research Programme of Shenzhen No. JCYJ20140417113430642 and JCYJ20140901003939020.
S.-N. Li is with the School of Computer Science and Technology, Harbin Institute of Technology, Harbin 150001, China, (Corresponding author e-mail: shengnanli1990@gmail.com).
W.-M. Pan is with Guangzhou Institute of Advanced Technology, Chinese Academy of Sciences, Guangzhou 511400, China (e-mail: wm.pan@giat.ac.cn).
Digital Object Identifier: 10.3969/j.issn.1674-862X.2014.04.004
 Journal of Electronic Science and Technology2014年4期
- Journal of Electronic Science and Technology的其它文章
- Study on Temperature Distribution of Specimens Tested on the Gleeble 3800 at Hot Forming Conditions
- Automatic Vessel Segmentation on Retinal Images
- Family Competition Pheromone Genetic Algorithm for Comparative Genome Assembly
- Quantification of Cranial Asymmetry in Infants by Facial Feature Extraction
- Intrinsic Limits of Electron Mobility inModulation-Doped AlGaN/GaN 2D Electron Gas by Phonon Scattering
- Real-Time Hand Motion Parameter Estimation with Feature Point Detection Using Kinect