
An investigation on dissolution kinetics of single sodium carbonate particle with image analysis method
2016-05-26 09:28ChangdongLiCarlosAmadorYulongDing
Changdong Li,Carlos Amador,Yulong Ding*
1Institute of Particle Science and Engineering,University of Leeds,Leeds,UK
2Procter&Gamble Newcastle-Upon-Tyne Innovation Centre,Newcastle,UK
3School of Chemical Engineering,University of Birmingham,Birmingham,UK
1.Introduction
Dissolution of solid particles has been studied over one century and it is widely applied into various chemical and physical applications such as food industry, pharmaceutical and household product. A typical dissolution is generally the process of solute forming a solution in solvent.Three main dissolution models are thus developed including mass transport model, surface reaction model and inter-facial barrier model [1].Based on these dissolution models [2], a vast number of mathematical models were proposed, such as Noyes-Whitney equation [3] and Hixson-Crowell model [4], and used to quantify the dissolution kinetics at different dissolving conditions.
Traditional dissolution studies mainly rely on the dissolution experiments such as U.S. Pharmacopeia (USP) dissolution apparatus [5]. The dissolution process usually is measured with conductivity or refractometry measurements. Dissolution mechanisms can be interpreted with the existing dissolution models. Although conventional research is normally based on the dissolution tests of bulk of particles, many dissolution studies with the approach of single particle have been raised and implemented into several materials in the recent 20 years. For example Dorozhkin quantified the dissolution kinetics of single crystal of natural fluorapatite with optical microscopy, SEM, Auger electron and IR reflection spectroscopy [6]. Raghavan et al. quantified the dissolution kinetics of single crystal of α-lactose monohydrate, and linear dissolution profiles were determined as a function of time [7]. ?těpánek simulated the effective dissolution according to the local fluxes as the solution of a convection–diffusion problem in the surrounding liquid phase [8]. However, it is rarely investigated for sodium carbonate which is one of the most important basic compositions of many products such as detergent and baking powders with the approach of single particle to study the dissolution kinetics. The dissolution properties of sodium carbonate show a large extend to affect the quality of final products.Therefore, this work is highly motivated to overcome this vacancy of dissolution studies for sodium carbonate with the approach of single particle to determine its dissolution mechanism at different conditions and quantify its dissolution kinetics. The dissolution conditions that affect dissolution kinetics of solid particles generally based on the physical and chemical properties of solution [9–10]. In this work, the dissolution experiments are carried out with increasing temperature and pH separately.Therefore, the dissolution mechanism of single sodium carbonate particle at increasing temperature and pH can be investigated and the dissolution kinetics are also quantified. In this way, the works in this paper will also provide vast information to extend the understanding of dissolution properties of sodium carbonate from the approach of single particle to bulk.
The dissolution process of single particle is normally excessively fast and the entire dissolution environment changes within a very small scale,it therefore is very difficult to measure the dissolution process directly with the measurement techniques which are usually applied for a bulk of particles.To accomplish the dissolution experiments of single sodium carbonate particle in this work,the image analysis method via high speed camera is implemented.Different with image analysis with microscopy,high speed camera has its great advances to transfer the entire dissolution process into visualized videos and each frame of video can be saved into dissolution images for analysis.The time scale of saved images can be accurate to 1/10,1/20 or 1/50 s.In this way,it is reliable to apply image analysis method accurately into quantification of dissolution process of single sodium carbonate particle.
2.Sample Selection
The original sodium carbonate particles used in this work are provided by Procter & Gamble Newcastle Innovation Center (UK). The purity of sodium carbonate particles is 99.9%. The samples of sodium carbonate particle used into dissolution experiments are selected with the following procedures: firstly, the original sodium carbonate particles provided by Procter & Gamble are weighed for one particle by another in order to select the particles containing the mass of (0.30 ± 0.02) mg. Then the selected particles from with same mass are observed with an optical microscopy to define their shape and only the particles having the shape of sphere are selected. The definition of particle shape in this work is based on the classification scheme by Riley [11]. According to Riley's definition, the particles having the sphericity higher than 0.775 can be considered as the high spherical particles where the sphericity is measured as the ratio of the diameter of a circle having the same area of measured particle to the diameter of the smallest circumscribed circle of measured particles. In this way, the optical microscopy of Nikon Eclipse Ti Microscopy is used in this step to measure the sphericity and the particles with the sphericity higher than 0.775 are selected as the spherical sodium carbonate particles. Finally, the diameter of spherical sodium carbonate particles is measured with this optical microscopy. Only the spherical particles having (1.50 ± 0.02) mm diameter which is measured from its smallest circumscribed circle are selected as the samples used into the dissolution experiments. An example of the sample of spherical sodium carbonate particle was shown in Fig. 1.

Fig.1.Spherical sodium carbonate particle into dissolution experiment.
3.Experimental methodology
The scheme of a typical dissolution experiment in this work is shown in Fig.2.For a typical dissolution experiment,one sample of spherical sodium carbonate particle is placed at the bottom of a transparent 12 mm square glass cell.The transparent 12 mm square glass cell used in this work is 12 mm glass cell(PCS115)purchased from Malvern Tec.The high-speed camera of Photron Fastcam SA5 is set-up with the frame of 50 FPS and resolution of 640×640 to record the dissolution process of this sample.When the high-speed camera starts to record,the cell is immediately filled with 0.2 ml solution.In this way,the dissolution process of the sample is recorded as a video and the video also is transferred into 50 images per second automatically.These images are then used to measure the diameter of particle with dissolution time.Because the density of sodium carbonate particles used in this work is assumed to be a constant, the concentration of dissolved sodium carbonate is calculated based on the measured diameter values.In this way,the dissolution rate constant is thus quantified based on the calculated concentration of sodium carbonate by fitting with the mathematical model for each case.
The solvent used in dissolution experiments is deionized water and it is prepared in advance to obtain required temperature and pH.To obtain different temperature,the deionized water is pre-heated to 30°C,40 °C,50 °C,60 °C and 70 °C respectively.Because the dissolution process is very fast and the temperature drops less than 1.5°C according to the test,it is unnecessary to heat the cell during the dissolution process and each temperature used for dissolution experiment can be considered as a constant.Besides the deionized water with different temperature,the deionized water is also prepared by mixing with standard pH buffer solution to obtain different pH.The standard pH buffer solutions used in this work are PHA-4 and PHA-10 buffer purchased from OMEGA.After adjusting the amount of pH buffer solution,the deionized water can sho was different pH as 4,7,8,9 and 10 respectively.These prepared deionized water with different pH are also used for the dissolution experiments in this work.
4.Mathematical Model
4.1.Surface reaction model
Surface reaction model assumes that the dissolution rate is proportional to the particle surface area and the dissolution process is not controlled by the mass transport of dissolved solute but rather depended on the chemical reaction on particle surface.In this way the chemical reaction on the particle surface can be considered as the limiting step of the dissolution process[12].
Normally the dissolution rate is expressed as Eq.(1).

where Kris the dissolution rate constant of surface reaction model,A is the surface area of spherical particle,C is the concentration of dissolved solute.
Because the shape and density of sodium carbonate particle is assumed as the constant during the dissolution process,the real-time surface area of the particle can be calculated with Eq.(2).

where A0is the initial surface area of particle,M0is the initial mass of particle and M is the mass of undissolved particle.
As the density of sodium carbonate is a constant in this work,the mass of undissolved particle is thus converted with the real-time concentration and initial concentration of sodium carbonate in solvent which is shown as Eq.(3).where C0is the initial concentration of sodium carbonate which always equals to 0 in this work and V is the volume of solution.


Fig.2.Scheme of a typical dissolution experiment.
Substituting the real-time surface area of particle with Eqs.(2)and(3),Eq.(1)is transformed into Eq.(4).

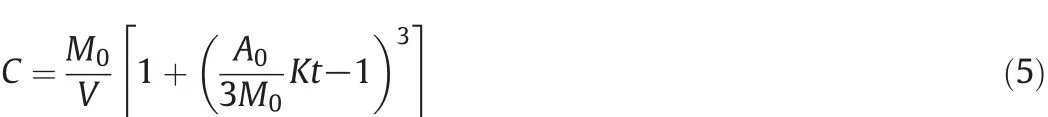
After integrating Eq.(4)with t=0 and C=0 at the starting point of dissolution process,Eq.(5)is obtained and used as the fitting equation to obtain the dissolution rate constant of surface reaction model.
4.2.Mass transport model
Based on the expression of dissolution rate shown in Eq.(1),the mass transport model takes into account the diffusion of dissolved sodium carbonate from particle surface into solvent and this diffusion is considered as the limiting step of dissolution process.This diffusion process is determined by the concentration difference of sodium carbonate between the concentration of sodium carbonate on particle surface and the concentration of sodium carbonate in solvent.The diffusion is also assumed to be one dimensional through a diffusion layer with a constant thickness.In this way,the dissolution rate of mass transport model can be expressed as Eq.(6).

where Kmis the dissolution rate constant of mass transport model;Csatis the concentration of dissolved solute on particle surface which is assumed to be equal with the saturation of sodium carbonate in water.
After substituting Eqs.(2)and(3)into Eq.(6),the dissolution rate can be transformed into Eq.(7).

With the integration of C=0 when t=0 at starting point of dissolution process,the equation of mass transport model is shown as Eq.(8)and then used as the fitting model to obtain the dissolution rate constant of mass transport model.

5.Results and discussions
According to the auto-saved images of dissolution process,the diameter of sodium carbonate particle is measured for each dissolution experiment.An example of the diameter measurement of sodium carbonate particle dissolving at 30°C is shown in Fig.3.With the diameter measurement shown in Fig.3,it is clearly shown that the diameter of this spherical sodium carbonate particle diminishes gradually with dissolution time.To obtain an accurate value of particle diameter at different dissolution time,a conception of particle diameter for measurement in this work requires to be de fined and discussed.Normally the diameter of a spherical or spherical-like particle for measurement can be considered as either the diameter of largest inscribed circle(Di)of particle or the diameter of smallest circumscribed circle(D).In this work,the percentage of difference between smallest circumscribed circle diameter minus the largest inscribed circle over smallest circumscribed circle diameter,(D?Di)/D,is always lower than 5%and this percentage of difference also decreases with dissolution time for every measurement.In this way the smallest circumscribed circle diameter of particle can be considered as the appropriate measured diameter in this work.Besides the determination of appropriate measured diameter,the measurement error of particle diameter also is caused by the resolution of image and the scale bar partially.The error comes from the measurement instrument systematically,however it is equivalent for every measurement and the value of error is negligible for the quantification of diameter.Therefore,it is convincing that the diameter of particle in this work can be measured accurately with the measurement of smallest circumscribed circle of each tested sodium carbonate particle and the value of measured particle diameter for each case is credible.

Fig.3.Diameter measurement of sodium carbonate particle dissolving at 30°C.

Fig.4.Measured diameter of sodium carbonate particle dissolving at different temperature.

Fig.5.Measured diameter of sodium carbonate particle dissolving at different pH.

Fig.6.Concentration of dissolved sodium carbonate at different temperature.

Fig.7.Concentration of dissolved sodium carbonate at different pH.
Based on the same measurement method shown above,the measured diameter of each sodium carbonate particle dissolving at each temperature and pH is plotted against dissolution time respectively.The results are shown in Figs.4 and 5.For the measurement of particle diameter,when the diameter of particle is small enough the particle will be disaggregate into several irregular parts and dissolve very soon within only few seconds. Under this situation, it is very difficult to define and quantify the size once the particle starts disaggregation, and it is not precise to just insert 0 at the end of each plot of diameter. Therefore, that means the last point of each diameter plot is the last time that also can define and measure the remaining particle as spheres. It can be noticed that for all tested particles, the diameter of final point of each particle is similar to be approximately 0.3mm. Therefore, it can be confirmed that the phenomenon of sodium carbonate diminishing is trustable and the measurement is repeatable.
With the measured diameter shown in Figs.4 and 5,the concentration of sodium carbonate in solution can be calculated with Eq.(9).The calculated concentrations of sodium carbonate at each temperature and pH are then plotted against dissolution time.The results of calculated concentration of dissolved sodium carbonate are shown in Figs.6 and 7.

where C is the concentration of sodium carbonate in solvent,M0is the initial mass of particle,D0is the initial diameter of particle which always equals to 1.5 mm,D is the real-time diameter of particle based on the values shown in Figs.4 and 5,V0is the volume of solvent.
In this work,the concentration of dissolved particle is based on the diameter of remaining particle.But it should be noticed that even if the diameter of particle is very difficult to define and measure after the disaggregation of the particle,the particle will finally dissolve completely in few seconds after disaggregation.So it can be con firmed that the concentration of sodium carbonate in solvent will reach final maximum level at the end.As it is explained that the dissolving phenomenon after disaggregation is so quick within few seconds,the concentration will therefore reach the final level at the next point just after the last point of diameter plot and the concentration will keep stable in the next seconds or hours because the principle of this work is based on the visual particle measurement of the particle and the disappearing of the particle is regarded as the completing of the dissolution process. The plots of concentration also confirmed this process over their time scale.
According to the results shown in Figs.6 and 7,the dissolution rate constant of each case is then quantified by fitting with surface reaction model and mass transport model separately.Based on surface reaction model,the concentration of dissolved sodium carbonate in solvent is fitted against dissolution time with Eq.(5).The fitting results with surface reaction model are shown in Figs.8 and 9.Based on mass transport model,f(C)is fitted with against dissolution time Eq.(8).The fitting results with mass transport model are shown in Figs.10 and 11.
According to the fitting results shown in Figs.8 and 10,the adjusted correlation coefficient values(R2)shown in Fig.10 are greater than the values shown in Fig.8 at all temperatures.The adjusted correlation coefficient values shown in Fig.10 are also high enough to suggest that the dissolution of single sodium carbonate particle with an increasing temperature is the mass transport controlled process where the diffusion of sodium carbonate from the particle surface into the solvent is the limiting step of this process,and the concentration difference between particle surface with the solvent is the driving force for the mass transport process of sodium carbonate.
Meanwhile,the adjusted correlation coefficient values shown in Figs.9 and 11 are both high enough to suggest the proper dissolution mechanism.Although the values from mass transport model are slightly higher than those from surface reaction model,it is also speculated that the dissolution process of single sodium carbonate particle at an increasing pH is controlled by both surface reaction process and mass transport process where the limiting steps are both the chemical reaction of dissolution at particle surface and also the diffusion of dissolved sodium carbonate traveling from particle surface into solvent.
In this way,the dissolution rate constants of single sodium carbonate particle at different temperature and pH are quantified and the results are shown in Tables 1 and 2 respectively.According to the results shown in Tables 1and 2 the dissolution rate constant apparently increases with temperature but decreases with pH significantly.
According to the results shown in Table 1,the dissolution rate constant apparently increases with temperature.The standard error also increases with temperature but the values are negligible to affect the conclusions.As the rate constant values shown in Table 1 obtained from the fitting with mass transport model,this in creasing rate constant is caused by the diffusion enhancement with the increasing temperature.Theoretically speaking,the diffusion coefficient can be interpreted with Einstein–Stokes equation that is expressed as Eq.(9).

where KBis Boltzmann's constant,T is the absolute temperature,α is the radius of spherical particle and μ is the kinematic viscosity of the medium.
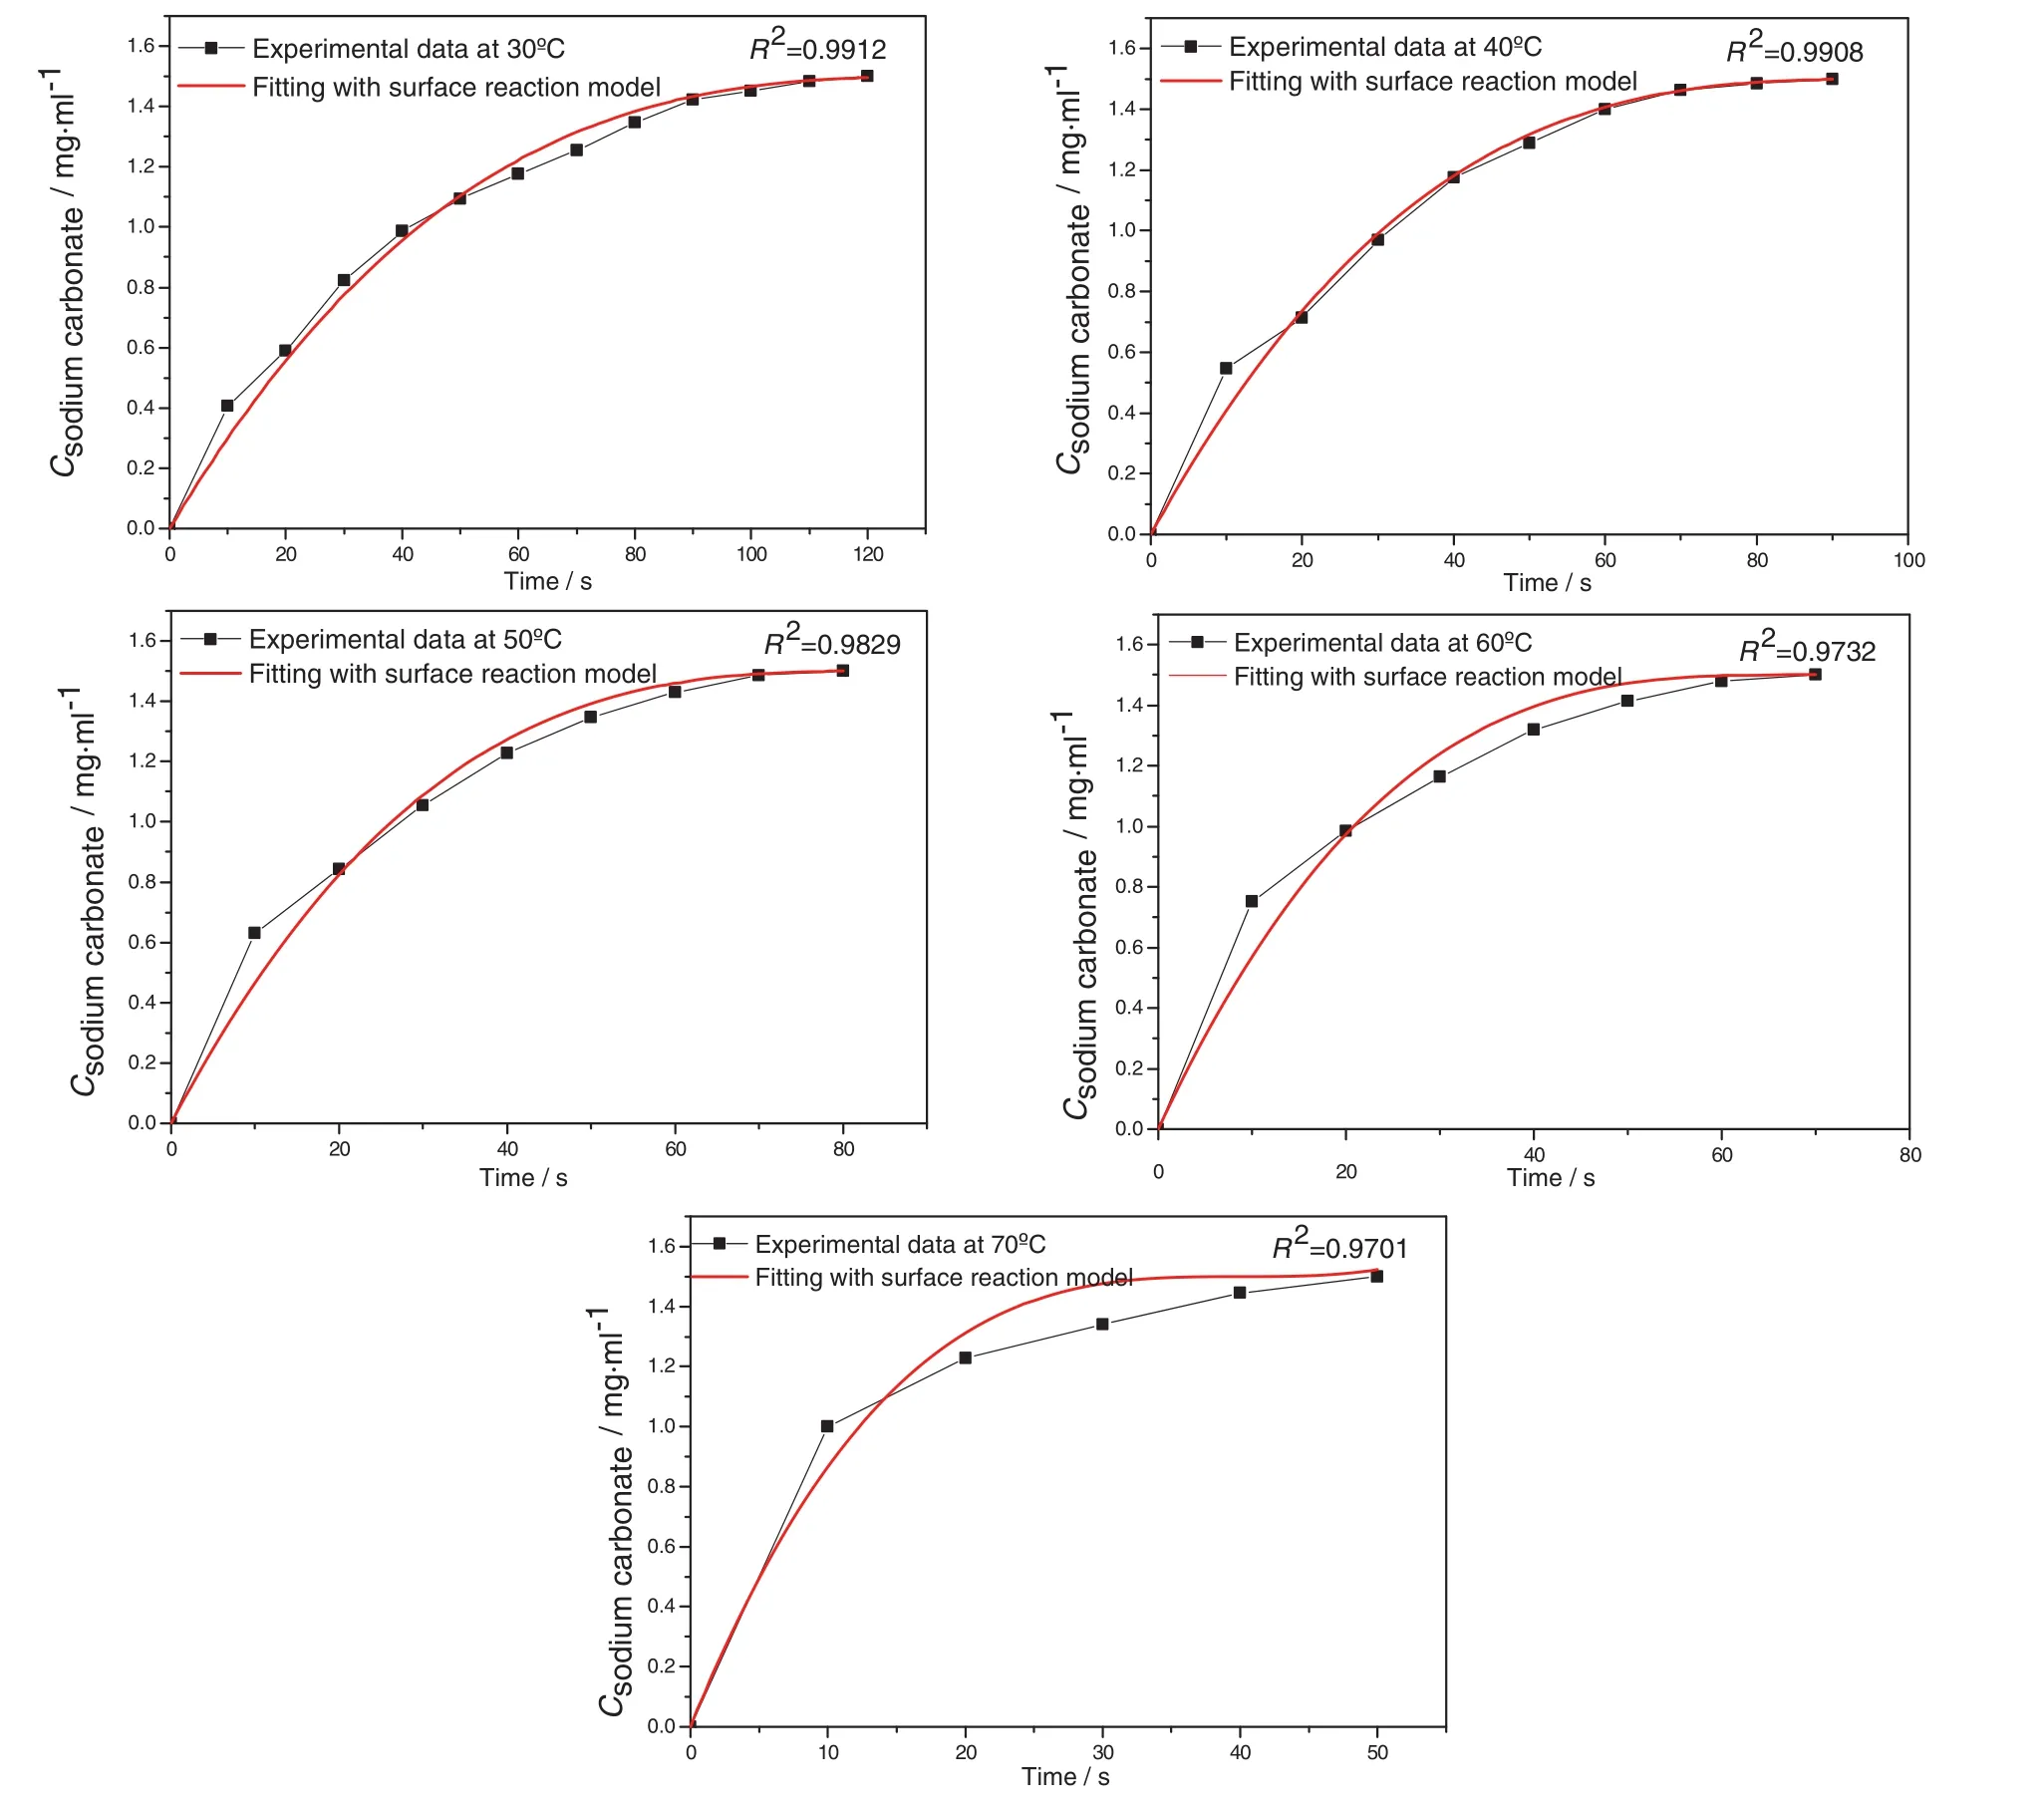
Fig.8.Fitting with surface reaction model for the dissolution experiment at 30 °C,40 °C,50 °C,60 °C,70 °C.

Fig.9.Fitting with surface reaction model for the dissolution experiment at pH 4,7,8,9,10.
For a specific experimental temperature in this work,the parameters of Boltzmann's constant,radius of sodium carbonate granule are constant and only the parameters of absolute temperature and viscosity of solution are variables.Therefore,the changes of absolute temperature and viscosity of the solvent with temperature are the decisive parameters to determine the change of diffusion coefficient with temperature.According to the reference viscosity of water over temperature 30 °C–70°C shown in Table 3[13]and the accepted value of Boltzmann constant in SI units which is 1.37 × 10?23J·K?1[14],the diffusion coefficient over different tested temperatures are calculated and the results are shown in Fig.12.According to Fig.12,it is clearly con firmed that the diffusion coefficient will increase with temperature increasing consequently.A higher diffusion coefficient normally reflects the quicker diffusion speed and process.Because the dissolution process of single sodium carbonate particle at the increasing temperature is controlled by the mass transport process,also known as a diffusion process,the dissolution rate constant of increasing with temperature therefore becomes an inevitable.This conclusion con firms the consequence of temperature's effect on dissolution kinetics from other previous works although these works target at other different materials with various methods for example Wang and Li's work on dissolution kinetics of granular calcium carbonate at 110–130 °C[15]and Li et al.'s work on dissolution behavior of sodium titanate in sodium aluminate solutions at 180–240 °C[16].
According to the results shown in Table 2,the dissolution rate constant from either surface reaction model or mass transport model decreases with the increasing of pH.As it is understood that the mass transport and diffusion process of sodium carbonate particle depends on the temperature's effect.For the circumstance of same temperature,the mass trans port process is hardly impacted due to the same diffusion coefficient at same temperature.Therefore,the decreasing of dissolution rate constant with the increasing pH in this work is con firmed to rely on the surface reaction process and the chemical reaction at particle surface is the decisive step for the dissolution of sodium carbonate particle at an increasing pH.
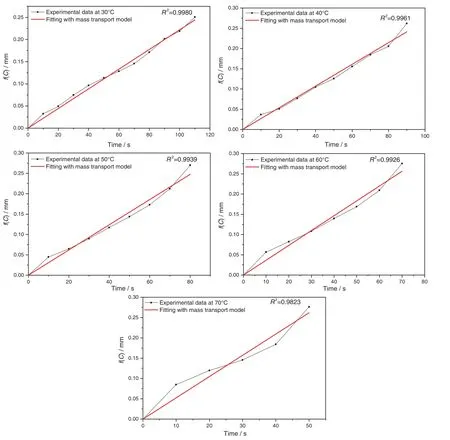
Fig.10.Fitting with mass transport model for the dissolution experiment at 30 °C,40 °C,50 °C,60 °C,70 °C.
For a typical chemical reaction of sodium carbonate in water at particle surface, it not only includes the ionization of sodium carbonate into sodium ions and carbonate ions,but also involves the possible hydrolysis reaction of ionized carbonate ions with H2O.This hydrolysis reaction is the process of carbonate ions reacting with hydrogen ions to form bicarbonate ions and hydroxide ions. The hydrolysis reaction of carbonate ions is reversible and the equilibrium is sensitive.The formula of ionization and hydrolysis reaction is shown in Eq.(10).Although the amount of ionized hydrogen ions in water is very low,the hydrolysis reaction also leads the dissolved sodium carbonate solution to weak alkaline.The increasing pH is usually understood as the increasing of hydroxide ions,therefore the chemical equilibrium of hydrolysis reaction will be broken and an unfavorable direction of chemical reaction happens to inhibit the hydrolysis reaction and also ionization reaction of sodium carbonate.In this way,the increasing pH is con firmed to weaken the surface chemical reaction of sodium carbonate and the dissolution process is also reduced because it is controlled by the surface chemical reaction.

6.Conclusions

Fig.11.Fitting with mass transport model for the dissolution experiment at pH 4,7,8,9,10.
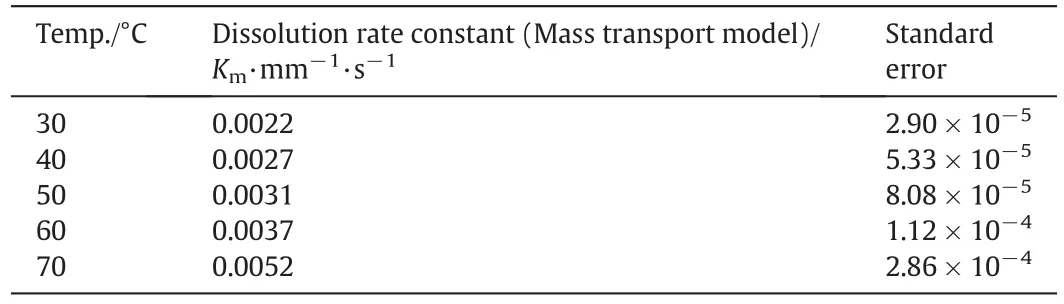
Table 1 Dissolution rate constant Kmat different temperature

Table 2 Dissolution rate constant Km/Krat different pH

Table 3 Viscosity of water from 30 °C to 70 °C
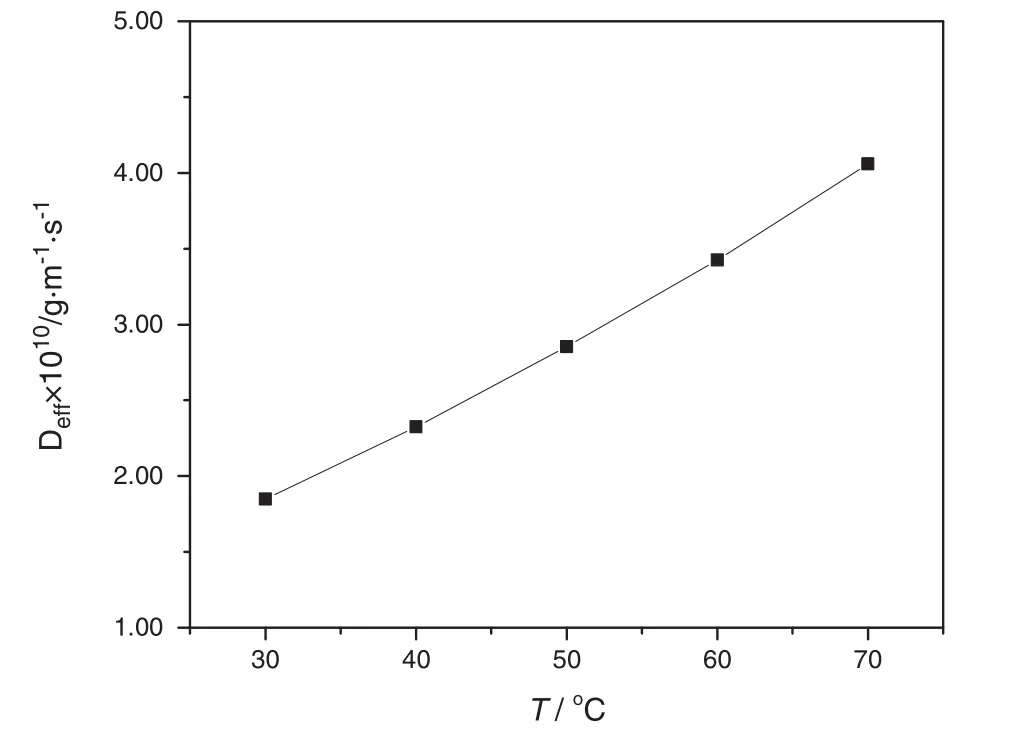
Fig.12.Diffusion coefficient of sodium carbonate particle over different dissolution temperature.
Dissolution kinetics of single sodium carbonate particle is investigated successfully in this work with image analysis method. Image analysis method is well applied into the measurement of dissolution process of single sodium carbonate particle,and both surface reaction model and mass transport model are successfully implemented as the mathematical model to evaluate the dissolution mechanism and quantify the dissolution rate constant.According to the fitting results with both two dissolution models,it is con firmed that the dissolution process of single sodium carbonate particle at a fixed pH but increasing temperature is controlled by the mass transport(diffusion)of dissolved sodium carbonate from particle surface into solvent.The dissolution process at a fixed temperature but increasing pH is controlled by the chemical reaction of sodium carbonate with water at particle surface.In this way with the increasing temperature,the dissolution rate constant of mass transport model is quantified to increase with temperature because of the diffusion enhancement with the temperature increasing.With the increasing pH,the dissolution rate constant of surface reaction model is also quantified to decrease with pH because of the weakness of chemical reaction of sodium carbonate at the experimental condition of increasing pH.
Acknowledgements
I would like to thank the Institute of Particle and Science Engineering,University of Leeds and Procter &Gamble Newcastle Innovation Centre(UK)for partially funding the project.
[1]W.I.Higuchi,Diffusional models useful in biopharmaceutics:Drug release rate processes,J.Pharm.Sci.56(3)(1967)315–324.
[2]J.Philibert,One and a half century of diffusion:Fick,Einstein,before and beyond,Diff.Fundam.2(1)(2005)1–10.
[3]A.A.Noyes,W.R.Whitney,The rate of solution of solid substances in their own solutions,J.Am.Chem.Soc.19(12)(1897)930–934.
[4]A.W.Hixson,J.H.Crowell,Dependence of reaction velocity upon surface and agitation,Ind.Eng.Chem.23(10)(1931)1160–1168.
[5]M.Dali,Determination of mass transfer dissolution rate constants from critical time of dissolution of a powder sample,Pharm.Dev.Technol.4(1)(1999)1–8.
[6]S.V.Dorozhkin,Fundamentals of the wet-process phosphoric acid production:1.Kinetics and mechanism of the phosphate rock dissolution,Ind.Eng.Chem.Res.35(11)(1996)4328–4335.
[7]S.L.Raghavan,R.I.Ristic,D.B.Sheen,J.N.Sherwood,Dissolution kinetics of single crystals of α-lactose monohydrate,J.Pharm.Sci.91(10)(2002)2166–2174.
[8]F.?těpánek,Computer-aided product design:Granule dissolution,Chem.Eng.Res.Des.82(11)(2004)1458–1466.
[9]J.Swarbrick,D.Ma,In vitro dissolution of dapsone,J.Pharm.Pharm.33(1)(1981)787–789.
[10]D.E.Wurster,P.W.Taylor,Dissolution rates,J.Pharm.Sci.54(2)(1965)169–175.
[11]N.A.Riley,Projection sphericity,J.Sediment.Res.11(2)(1941)94–95.
[12]R.G.Haverkamp,B.J.Welch,Modelling the dissolution of alumina powder in cryolite,Chem.Eng.Process.37(2)(1998)177–187.
[13]L.Korson,W.Drost-Hansen,F.J.Millero,Viscosity of water at various temperatures,J.Phys.Chem.73(1)(1969)34–39.
[14]W.Lopes,Boltsmann's constant,Rev.Bras.Ensino Fis.32(3)(2010)1–4.
[15]T.Wang,Z.Li,Dissolution kinetics of granular calcium carbonate in concentrated aqueous sodium dichromate solution at pH 6.0–7.0 and 110–130 °C,J.Colloid Interface Sci.281(2005)130–135.
[16]X.Li,S.Yu,et al.,Dissolution behaviour of sodium titanate in sodium aluminate solutions at elevated temperatures,Hydrometallurgy 147-148(2014)73–78.
 Chinese Journal of Chemical Engineering2016年10期
- Chinese Journal of Chemical Engineering的其它文章
- CFD modeling of a headbox with injecting dilution water in a central step diffusion tube☆
- Interactions between two in-line drops rising in pure glycerin☆
- Hydrodynamics of three-phase fluidization of homogeneous ternary mixture in a conical conduit—Experimental and statistical analysis
- Adsorption of Hg(II)from aqueous solution using thiourea functionalized chelating fiber☆
- Nickel(II)removal from water using silica-based hybrid adsorbents:Fabrication and adsorption kinetics☆
- Reactive dividing wall column for hydrolysis of methyl acetate:Design and control☆