
Hydrodynamics of three-phase fluidization of homogeneous ternary mixture in a conical conduit—Experimental and statistical analysis
2016-05-26 09:28PadhiDoraYMohantyGRoyBSarangi
R.K.Padhi*,D.T.K.DoraY.K.MohantyG.K.RoyB.Sarangi
1Department of Chemical Engineering,GIET,Gunupur-765 022,Rayagada,Odisha,India
2Department of Metallurgical Engineering,IGIT,Saranga,Dhenkanal,Odisha,India
1.Introduction
With the development of fluidized bed coal combustion,the recent interest in the use of fluidized beds for waste utilization and dry solids separation and the potential applications of multi-component fluidized beds is on the rise.It is because of the fact that fluidized particles of uniform in size at the beginning,may change due to attrition,coalescence and chemical reaction,thereby affecting the quality of fluidization by high elutriation loss,de- fluidization,segregation,and inhomogeneous residence time in the bed leading to non-uniform products of wide particle size distribution.Therefore,Sau et al.[1]stated that proper characterization of bed dynamics for binary and multi-component mixtures in gas–solid systems is an important prerequisite for their effective utilization,where the combination of particle size,density and shape influences fluidization behavior.
Biswal et al.[2–4]developed theoretical models for minimum fluidization velocity and bed pressure drop for spherical particles for gas–solid systems in conical vessels.Due to angled walls,random and unrestricted particle movement occurs in a tapered surface with reduced back mixing.They,therefore,proposed a modified equation for calculation of the maximum pressure drop.Later,Peng and Fan[5]made an in-depth study of hydrodynamic characteristics of solid–liquid fluidization in a tapered bed and derived theoretical models for the prediction of minimum fluidization velocity and maximum pressure drop,based on the dynamic balance of forces exerted on the particle.However,the experiments were carried out for spherical particles only.Jing et al.[6]and Shan et al.[7]proposed models for ΔPmfand Umffor gas–solid conical fluidized beds for spherical coarse and fine particles based on Peng and Fan[5]models,but neglected pressure drop due to the kinetic change in the bed.
A correlation for fluctuation ratio in conical vessels for regular particle has been developed by Biswal et al.[8]using dimensional analysis approach based on four dimensionless groups neglecting the effect of density of gas and solid particles.They have developed a correlation for the bed fluctuation ratio for irregular particles in conical vessel.Singh et al.[9]have developed correlations for bed fluctuation ratio for binary homogeneous and heterogeneous mixtures of spherical and non-spherical particles in conical conduits.Singh et al.[10,11]have also developed correlations for bed expansion ratio for cylindrical and non-cylindrical beds.Dora et al.[12]have studied the bed expansion and fluctuation ratios in a gas–solid conical fluidized bed for homogeneous ternary mixture of irregular particles.
Current literature deals with the development of mathematical models for fluctuation and expansion ratios for ternary mixtures in a conical bed with different cone angles.Practically no work has been carried out for three-phase fluidization in a conical bed. The objective of the present work is to study the hydrodynamic characteristics of ternary mixture in a three-phase conical fluidized bed with different cone angles 4.61°,5.13°,7.47°and 11.2°(incorporating the similar values of the earlier study[12])and to develop a mathematical model for the determination of fluctuation and expansion ratios by statistical analysis.
2.Materials and Methods
The experimental set-up consists of a single stage air compressor of sufficient capacity,an accumulator for storage of air at constant pressure 137895Pa(20 pound per square inch,gauge),a water tank and a liquid pump 373W(0.5 HP)as shown in Fig.1.
Two rotameters,one for water(0–10 L·min?1)and the other for air(0–50 L·min?1)were used to measure the water and air flow rates respectively.A40mesh screen at the bottom served as the support as well as the distributor.The inside hollow space of the distributor was filled with glass beads of 1.5 cm outer diameter for uniform water and air distribution.The conical conduits with different cone angles are made up of Perspex sheets to allow visual observation.Detailed dimensions for the conical conduits used are given in Table 1.
Two pressure tapings were provided with for noting the bed pressure drop.A gate valve of 15 mm inner diameter was provided in the line to control the water flow to the bed.Two sets of manometer with carbon tetrachloride(for low pressure range)and mercury(for high pressure range)as manometric liquid were used to record the pressure drop.A high speed digital camera has been used for verification of the maximum and minimum heights of the bed during fluidization.
Three closely-sized samples of dolomite(as shown in Table 2)were used for the investigation.For ternary mixtures,fairly good mixing has been achieved by coning and quartering method as done inexperimental practice and classification has been avoided since the ratio of the particle-sizes of two successive fractions in the mixture was kept below 1.3.The scope of the experiments has been presented in Table 2.The weighed quantity of the mixture was poured into the conical column.Prior to recording any data the charge was vigorously fluidized with water at a velocity at which entrainment was not observed.After a certain time,the water flow was suddenly stopped to obtain a mixed packed bed and then the data were collected.Then the velocity of the water was increased slowly allowing sufficient time to reach a steady state.Then air was passed through the bed as a dispersed phase.The velocity of the air was increased slowly allowing sufficient time to reach a steady state.

Table 1 Dimensions of conical conduits

Table 2 Scope of the Experiment
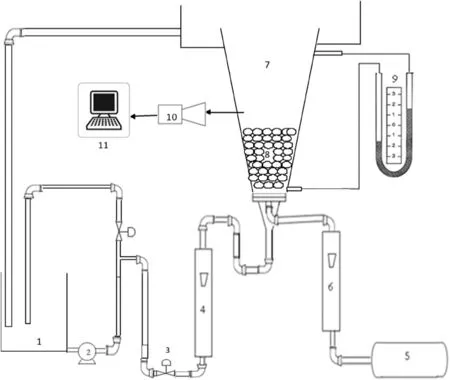
Fig.1.Schematic diagram of experimental set-up.
The rota meter and manometer readings were noted for each increment in flow rate from which the values of the superficial gas velocity and pressure drop were calculated.The above procedure was repeated for different values of initial static bed heights,mixture compositions,and cone angles.
For statistical analysis,the response has been used to develop an empirical model by statistical analysis that correlates the response of fluidized bed with process variables using a second-degree polynomial equation as given by Eq.(1).

where Y is the predicted response,b0′,the constant coefficient,bi,the linear coefficients,bij,the interaction coefficients,bii,the quadratic coefficients and Xiand Xjare the coded values of process variables.The number of tests required for the CCD includes the standard 2n factorial with its origin at the center,2n points fixed axially at a distance,say β,from the center to generate the quadratic terms,and replicate tests at the center;where n is the number of variables.The axial points are chosen such that they allow rot at ability which ensures that the variance of the model prediction is constant at all points equidistant from the design center.Replicates of the test at the center are very important as they provide an independent estimate of the experimental error.For five variables,the recommended number of tests at the center is six.

Once the desired range of values of the variables are defined,they are coded to lie at±1 for the factorial points,0 for the center points and±β for the axial points.Central Composite Design(CCD)has been used to develop correlations with five independent variables for three depend ant variables such as bed pressure drop(ΔPf),bed fluctuation ratio(r)and bed expansion ratio(R).To estimate the bed pressure drop,bed fluctuation and expansion ratios of regular ternary mixture in a three-phase fluidized bed,empirical models have been developed by using statistical software package design expert 8,Stat-Ease,Inc.,Minneapolis,USA.On the basis of experimental data the models are developed by employing RSM based CCD[12–14].Analysis of variance(ANOVA)has been used to estimate the statistical parameter.
3.Results and Discussion
From the experimental result it was seen that the three responses might be influenced by superficial gas velocity(Vg),superficial liquid velocity(Vl),initial static bed height(Hs),average particle size(Dpavg)and cone angle(α).Table 3 represents level of variables whereas Table 4shows design of experiment together with the experimental result for the three responses.Each set of experiments is repeated for five times in order to remove the experimental error.Again,runs 43–50 at the center point have been used to determine the experimental error.According to the sequential model sum of squares, the models have been selected on the basis of the highest order polynomials where the additional terms are significant and the models are not aliased.The quadratic model has been selected.Experiments have been planned to obtain a quadratic model consisting of 25trials plus a star configuration(β= ±2)and their replicates at the center point.

Table 3 Level of independent variable
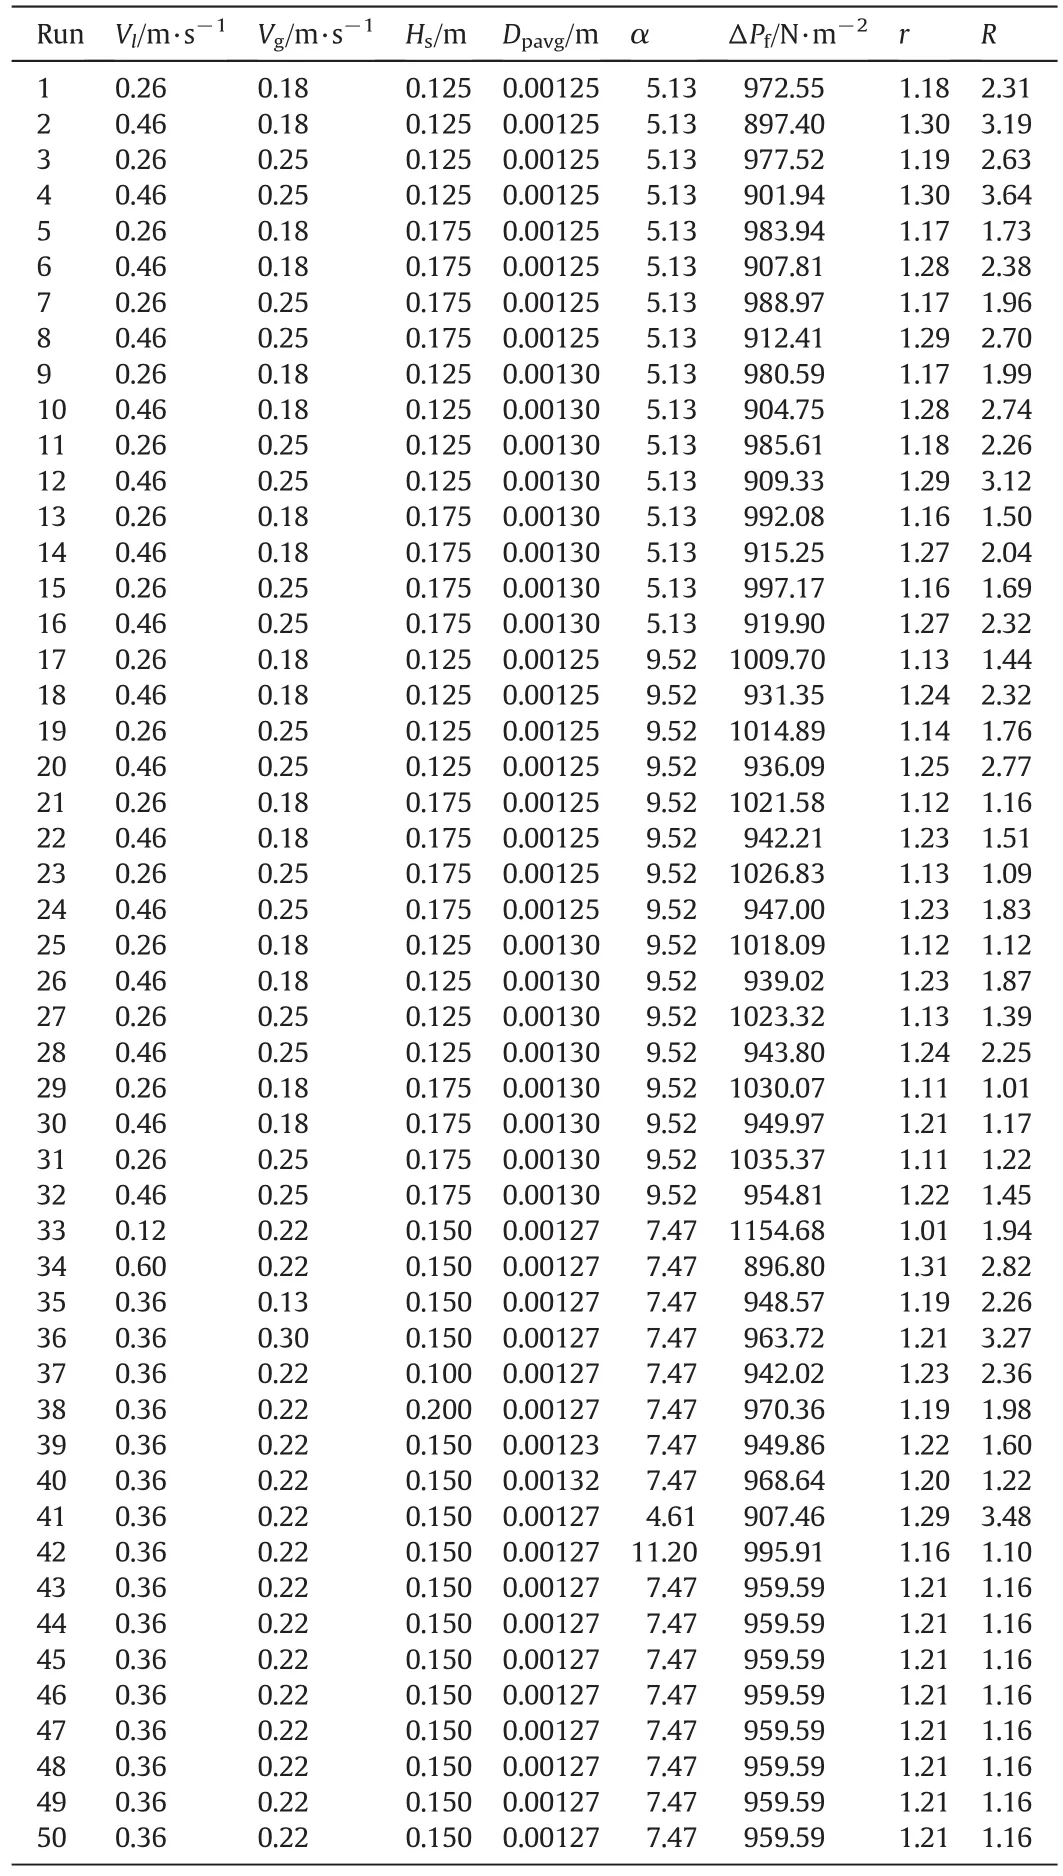
Table 4 Design of experiments
3.1.Bed pressure drop
The final empirical models in terms of coded factor excluding the insignificant terms for bed pressure drop,(ΔPf)have been presented in Eq.(3).


Table 5 ANOVA for bed pressure drop
The positive sign shows that the parameter has a synergistic effect while the negative sign shows the antagonistic effect of the system parameter.Analysis of variance(ANOVA)is a collection of statistical models used to analyze the differences among group means and their associated procedures(such as“variation”among and between groups).The Analysis of variance(ANOVA)for bed pressure drop is shown in Table 5.

Fig.2.Comparison of calculated values of bed pressure drop from Eq.(1)with the experimental ones.
The F-value for the models as depicted in Eq.(3)is found to be 72.26,which implies that the models are Significant.There is only 0.01%chance that a “Model F-value”this large could occur due to noise.Value of“Prob > F”less than 0.0500 indicates that model terms are Significant.Thus,for bed pressure drop the model terms A,B,C,D,E,AE,BE,A2and E2are Significant.Fig.2 shows the comparison study of the predicted and actual data obtained for bed pressure drop.In Fig.2,the value of coefficient of correlation(R2)is found to be 0.9803,which shows that the model developed agree well with the experimental data.The adequate precision of 41.81 obtained for bed pressure drop indicates an adequate signal.Thus,the model evaluated can be used to navigate the design space.The fair correlation coefficients might have resulted by the insignificant terms in Table 4 and is most likely due to five different variables selected in wide ranges with a limited number of experiments as well as the nonlinear influence of the investigated parameters on process response.

Fig.3.Combined effect of cone angle and air velocity on bed pressure drop at Vl=0.22 m·s?1,HS=0.15 m and mixture of 20:50:30.
Fig.3 shows the combined effect of superficial air velocity and cone angle on the bed pressure drop at a liquid velocity of 0.22 m·s?1,initial static bed height of 0.15m and for a mixture of20:50:30.It has been observed that with increase in air velocity the bed pressure drop decreases,which may be due to increase in the gas hold up which in turn decreases the density of the mixture.It is also observed that with increase in cone angle the bed mass increases;so that the bed pressure drop increases in order to counter balance the weight of the bed material.Though the cone angle has a synergistic effect on bed pressure drop,the combined effect of cone angle and superficial velocity of air has the antagonistic effect.This is due to the fact that as the cone angle increases bed mass increases and which is predominated by the increase in gas hold-up which is in turn due to increase in superficial air velocity.
Similarly,Fig.4 shows the combined effect of liquid velocity and cone angle on the bed pressure drop at constant air velocity of 0.36 m·s?1,initial static bed height of 0.15 m and for a mixture of 20:50:30.It has been observed that with increase in both liquid velocity and cone angle the bed pressure drop increases.The three dimensional response surface curve i.e.the combined effect of cone angle and initial static bed height at constant air velocity of 0.36m·s?1,water velocity of 0.22 m·s?1and a mixture of 20:50:30 is presented as Fig.5.The bed pressure drop increases with increase in initial static bed height.The reason for increase is similar to that of increase in bed pressure drop for cone angle.Similarly,Fig.6 shows the combined effect of cone angle and average particle size on bed pressure drop at constant air velocity of 0.36 m·s?1,water velocity of 0.22 m·s?1and initial static bed height of 0.15m.It has been observed that with increase in fines the bed pressure drop decreases which is due to decrease in weight of the bed.It is evident from Figs.4,5 and 6 that the cone angle,superficial liquid velocity,initial static bed height and average particle size have synergistic effect,so their combined effects have also give synergistic effect on the bed pressure drop.
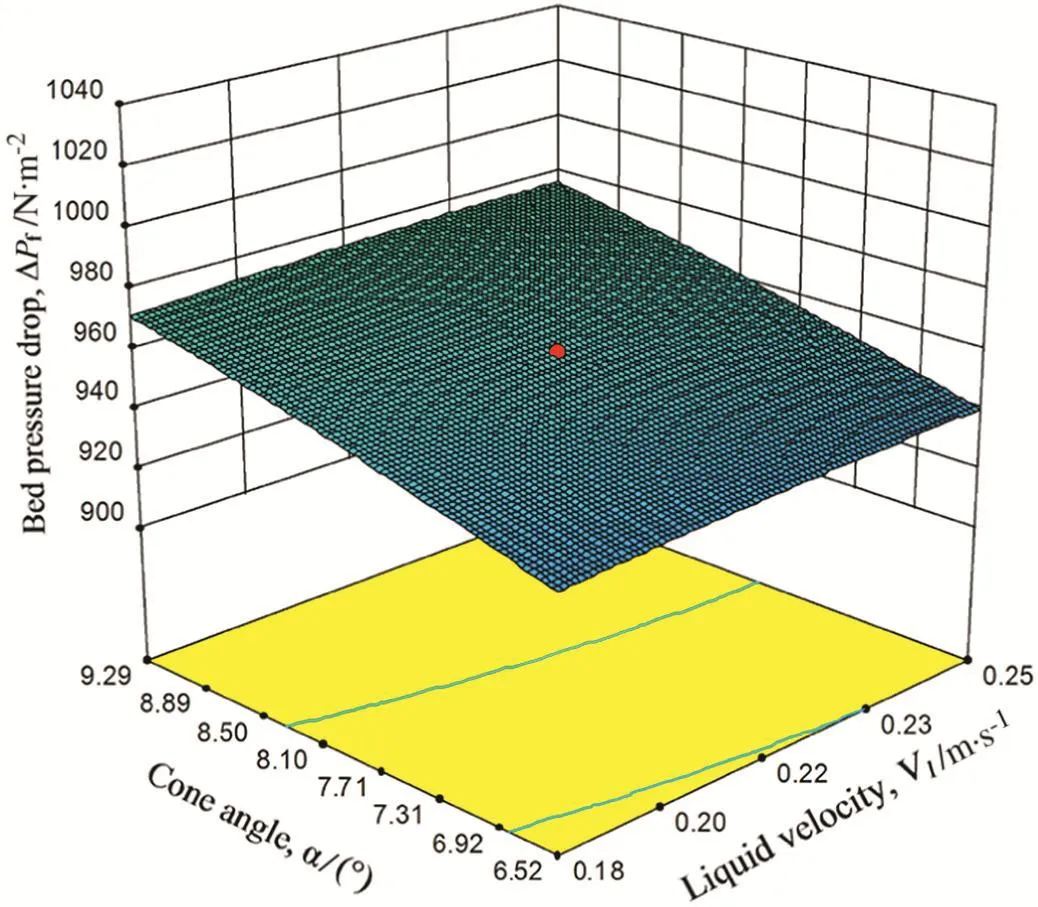
Fig.4.Combined effect of cone angle and liquid velocity on bed pressure drop at Vg=0.36 m·s?1,HS=0.15 m and mixture of 20:50:30.
3.2.Bed fluctuation ratio
The final empirical models in terms of coded factor excluding the in Significant terms for bed fluctuation ratio,(r)have been presented in Eq.(4).


Fig.5.Combined effect of cone angle and initial static bed height on bed pressure drop at Vl=0.22 m·s?1,Vg=0.36 m·s?1and mixture of 20:50:30.

Fig.6.Combined effect of cone angle and average particle size on bed pressure drop at Vl=0.22 m·s?1,Vg=0.36 m·s?1and HS=0.15 m.
The Analysis of variance(ANOVA)for bed fluctuation ratio is shown in Table 6.The F-value for the models as depicted in Eq.(4)is found to be 176.07,which implies that the models are Significant.For bed fluctuation ratio the model terms A,B,C,D,E,AB,AC,AD,A2,C2and E2are Significant.
Fig.7 shows the comparison study of the predicted and actual data obtained for bed fluctuation ratio.In Fig.7,the value of coefficient of correlation(R2)is found to be 0.9918,which shows that the model developed agree well with the experimental data.The adequate precision of 62.83 obtained for bed fluctuation ratio indicates an adequate signal.
The three dimensional response curve showing the combined effect of liquid and air velocity on bed fluctuation ratio at constant initial static bed height of 0.15m,mixture of20:50:30and cone angle of 7.47°is presented as Fig.8.
It has been observed that with increase in both liquid and air velocity the bed fluctuation ratio increases because of increase in upward thrustgiven by liquid and gas.It is also observed that the combined effect of superficial liquid and air velocity gives a synergistic effect.Fig.9 shows the combined effect of initial static bed height and air velocity at constant liquid velocity of 0.22 m·s?1,cone angle of 7.47°and mixture of 20:50:30.Bed fluctuation ratio decreases with respect to the initial static bed height,because with increase in initial static bed height the weight of the bed increases and therefore the vertical lift of upper segment of the particles decreases.The combined effect of cone angle and air velocity on bed fluctuation ratio at constant liquid velocity of 0.22 m·s?1,initial static bed height of 0.15 m and for a mixture of 20:50:30 is presented in Fig.10.It has been observed that with increase in cone angle the bed fluctuation ratio decreases,which is due to decrease in local superficial air velocity at the upper region of the bed with gradual increase in conduit cross-sectional area,thereby decreasing the vertical lift of the particles to a considerable extent and reducing the fluctuation of the top layer of the expanded bed surface.

Table 6 ANOVA for bed fluctuation ratio

Fig.7.Comparison of calculated values of bed fluctuation ratio from Eq.(2)with the experimental ones.

Fig.8.Combined effect of air and water velocity on bed fluctuation ratio at HS=0.15 m,α=7.470 and mixture of 20:50:30.

Fig.9.Combined effect of air velocity and initial static bed height on bed fluctuation ratio at α =7.470,Vl=0.22 m·s?1and mixture of 20:50:30.

Fig.10.Combined effect of cone angle and water velocity on bed fluctuation ratio at HS=0.15 m,Vl=0.22 m·s?1and mixture of 20:50:30.

Fig.11.Combined effect of average particle size and water velocity on bed fluctuation ratio at HS=0.15 m,α =7.470 and Vl=0.22 m·s?1.
Similarly Fig.11 shows the combined effect of average particle size and air velocity on the bed fluctuation ratio at constant liquid velocity of 0.22 m·s?1,initial static bed height of 0.15 m and cone angle of 7.47°.It is clear from Fig.11 that with increase in particle diameter(i.e.decrease in percentage fines in the mixture),the bed fluctuation ratio(r)decreases.This is due to the fact that with decrease in fines,there is relatively less entrainment of fine solids by the rising bubbles,thereby decreasing the range of fluctuation of the upper layer of the expanded bed and thus reducing the bed fluctuation ratio.From Figs.9,10 and 11,it is observed that the interaction effect of initial static bed height,cone angle,and average particle size with superficial air velocity gives an antagonistic effect on fluctuation ratio.This is due to the fact that the synergistic effect of superficial gas velocity on bed fluctuation ratio is predominated by the antagonistic effect of initial static bed height,cone angle,and average particle size.
3.3.Bed expansion ratio
The final empirical models in terms of coded factor excluding the in Significant terms for bed expansion ratio,(R)have been presented in Eq.(5).

The Analysis of variance(ANOVA)for bed fluctuation ratio is shown in Table 7.The F-value for the models as depicted in Eq.(5)is found to be 34.82,which implies that the models are Significant.For bed expansion ratio the model terms A,B,C,D,E,AB,AC,AD,AE,CD,A2,B2,C2and E2are Significant.

Table 7 ANOVA for bed expansion ratio
Fig.12 shows the comparison study of the predicted and actual data obtained for bed expansion ratio.In Fig.12,the value of coefficient of correlation(R2)is found to be 0.96,which shows that the model developed agrees well with the experimental data.The adequate precision of 21.78 obtained for bed fluctuation ratio indicates an adequate signal.
Fig.13 shows the combined effect of initial static bed height and air velocity on bed fluctuation ratio at constant water velocity of 0.22 m·s?1,cone angle of 7.47°and mixture of 20:50:30.
It has been observed that with increase in air velocity the bed expansion ratio increases whereas the bed expansion ratio decreases with increase in initial static bed height.The combined effect of average particle size and air velocity on bed expansion ratio at constant water velocity of 0.22 m·s?1,cone angle of 7.47°and initial static bed height of0.15m is shown as Fig.14.The bed expansion ratio decreases with increase in particle size of the bed material.Similarly,Fig.15 shows the combined effect of cone angle and air velocity on bed expansion ratio at constant water velocity of 0.22 m·s?1,initial static bed height of 0.15 m and mixture of 20:50:30.The bed expansion ratio decreases with increase in the cone angle.The combined effect of air and water velocity on bed expansion ratio at constant initial static bed height of 0.15 m,cone angle of 7.47°and mixture of 20:50:30 is shown in Fig.16.It has been clear from Fig.16 that the bed expansion ratio increases with increase in liquid velocity.The reasons are the same as those that have been explained in Section 3.2 above for the bed fluctuation ratio in these cases.The combined effect of the system variables on bed expansion ratio is similar to bed fluctuation ratio as discussed in Section 3.2.

Fig.12.Comparison of calculated values of bed expansion ratio from Eq.(3)with the experimental ones.

Fig.13.Combined effect of initial static bed height and air velocity on bed expansion ratio at α =7.470,Vl=0.22 m·s?1and mixture of 20:50:30.

Fig.14.Combined effect of average particle size and water velocity on bed expansion ratio at HS=0.15 m,α =7.470 and Vl=0.22 m·s?1.

Fig.15.Combined effect of cone angle and air velocity on bed expansion ratio at Vl=0.22 m·s?1,HS=0.15 m and mixture of 20:50:30.
4.Conclusions

Fig.16.Combined effect of air and water velocity on bed expansion ratio at HS=0.15 m,α=7.470 and mixture of 20:50:30.
In this study,the hydrodynamic behavior of three-phase fluidized bed for homogenous ternary mixture in conical conduits has been carried out.In three-phase fluidization,the hydrodynamic variables studied are pressure drop,bed fluctuation and bed expansion ratios.As pressure drop in a fluidization system is an important parameter for the design and fabrication of the fluidized bed reactor,its value should be as low as possible from economic point of view.In this study by the use of a secondary fluidizing medium(gas)beyond fluidization the bed pressure drop can be greatly reduced.Simultaneously the study of RSM based CCD and Quadratic Programming(QP)are used to model the influence of five process parameters on the three responses.Mathematical model equations are derived for the three responses by using sets of experimental data and Analysis of variance(ANOVA).Further developed correlations for the three responses can be used effectively within the design space with very good correlation coefficient and 95%confidence level and also for the design of a three-phase conical fluidized bed system with homogeneous ternary mixtures of irregular particles of bed materials within the ranges of the operating parameters investigated to decolorize the paper mill ef fl uent by using an industrial waste as a novel adsorbent.

[1]D.C.Sau,S.B.Mohanty,K.C.Biswal,Correlations for critical fluidization velocity and maximum bed pressure drop for heterogeneous binary mixture of irregular particles in gas–solid tapered fluidized beds,Chem.Eng.Process.47(2008)2386–2390.
[2]K.C.Biswal,S.Sahu,G.K.Roy,Prediction of fluctuation ratio for gas–solid fluidization of regular particles in conical vessels,Chem.Eng.J.23(1982)97.
[3]K.C.Biswal,B.B.Samal,G.K.Roy,Dynamics of gas–solid fluidization of regular particles in conical vessels,J.Inst.Eng.(India)65(1984)(CH 1).
[4]K.C.Biswal,T.Bhowmik,G.K.Roy,Prediction of minimum fluidization velocity for gas–solid fluidization of regular particles in conical vessels,Chem.Eng.J.30(1985)57–62.
[5]Y.Peng,L.T.Fan,Hydrodynamic characteristics of fluidization in liquid–solid tapered beds,Chem.Eng.Sci.52(14)(1997)2277–2290.
[6]S.Jing,Q.Hu,J.Wang,Y.Jin,Fluidization of coarse particles ingas–solid conical beds,Chem.Eng.Process.39(2000)379–387.
[7]J.Shan,C.Guobin,M.Fan,B.Yu,W.Jingfu,J.yong,Fluidization of fine particles in conical beds,Powder Technol.11(8)(2001)271–274.
[8]K.C.Biswal,T.Bhowmik,G.K.Roy,Prediction of pressure drop for a conical fixed bed of spherical particles in gas–solid systems,Chem.Eng.J.29(1984)47–50.
[9]K.C.Biswal,G.K.Roy,Prediction of fluctuation ratio for gas–solid fluidization of irregular particles in conical vessels,J.Inst.Eng.(India)65(1985)32–35(CH 2).
[10]R.K.Singh,G.K.Roy,A.Suryanarayana,Prediction of fluctuation ratio for binary mixtures of non-spherical particles in conical beds,Indian Chem.Eng.XXXIII(2)(1991)26–28.
[11]R.K.Singh,A.Suryanarayana,G.K.Roy,Prediction of bed expansion ratio for gas–solid fluidization in cylindrical and non-cylindrical conduits,J.Inst.Eng.(India)79(1999)51–54.
[12]T.K.Dora,S.R.Panda,Y.K.Mohanty,G.K.Roy,Hydrodynamics of gas–solid fluidization of a homogeneous ternary mixture in a conical bed:Prediction bed fluctuation and expansion ratios,Particuology 11(2013)681–688.
[13]G.E.P.Box,J.S.Hunter,Multi-factor experimental design for exploring response surfaces,Ann.Math.Stat.28(1957)195–241.
[14]G.E.P.Box,W.G.Hunter,The 2k-p fractional designs,parts I and II,J.Technometr.3(1961)311–458.
 Chinese Journal of Chemical Engineering2016年10期
- Chinese Journal of Chemical Engineering的其它文章
- CFD modeling of a headbox with injecting dilution water in a central step diffusion tube☆
- Interactions between two in-line drops rising in pure glycerin☆
- Adsorption of Hg(II)from aqueous solution using thiourea functionalized chelating fiber☆
- Nickel(II)removal from water using silica-based hybrid adsorbents:Fabrication and adsorption kinetics☆
- Reactive dividing wall column for hydrolysis of methyl acetate:Design and control☆
- Treatment of compost leachate by the combination of coagulation and membrane process☆