
Genetic Structure of the Red-spotted Tokay Gecko, Gekko gecko(Linnaeus, 1758) (Squamata: Gekkonidae) from Mainland Southeast Asia
2019-06-26 03:03WeerachaiSAIJUNTHASutthiraSEDLAKTakeshiAGATSUMAKamonwanJONGSOMCHAIWarayuttPILAPWateeKONGBUNTADWittayaTAWONGWarongSUKSAVATETrevorPETNEYandChairatTANTRAWATPAN
Asian Herpetological Research 2019年2期
Weerachai SAIJUNTHA, Sutthira SEDLAK, Takeshi AGATSUMA, Kamonwan JONGSOMCHAI, Warayutt PILAP, Watee KONGBUNTAD, Wittaya TAWONG,Warong SUKSAVATE, Trevor N. PETNEY and Chairat TANTRAWATPAN
1 Walai Rukhavej Botanical Research Institute, Biodiversity and Conservation Research Unit, Mahasarakham University, Maha Sarakham 44150, Thailand
2 Department of Environmental Medicine, Kochi Medical School, Kochi University, Oko, Nankoku, Kochi 783-8505,Japan
3 Department of Anatomy, School of Medical Science, Phayao University, Phayao 56000, Thailand
4 Program in Biotechnology, Faculty of Science, Maejo University, Chiang Mai 50290, Thailand
5 Department of Agricultural Science, Faculty of Agriculture, Natural Resources and Environment, Naresuan University,Phitsanulok 65000, Thailand
6 Department of Paleontology and Evolution, State Museum of Natural History Karlsruhe, Erbprinzenstrasse 13,Karlsruhe 76133, Germany
7 Division of Cell Biology, Department of Preclinical Sciences, Faculty of Medicine, Thammasat University, Rangsit Campus, Pathumthani 12120, Thailand
Abstract This study was performed to explore the genetic diversity and genetic structure of red-spotted tokay geckos(Gekko gecko) from 23 different geographical areas in Thailand, Lao PDR and Cambodia. The mitochondrial tRNAGln/tRNA-Met/partial NADH dehydrogenase subunit 2 from 166 specimens was amplified and sequenced. A total of 54 different haplotypes were found. Highly significant genetic differences occurred between populations from different localities. The haplotype network revealed six major haplogroups (G1 to G6) belonging to different clades (clade AE). Clade D and clade E were newly observed in this study. Haplogroup G4 (clade D) was a sympatric population with haplogroup G1 (clade B). The populations from northern Thailand were divided into two distinct haplogroups separated by mountain range. Genetic structure and genetic differentiation of the tokay in Southeast Asia was related to the geographical region sampled, spatial distance and natural barriers. Our results indicate that red-spotted tokay geckos from mainland Southeast Asia are cryptically diverse. Morphological comparisons, in addition to an intensive genetic investigation covering the whole species range, are needed to clarify the systematic and population structure of this species group.
Keywords Genetic diversity, Gene flow, Natural barrier, Phylogenetic tree, Haplotype network
1. Introduction
The Indo-Burma biodiversity hotspot includes Cambodia,Lao PDR, Myanmar, Thailand, Vietnam and parts of southern China (Myers et al., 2000). This area contains a wide variety of endemic species, many of which are confined to limited areas where more or less natural habitat remains intact; many species are already endangered (Tordoff et al., 2012a) with the situation likely to deteriorate in the near future (Sodhi et al., 2004).As the natural environment in continental Southeast Asia is being rapidly converted, particularly via human population pressure leading to agricultural and urban expansion, the determination of species ranges is crucial for conservation efforts (Tordoff et al., 2012b). More than a quarter of the around 500 the reptiles found in this area are endemics, with numerous species being listed as endangered (Tordoff et al., 2012a). Unfortunately,the lizard fauna is relatively poorly known, with many new species being discovered but only 2 species listed as vulnerable by Tordoff et al. (2012a).
The tokay gecko (Gekko gecko) is used as a traditional medicine against AIDS, cancer, asthma, tuberculosis,diabetes, skin disease and impotence (Bauer, 2009). In Southeast Asia, an estimated 1.2 million dried specimens are exported annually from Java (Nijman et al., 2012),whereas up to 2-5 million are exported from Thailand(Laoong and Sribundit, 2006), with additional specimens coming from Lao PDR and Cambodia (Kongbuntad et al., 2016). These tokays are mostly exported to China and Malaysia for use as a traditional Chinese medicine(Caillabet, 2013).
Two different morphs of G. gecko occur, determined by their spotted colour and distribution, i.e. black-spotted and red-spotted tokays. The black-spotted tokay gecko is distributed across Guangxi and Yunnan Provinces through southern China, whereas the red-spotted morph is found in northeast India and Bangladesh, as well as throughout Southeast Asia (Qin et al., 2012). There are numerous reports on the biology, morphology and genetic differences between these two different morphs, e.g. body colour and spots (Zhang et al., 2006), advertisement calls(Yu et al., 2012), karyotype (Qin et al., 2012), RAPD patterns (Qin et al., 2005), nuclear DNA (Wang et al.,2013), mitochondrial DNA (Liu et al., 2000; Zhang et al., 2006; Qin et al., 2012; Wang et al., 2013) and microsatellite DNA (Peng et al., 2010). All previous reports suggest that G. gecko is probably subdivided into two subspecies or species according to the spot colour(Qin et al., 2012). The intraspecific variation of the blackspotted tokay in southern China has been intensively investigated (Liu et al., 2000; Qin et al., 2005; Peng et al., 2010), whereas information on the genetic structure of the red-spotted tokay populations from continental Southeast Asia is insufficient. Previous studies on the latter morph were performed using limited sample sizes and/or scattered localities and only cover part of the geographical range. Thus, unrecognized populations, taxa or genetic clades may have been missed (Wang et al.,2013). It is possible that cryptic species of tokay geckos existed and remain to be discovered in their endemic range. The number of species recorded from the gecko genus Cyrtodactylus has increased from 3 to ca. 24 species over the last two decades (Luu et al., 2011), while six new Gekko species were recently described from Vietnam (Phung and Ziegler, 2011). In addition, Grismer et al. (2014) identified 8 new Southeast Asian species in the gecko genus Cnemaspis.
In a previous study (Kongbuntad et al., 2016) using multilocus enzyme electrophoresis, specimens from 16 populations in Thailand, Cambodia and Lao PDR showed high levels of intra- and inter-population genetic variation, and sub-structuring into five genetic groups that corresponded to geographic distance and natural barriers.This suggests that G. gecko in Southeast Asia could be a species complex. Mitochondrial DNA sequences have also been widely used for investigating the phylogeography and genetic structure of many organisms including tokay geckos (Liu et al., 2000; Zhang et al.,2006; Qin et al., 2012; Wang et al., 2013). In order to obtain a better understanding of the systematic and taxonomic status of red-spotted G. gecko from mainland Southeast Asia, the genetic structure of populations from Thailand, Lao PDR and Cambodia were determined using mitochondrial partial tRNA-Gln/tRNA-Met/partial NADH dehydrogenase subunit 2 sequences.
2. Materials and Methods
2.1. Sample collectionA total of 166 tokay gecko samples from 23 different geographical localities were examined (Table 1 and Figure 1). All geckos were captured alive by villagers/sellers and sent to Nawa District, Sakon Nakhon Province, where they were bought prior to preparation for export to other counties,e.g. China, for using as traditional Chinese medicine. The visceral organs of all geckos were removed before their whole body was air or sun dried. We collected liver tissue which was then soaking in 80% alcohol and transported to the molecular laboratory at Walai Rukhavej Botanical Research Institute, Mahasarakham University where it was stored at room temperature until DNA extraction was performed.
2.2. Molecular analysesThe total genomic DNA of individual geckos was extracted from liver tissue using the E.Z.N.A?Tissue DNA kit (Omega bio-tek,USA) following the manufacturer's instructions. The mitochondrial tRNA-Gln/tRNA-Met/partial NADH dehydrogenase subunit 2 region was amplified using primers ND2F; 5'-GGT TAA AYY CCC CTY ATT TCC TA-3' and ND2R; 5'-GYG TCT GRR TTG CAR TCA GAR GA-3' (Wang et al., 2013). PCR comprised initial denaturation at 95 °C for 5 min, followed by 35 cycles with 30 s denaturation at 94 °C, 40 s for primer annealing at 50 °C, and 1 min for primer extension at 72 °C, with a final extension step at 72 °C for 8 min. All PCR products were gel-purified using an E.Z.N.A?Gel Purification Kit(Omega bio-tek, USA). The purified PCR products were cycle-sequenced using ABI BigDye v3.1 chemistry and run on an ABI Prism 377 automated sequencer (Applied Biosystems, USA).
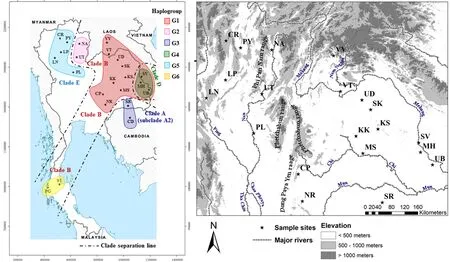
Figure 1 Map of sampling localities of tokay gecko in Southeast Asia and the haplogroups classified by haplotype network analysis. Each clade is separated by a dashed line. Clade A with subclade A2, and clade B were previously classified by Wang et al. (2013). Clade D and clade E were detected in the current study (see also Figure 4). Details of each isolate code are given in Table 1. The isolates from Savannakhet(SV), Mukdahan (MH), and Ubon Ratchathani (UB) provinces are separated into haplogroups G1 and G4 belonged to clade B and clade D,respectively. Natural barriers, namely rivers and mountain ranges are indicated.
2.3. Data analysesThe sequences were visually assembled and edited using the software program ABI sequence scanner v1.0. The 851 bp of partial tRNA-Gln/tRNA-Met/partial ND2 gene were readable and reliable.Multiple sequence alignment was performed using a BioEdit version 5.0.6. Nucleotide and haplotype diversity analyses were performed by DnaSP v5 software (Librado and Rozas, 2009). A minimum spanning haplotype network was constructed using the Network 4.6.1.0 program based on median-joining algorithm (Bandelt et al., 1999). Genetic differentiation (?ST), genetic structure(AMOVA), fixation indices and evolutionary neutrality were calculated using the program Arlequin 3.5 (Excoffier and Lischer, 2010), but sample sizes less than five were excluded from the analyses. The occurrence of a positive correlation between genetic difference and normalized geographic distance, the so called isolation-by-distance hypothesis, was examined by Mantel test (Mantel, 1967)based on a two-tailed 95% CI of a Pearson correlation.The mantel test was performed using the R program (R Core Team, 2013).
For phylogenetic tree analyses, all sequences were trimmed down to 752 bp of the partial ND2 sequence,equal to the length of other sequences retrieved from GenBank. The available sequences in GenBank of the red-spotted tokay from Cambodia, Vietnam, Myanmar,East Timor and China, the black-spotted tokay from China (Wang et al., 2013), as well as two references sequences from Gekko gecko mitochondrial genomes,i.e. HM370130 and AY282753 were included. Maximum likelihood (ML) tree analysis using the general time reversible with gamma distribution model (GTR+G model) was carried out using the MEGA7 program(Kumar et al., 2016) with nodal support estimated using 100 re-sampling. We used the program MrModeltest ver 2.2 (Nylander, 2008) to determine the most appropriate model for molecular evolution utilizable in Bayesian inference (BI) analysis using corrected Akaike information criterion (AIC). The model selected was GTR+G. BI analysis was performed in MrBayes software package 3.1.2 (Ronquist and Huelsenbeck, 2003) using the Markov chain Monte Carlo (MCMC) algorithm.The number of generations used in this analysis was 2,000,000, sampling every 100thgeneration. To calculate the posterior probabilities from BI analysis, the number of trees sampled was set at 10,000 after the standard deviation values of the run dipped below 0.01.
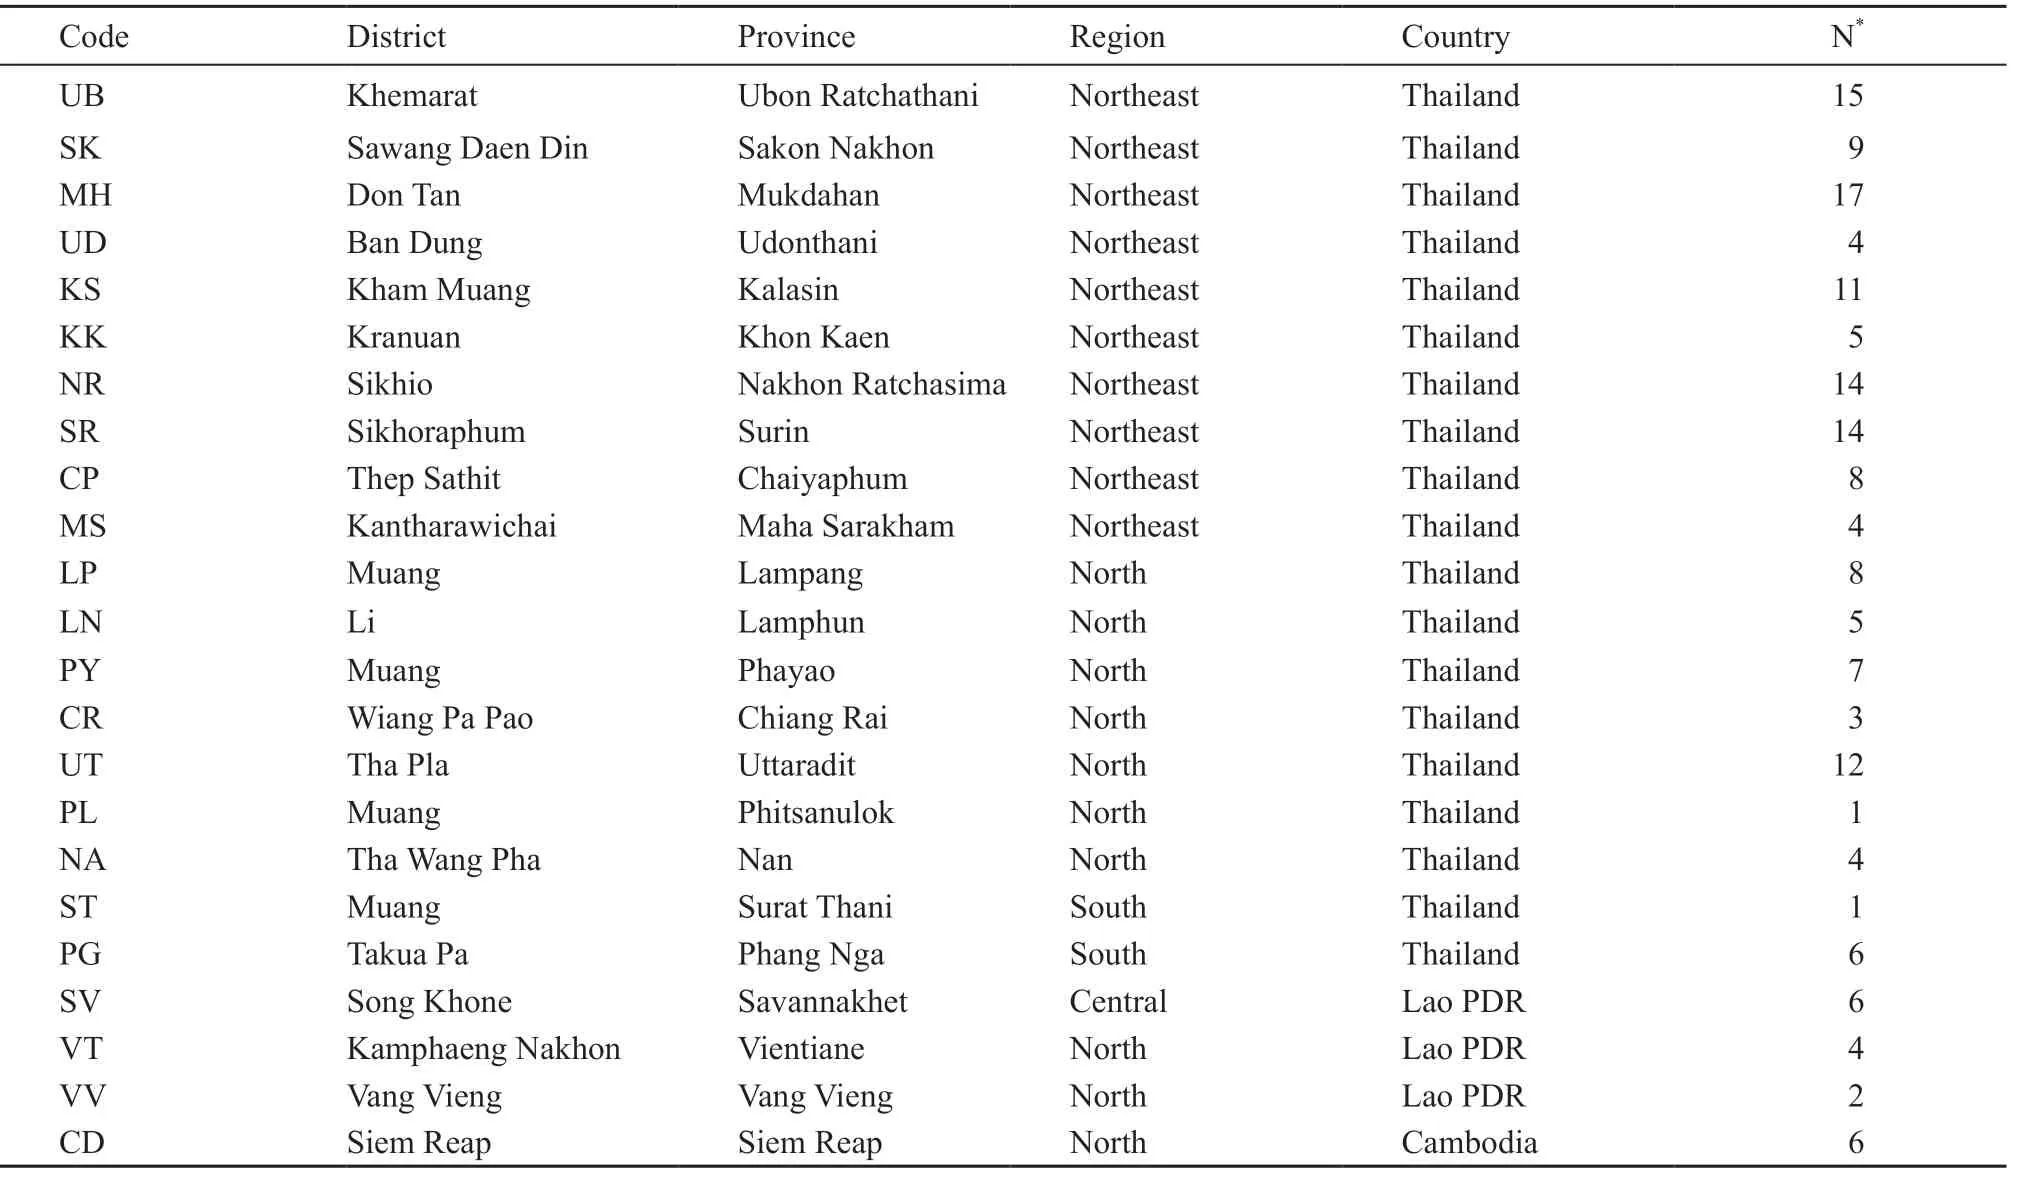
Table 1 Geographical areas of Red-spotted Tokay Gecko specimens collection.
3. Results
3.1. Haplotype diversity and network analysesThe 851 nucleotides of the partial tRNA-Gln/tRNA-Met/partial ND2 gene of 166 specimens was sequenced and deposited in GenBank under accession numbers MK117079-MK117244. We found 224 variable sites, including 31 singleton variable sites and 193 parsimony informative sites. Based on these variable sites, 54 haplotypes were generated and classified into six genetically distinct haplogroups (G1 to G6)according to mutational steps (ms) greater than 10 as demonstrated by haplotype network analysis (Figure 2). The most common haplotypes found in haplogroups
G1 to G6 were haplotypes (H) H3, H33, H9, H1, H15,and H12, respectively. Haplogroup G1 contained 25 haplotypes of 87 specimens from northeastern Thailand(except specimens from Surin province) and Lao PDR. Haplogroup G2 contained five haplotypes of 16 specimens from Nan and Uttaradit provinces, northern Thailand. Haplogroup G3 contained five haplotypes of 20 specimens from Surin province, northeastern Thailand and Siem Reap, Cambodia. Haplogroup G4 is a sympatric population with G1 and contained seven haplotypes of 13 specimens from Mukdahan and Ubon Ratchathani provinces, northeastern Thailand and Savannakhet province, Lao PDR. Haplogroup G5 contained nine haplotypes of 23 specimens from northern Thailand.Haplogroup G6 contained two haplotypes of seven specimens from southern Thailand (Figures 1 and 2).
3.2. Genetic differentiation and genetic structure analysesGenetic differentiation (?ST), calculated between the six distinct genetic haplogroups G1-G6, ranged between 0.173-0.508 and showed highly significant differences (P < 0.0001) for all pairwise comparisons(Table 2). In addition, comparing the 15 populations from different localities also revealed highly significant genetic differences (Table S1). The population genetic structure was determined by AMOVA. We found significant genetic sub-structuring (FCT= 0.196, P value < 0.0001) between the six genetically distinct haplogroups, as demonstrated by the haplotype network and ML tree. In addition,comparison between populations within each haplogroup also showed significant genetic sub-structuring with FSC= 0.264 (P < 0.001), as well as significant genetic sub-structuring for all individuals, with FST= 0.408 (P< 0.001) (Table 3). A Mantel test revealed that genetic distance is significantly correlated to geographic distance with R-squared = 0.586 (P value < 0.0001) (Figure 3).
3.3. Phylogenetic analysesThe ML and BI phylogenetic analyses showed similar topologies. According to a previous report by Wang et al. (2013), the three clades,clade A with two subclades (subclade A1 and A2),clade B, and clade C have been classified. The new two clades, clade D and clade E were detected in our current study (Figures 1 and 4). Haplotype network analysis revealed six haplogroups (G1-G6) of red-spotted tokay from mainland Southeast Asia (Figure 2). Of these,haplogroups G1, G2 and G6 were grouped into clade Btogether with three sequences of the black-spotted tokay from Sanwang (SW), Longfu (LF), and Longan (LA),Guangxi province, China, including two sequences of red-spotted tokay from Myaungmya district, Ayeyarwady division, Myanmar. Clade A, subclade A1 contained the three sequences of the black-spotted tokay from Tindeng (TD), Guigang (GG), and Daxin (DX), Guangxi province, China. None of our specimens was grouped in this subclade. Subclade A2 contained the sequences of red-spotted tokay from Lang Son (Vietnam), Viqueque(East Timor), Lubuk Sembilang (Malaysia), and Pursat(Cambodia). The haplogroup G3 from Surin (Thailand)and Siem Reap (Cambodia) was merged in subclade A2.Clade C contained a sequence from Shwesettaw Wildlife Sanctuary, Magway division, Myanmar but none of our specimens was grouped in this clade. Interestingly, we detected clade D and clade E, which was haplogroup G4 and G5, respectively (Figure 4).
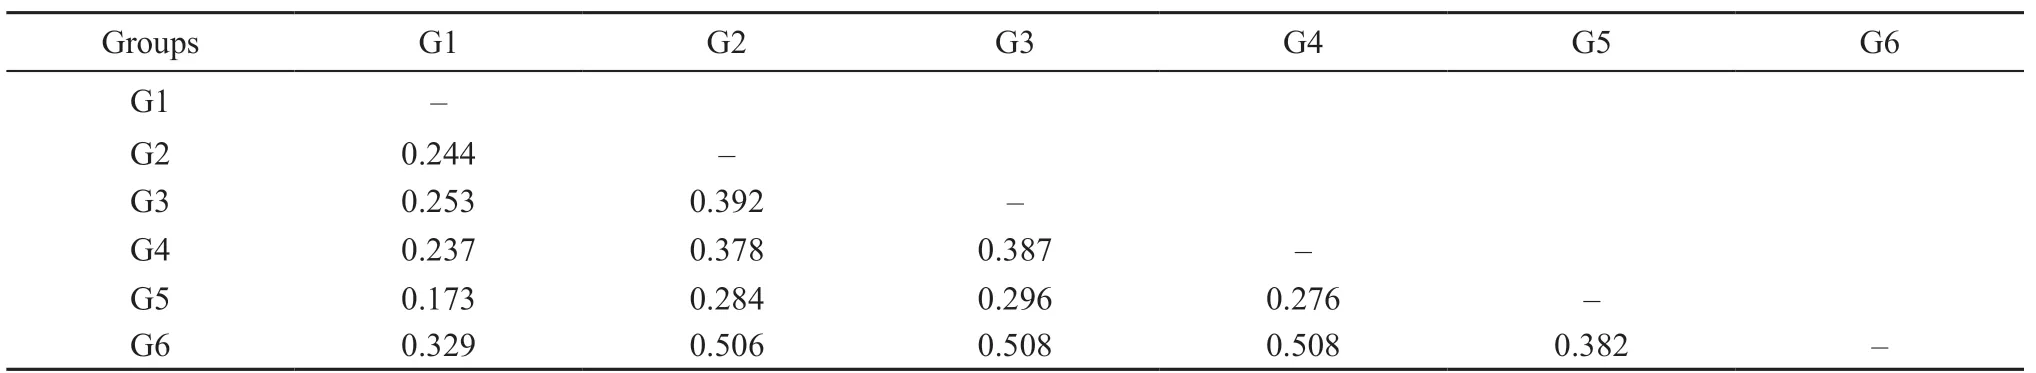
Table 2 Pairwise of genetic differentiation (?ST) among six haplogroups (G1-G6) of Red-spotted Tokay Gecko in Thailand.
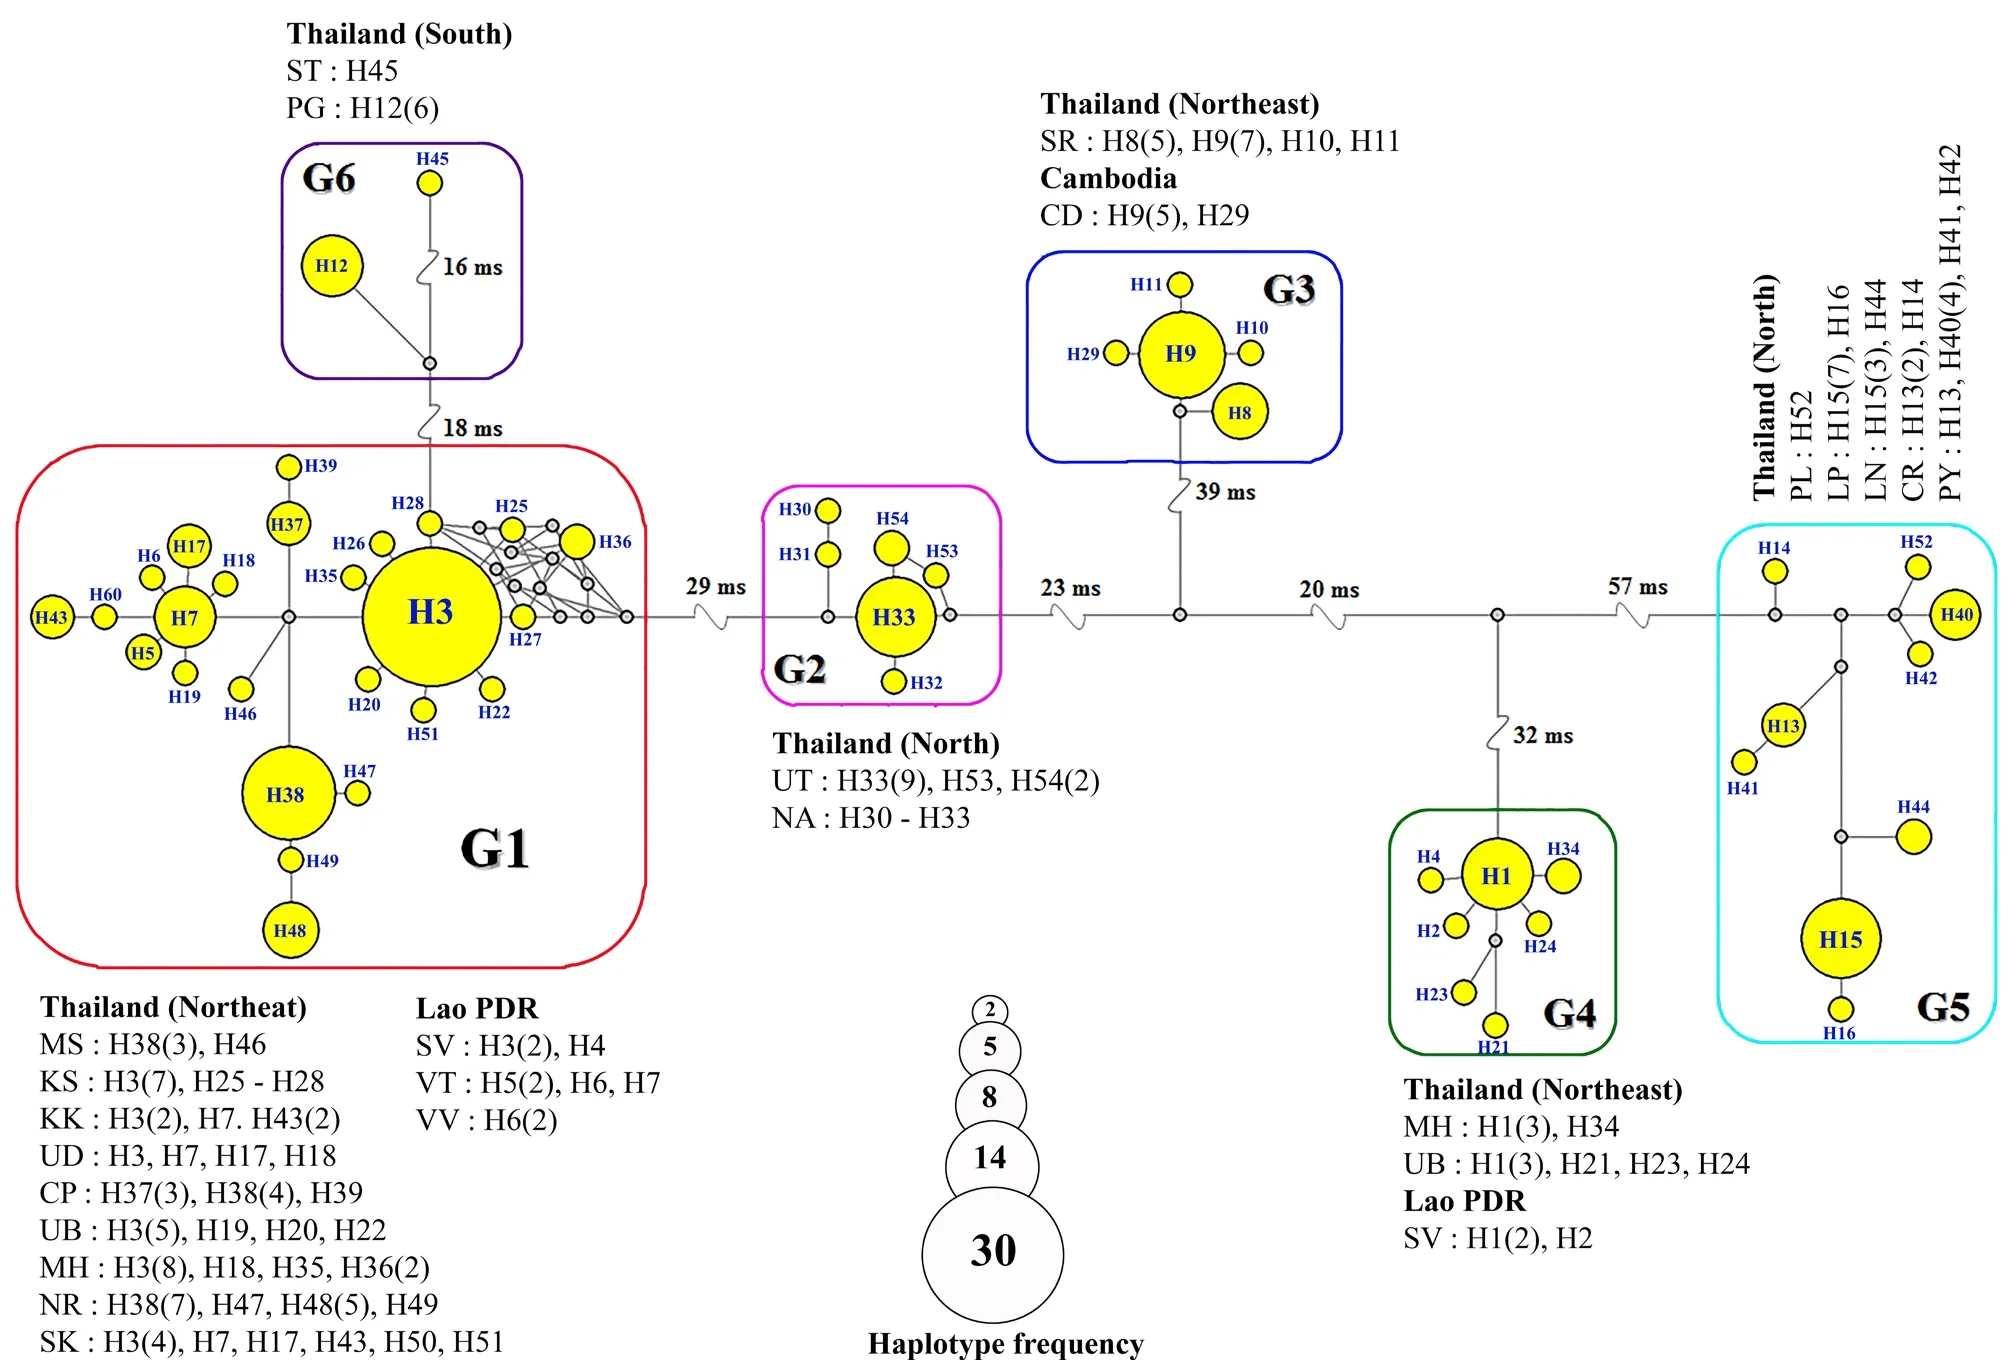
Figure 2 Minimum spanning haplotype network of the tokay gecko generated based on mitochondrial tRNA-Gln/tRNA-Met/NADH dehydrogenase subunit 2 sequences. The network of tokay geckos corresponds to their geographical localities and is separated into six haplogroups (G1-G6). The area of the circles represents the proportion of the sample number found in each haplotype.
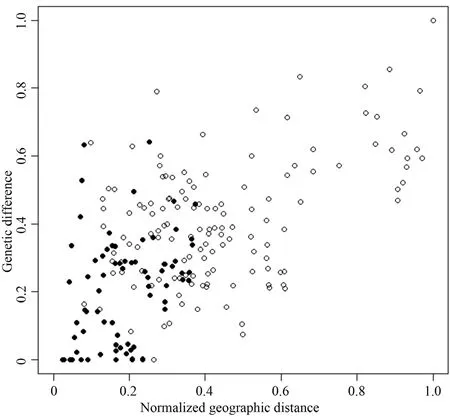
Figure 3 Scatter plot of normalized geographic distance versus genetic difference. Black points represent pairs within the same group and white points are otherwise. The significance of the correlation was R-squared = 0.586 and P-value < 0.0001 by Mantel test. This implies limited dispersal across space, i.e. isolation-bydistance, which results in spatially close populations being more genetically similar than distant populations.
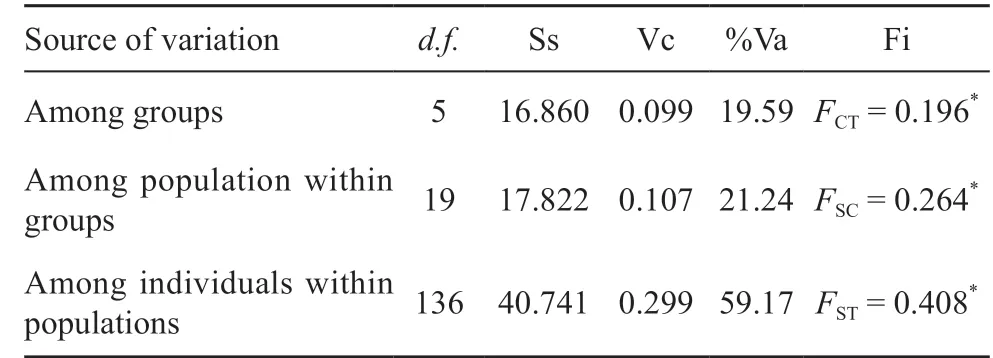
Table 3 Analysis of molecular variance (AMOVA) of Gekko gecko classified into six haplogroups (G1-G6).
4. Discussion
Our study provides the first data on a mitochondrial DNA sequence for exploring the genetic structure of red-spotted tokay geckos from different geographical areas in Thailand, Lao PDR and Cambodia. We found that intraspecific variation within these geckos from mainland Southeast Asia was relatively high, as indicated by differences in the 54 haplotypes that were observed.Population sub-structuring occurred between the 23 populations according to their geographical origins,spatial distance and natural barriers. Our finding was in concordance with that described in another morph, the black-spotted tokay gecko from southern China (Zhang et al., 2006). Here it was suggested that the high levels of genetic differentiation among populations was due to a lack of or a low level of gene flow, especially between spatially distant populations, or populations separated by natural barriers.
Our current findings also provide evidence that the populations from northern Thailand are separated from the populations from northeastern Thailand by the Phetchabun and Dong Paya Yen mountain ranges.
These mountain ranges have also been implicated as a natural barrier, limiting the gene flow of other animals,such as the rice-field frog (Hoplobatrachus rugulosus)(Pansook et al., 2012) and the blue-crested lizard, Calotes mystaceus (Saijuntha et al., 2017). Moreover, the northern populations were divided into two distinct haplogroups,G2 and G5, which were separated by the Phi Pan Nam mountain range. Haplogroup G5 occurs in the Nan River basin covering Nan, Prae, and Uttaradit provinces, where several species of amphibian and reptile show distinct genetic differences from other populations, e.g. common three frog (Polypedates leucomystax Buddhachat and Suwannapoom, 2018).
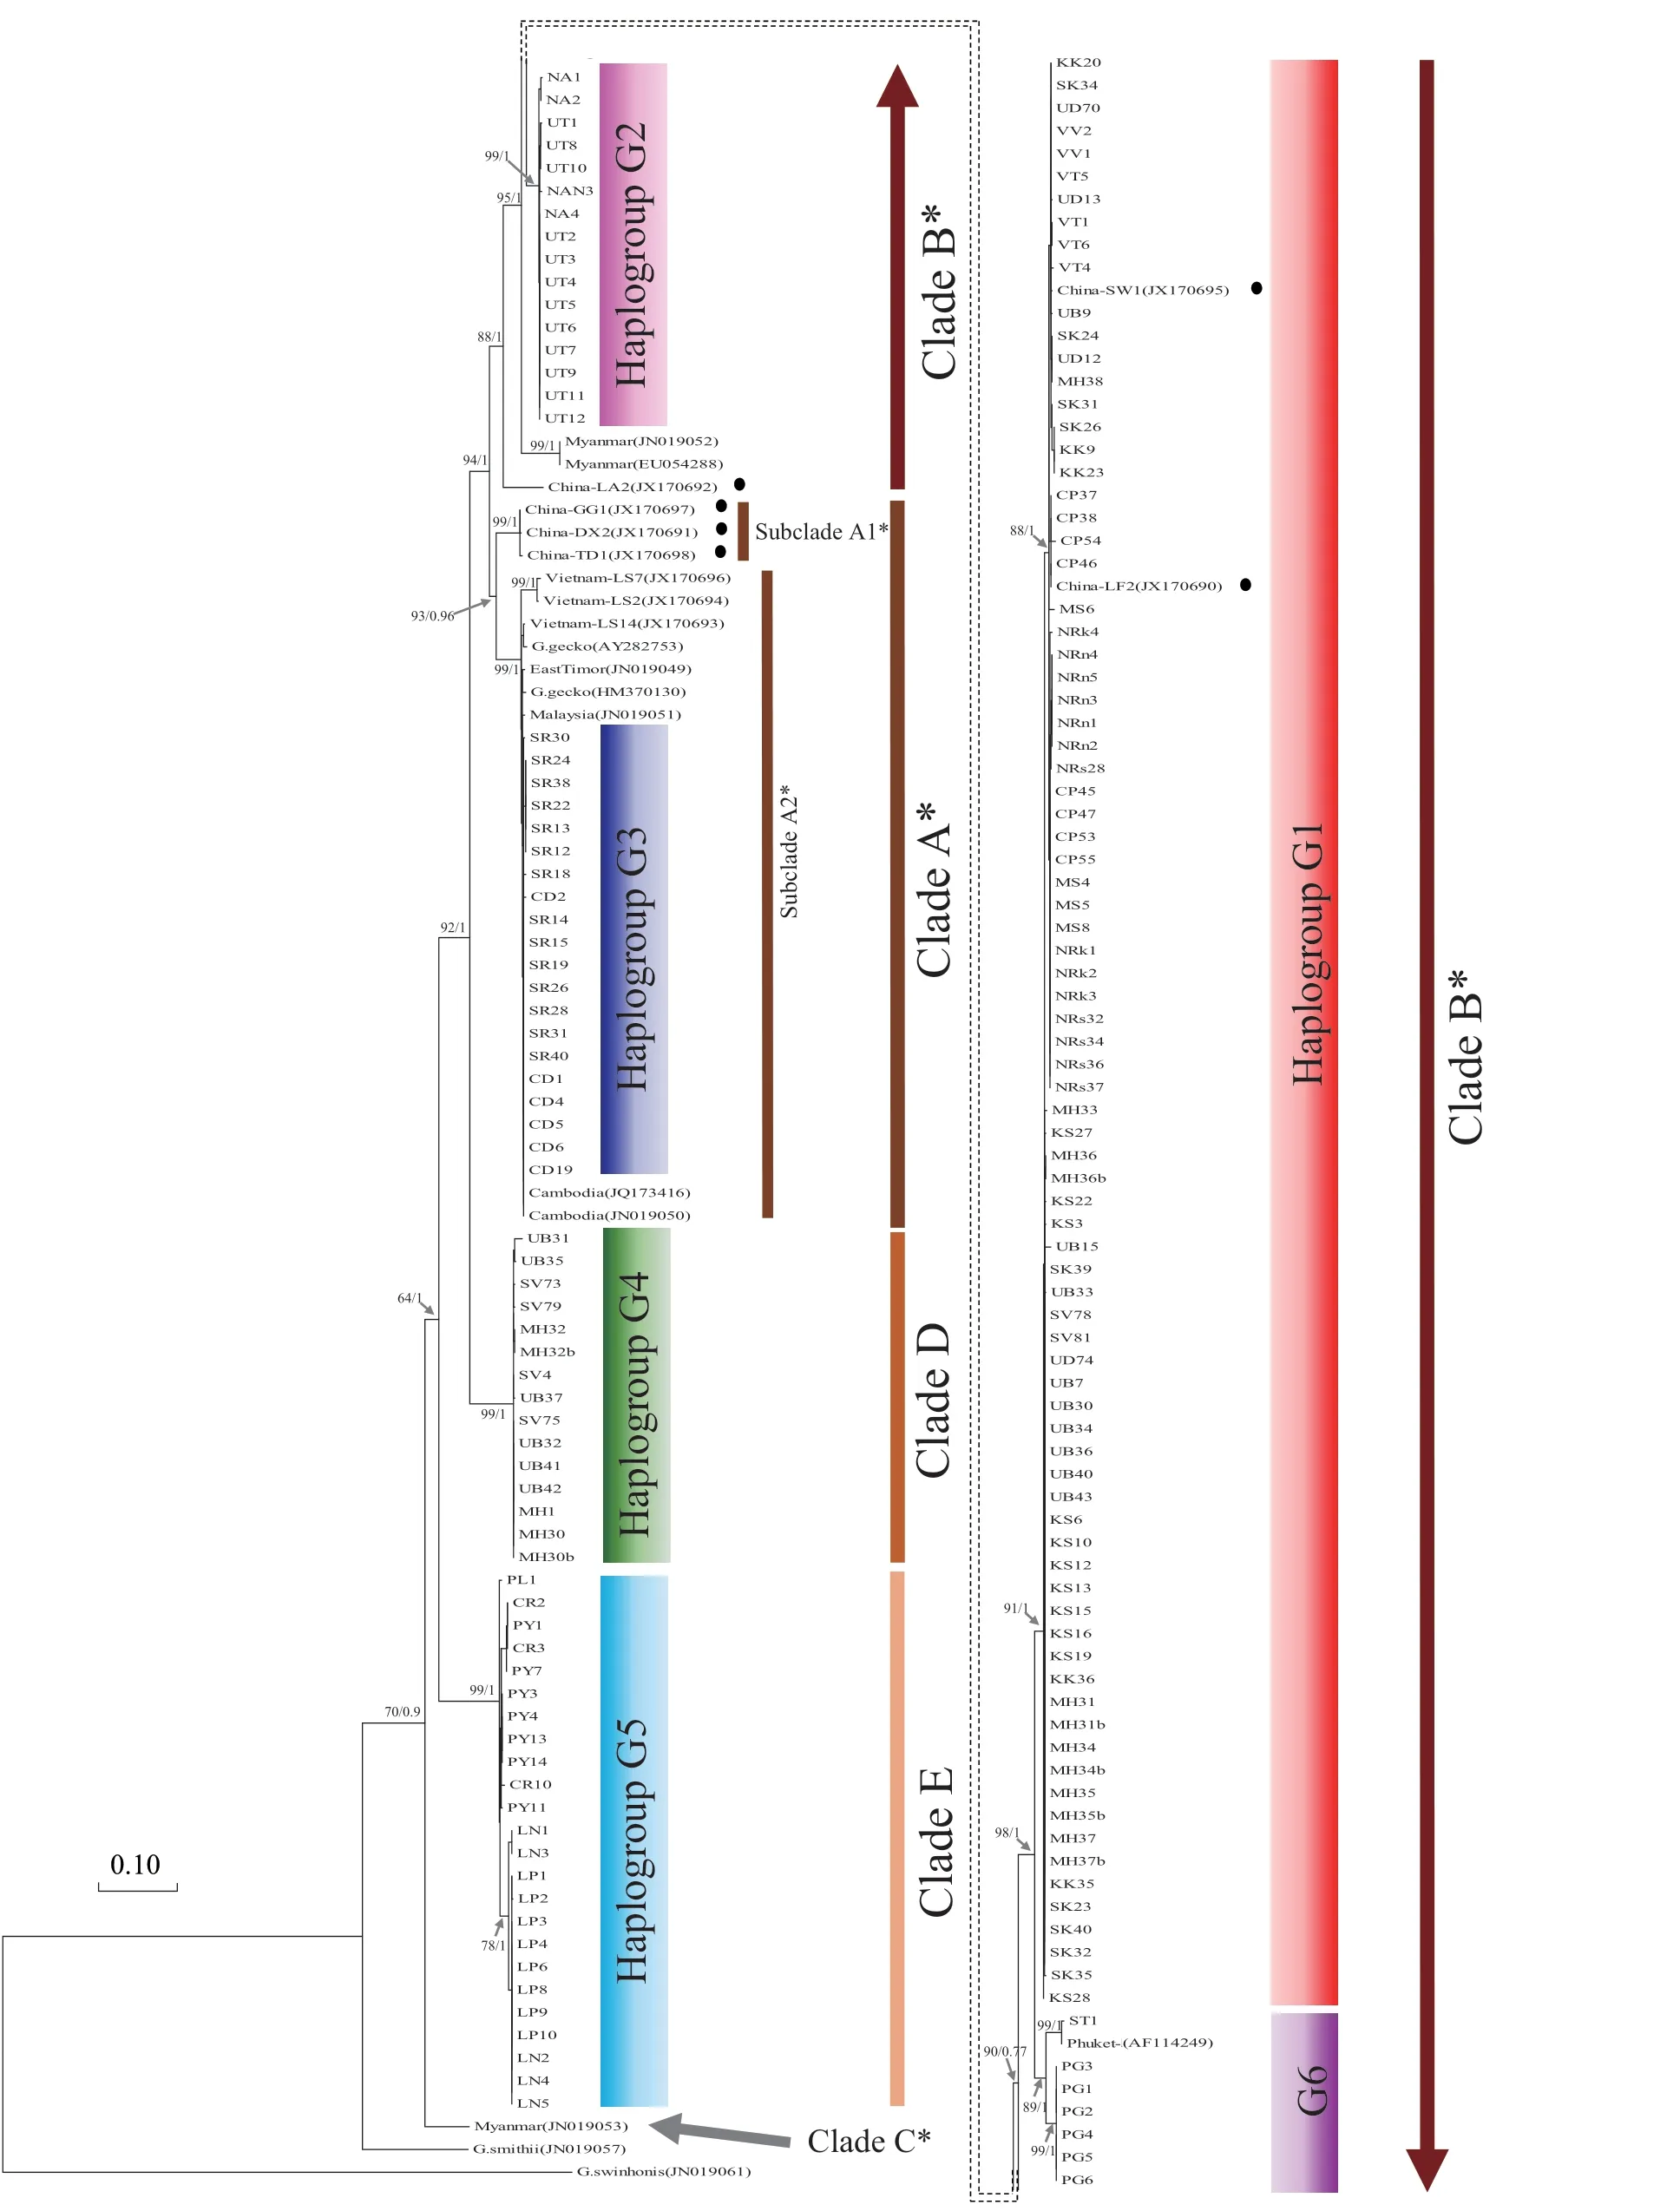
Figure 4 Maximum likelihood tree constructed based on 752 bp of ND2 sequence of 166 red-spotted tokay gecko from mainland Southeast Asia, classified into six genetic distinct haplogroups (G1-G6) corresponding to the haplotype network. Clade A with subclade A1 and A2,clade B, and clade C were previously classified by Wang et al. (2013) as indicated by “*”, whereas clade D and clade E were detected in the current study (see also Figure 1). Nodal supports are of bootstrap values obtained by ML and Bayesian posterior probability, respectively.The scale-bar indicates the expected number of substitutions per site. A sequence of the Peking gecko, Gekko swinhonis, was used as an outgroup.
The northeastern Thailand populations are grouped with the populations from Lao PDR, which are separated by Mekong River. In contrast, many previous reports show that the Mekong River acts as an important natural barrier to block gene flow, such as in the giant cricket Brachytrupes portentosus (Tantrawatpan et al., 2011),as well as for various amphibian species (Geissler et al.,2015). However, our findings suggest that the Mekong River might be less effective in limiting the migration/gene flow in tokay geckos. We still lack information on the genetic differentiation between populations from Thailand (Surin province) with populations from Cambodia, which are separated with a narrow section of the Dangrêk Mountains. However, another route of gene flow between neighbor countries and Thailand might occur by tokay trafficking for trade in Thailand(Caillabet, 2013, Kongbuntad et al., 2016). Interestingly,within haplogroup G6 with the isolates from southern Thailand the tokays from Surat Thani province showed high genetic differences between Phang Nga and Phuket provinces (mutational step = 16), which suggests that another haplogroup/cryptic group may be existed in these areas. Thus, more isolates of tokays from peninsular Thailand through Malaysia need to be explored.
The significant genetic differentiation among populations indicates that the red-spotted tokay populations in mainland Southeast Asia, and especially in Thailand, can be subdivided into at least six haplogroups and four clades based on their geographical origins related to the natural barriers. These findings are in concordance with our previous study using allozyme markers showing that genetic differences between tokay populations in Thailand and Lao PDR were related to geographical distance and natural barriers (Kongbuntad et al., 2016).However, we found that the populations from Mukdahan and Ubon Ratchathani in northeastern Thailand and Svannakhet in Lao PDR were divided into two different haplogroups, namely haplogroup G1 and G4. These two haplogroups also belong to different clades, with haplogroup G1 merging into clade B (Wang et al., 2013),and haplogroup G4 into a newly detected clade D. This indicates that they are probably from two genetically distinct, reproductively separated parents. If this is the case, it will be necessary to determine what ecological differences occur between the two taxa, i.e. what niches they occupy within their sympatric distribution as suggested by niche differences occurring between blackand red-spotted tokay in Indo-China (Zhang et al., 2014).
We found that the clade classification of Wang et al. (2013) was corroborated by our study. We found that very large specimens of red-spotted tokays from Southeast Asia were grouped into clade B with the blackspotted tokay from some localities in Guangxi, China.Thus, the relationships between the morphotypes need to be intensively explored. We also detected two novel clades from northeastern (clade D) and northern (clade E) Thailand. Thus, other novel clades of red-spotted tokay may be discovered in other localities in Southeast Asia. Our findings of pronounced phylogeographic differentiation, and the concomitant loss of genetic information if further population loss occurs, apply to a wide range of endangered, rare, endemic reptile species in mainland Southeast Asia. In the future, to verify the geographical origin of specimens, it will be necessary to develop population-specific markers. In addition,morphological and biological data should be collected to determine the taxonomic status of the various groups:whether they are races, subspecies or whether the tokay gecko represents a species complex.
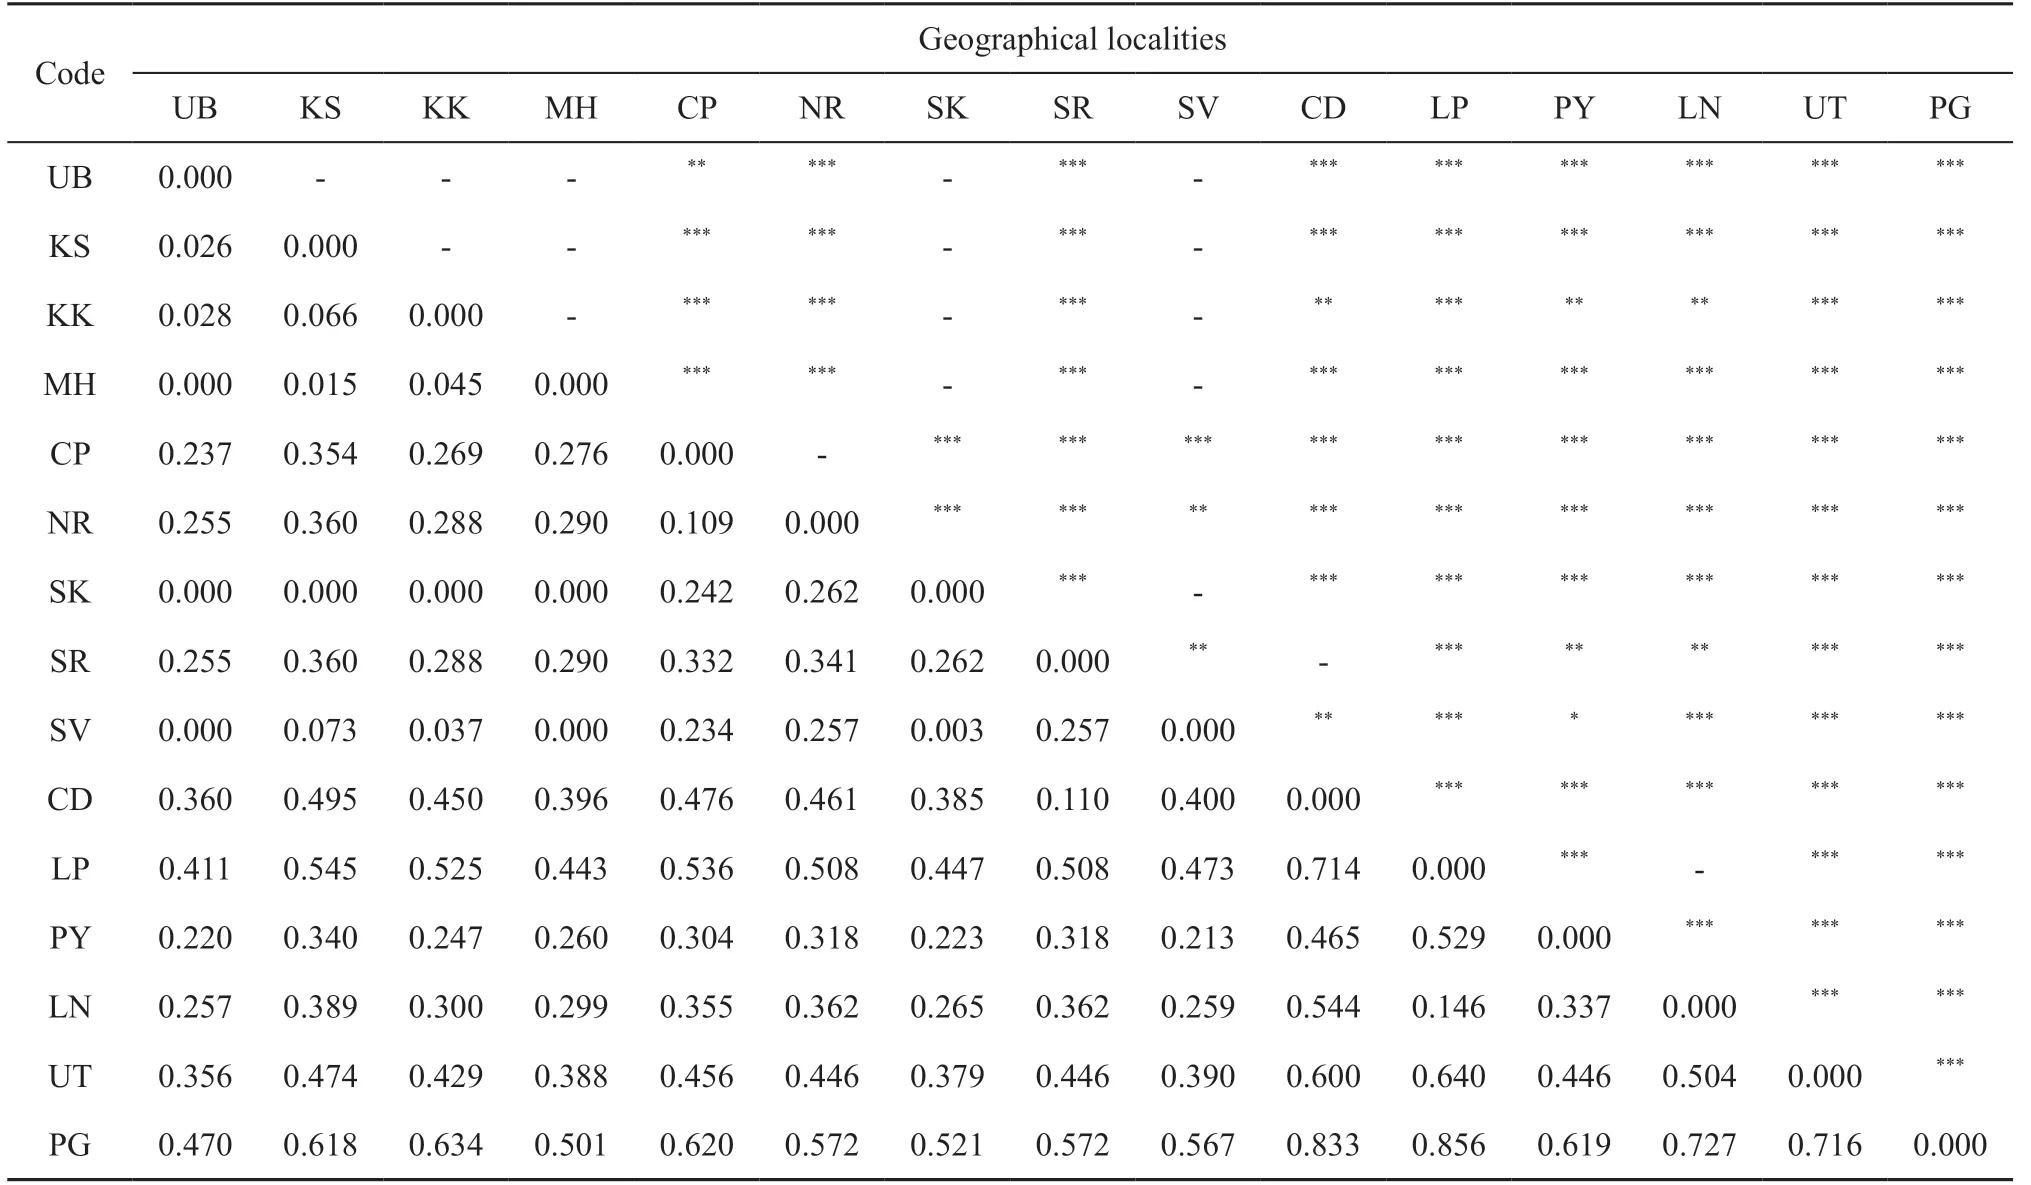
AppendixTable S1 Genetic differentiation (?ST) indicated in lower triangle and P-value indicated in upper triangle among tokay populations with sample size ≥ 5, from different localities in mainland Southeast Asia.
AcknowledgementsThis research was supported by fast tract funding, fiscal year 2016 of Mahasarakham University to S. Sedlak.
 Asian Herpetological Research2019年2期
- Asian Herpetological Research的其它文章
- Comparative Skin Histology of Frogs Reveals High-elevation Adaptation of the Tibetan Nanorana parkeri
- Molecular Phylogeny and Evolution of Two Rhacophorus Species Endemic to Mainland Japan
- On the Generic Taxonomy of Opisthotropis balteata (Cope, 1895)(Squamata: Colubridae: Natricinae): Taxonomic Revision of Two Natricine Genera
- Evaluating the Importance of Environmental Variables on Spatial Distribution of Caspian cobra Naja oxiana (Eichwald,1831) in Iran
- Appendix 1 Specimens examined.