
Evaluating the Importance of Environmental Variables on Spatial Distribution of Caspian cobra Naja oxiana (Eichwald,1831) in Iran
2019-06-26 03:03ElmiraKAZEMIMohammadKABOLIRasoulKHOSRAVIandNematollahKHORASANI
Asian Herpetological Research 2019年2期
Elmira KAZEMI, Mohammad KABOLI, Rasoul KHOSRAVI and Nematollah KHORASANI
1 Department of Environment, Faculty of Natural Recources and Environment, Science and Research Branch, Islamic Azad University, Tehran, Iran
2 Department of Environmental Science, Faculty of Natural Resources, University of Tehran, Karaj, Iran
3 Department of Natural Resources and Environmental Engineering, School of Agriculture, Shiraz University, Shiraz,Iran
Abstract Over recent years, the population of Caspian cobra Naja oxiana has declined in its distribution range in Iran due to habitat destruction and overhunting. Consequently, their small and isolated populations in fragmented landscapes are facing genetic and demographic threats. Evaluating the spatial distribution pattern of Naja oxiana, identifying core habitat patches and improving landscape connectivity among the patches have a significant role in the long-term survival of the species. This study predicts the spatial distribution map of the Caspian cobra considering the factors affecting the predictive power of the distribution models, including sampling bias in presence points, correct selection of background locations, and input model parameters. The sampling bias in presence points was removed using spatial filtering. Several models were run using 19 environmental variables that eventually led to the selection of the effective habitat variables and best MaxEnt distribution model. We also used an ensemble model (EM) of habitat suitability methods to predict the potential habitats of the species. Topographical roughness, shrublands, average annual precipitation, and sparse rangeland with a density of ≤ 20% had the most effect on the spatial distribution of Caspian cobra. The evaluation of models confirmed that the EM has more predictive performance than MaxEnt in predicting the distribution of Naja oxiana.
Keywords Naja oxiana, MaxEnt, habitat suitability, landscape connectivity, distribution modelling
1. Introduction
Habitat fragmentation is one of the most important threats to biodiversity that leads to reduction in habitat area, increase in habitat isolation and reduction in ecological function of the remaining habitat patches(Ripple et al., 2014). In a fragmented landscape, the survival of small and isolated populations is affected by individual's movement between patches (Wiens, 2001;Niebuhr et al., 2015). Therefore, the conservation and monitoring of threatened and vulnerable species in a fragmented landscape requires maintaining the landscape connectivity between habitat patches. To improve landscape connectivity, managers need to have sufficient information about spatial patterns of species distribution and the effects of anthropogenic and landscape factors on the species distribution and dispersal. Landscape connectivity modelling can be improved by learning about how species interact between biotic and abiotic elements, as well as the spatial distribution of species in landscape (Bellamy et al., 2013). In addition, managing and preserving of landscape connectivity is affected by precise and reliable data of species distribution.
Ecological niche models (ENMs) or spatial distribution models (SDMs; Warren and Seifert, 2011) are efficient tools in determining the factors affecting species presence, disease spread, and predicting the probable changes in the distribution range of invasive and nonnative species (Khanum et al., 2013). SDMs provide an accurate prediction of habitat suitability. Since accurate absence data for many species are scarce, in recent years,much progress has been made to improve and develop SDMs based on only presence data. Maximum Entropy(MaxEnt) have been introduced a powerful tool for mapping species distribution with a limited number of present data (Elith et al., 2006; Phillips et al., 2009).
Although ENMs have high performance in ecological studies and conservation biology, these algorithms may suffer from over fitting and biased prediction. Such challenges may occur in modelling due to 1) sampling bias in presence data, 2) inaccurate selection of absence data,
3) lack of sufficient data to assess the model accuracy, and
4) false choice of spatial scale of environmental variables(Veloz, 2009; Barve et al., 2011). The application of ENMs using the biased presence points, especially data resulting from opportunistic observations can lead to a model over-fitting and reduce the accuracy and reliability of the model (Phillips et al., 2009; Boria et al., 2014). In addition to sampling bias in presence points, uncertainty in the predictions from these algorithms should be considered. Each algorithm has inherent limitations and errors that result in different levels of efficiency and accuracy in modelling (Araújo and New, 2007; Araújo et al., 2011). Developing ensemble models (EMs) is a valuable method to overcome the uncertainties of each model and increase the overall accuracy of predictions.In EMs, a landscape is suitable only if all algorithms in the EM classify it that way (Zarco-Gonzalez et al., 2013).Over the past few years, EMs have been used in many studies focusing on predicting species distribution and assessing landscape connectivity (Araújo et al., 2011;Kujala et al., 2011; Rodriguez-Soto et al., 2011; Abade et al., 2014).
The Caspian cobra Naja oxiana, also called the Central Asian cobra, is a member of the family Elapidae. It has the easternmost distribution for the Naja subgenus in the Palaearctic region. Naja oxiana lives in dry, rocky habitats and areas with sparse vegetation. Its distribution ranges from northern and north-eastern Iran to southern Turkmenistan, southern Uzbekistan, western Tajikistan,northern Pakistan, north and east Afghanistan, and northern India (Wüster and Thorpe, 1989; Wüster, 1990;Wallach et al., 2009). In recent years, the population of the species has dramatically declined in northern habitats due to illegal overhunting (Darvish and Rastegar-Pouyani, 2012). Moreover, declining population size as a result of habitat degradation and excessive exploitation for medical purposes such as experiments on anti-cancer compounds (Wüster et al., 2007; Pook et al., 2009)can put this species at risk of extinction. Also, drying up of some rivers and springs due to reduced rainfall has influenced the distribution of the species. Habitat fragmentation increases patch isolation and reduces the ecological suitability of the remnant patches and landscape connectivity between them. These changes may negatively affect gene flow among subpopulations in a metapopulation pattern (Young, 2000). Hence, assessing species distribution, identifying core habitat patches, as well as managing and preserving landscape connectivity among patches plays an important role in directing future research, conservation management programs and ensuring the long-term survival of the species.
The present study was designed with the aim of using the EMs together with considering the factors affecting the performance of the models. We had three objectives:1) to determine the effects of environmental and human factors on the distribution pattern of Caspian Cobra; 2) to determine habitat patches and the landscape connectivity among patches; 3) to evaluate how the input parameters of predictive distribution models (i.e. regularization parameter, the number of input variables, and feature types) affect model performance.
2. Material and Methods
2.1. The study area and occurrence pointsThe present study was conducted in the distribution range of Caspian cobra in the north and northeast of Iran within the geographical range of 38°-30° N to 62°-51° E (480 000 km2; Figure 1). A total of 47 presence points were obtained from 2015-2016, based on direct observations and genetic sampling. The coordinates of all the presence points were recorded using a hand-held multi-channel Global Positioning System (GPS). The average annual precipitation of the area varies between 50 and 960 mm.The most important factors causing habitat fragmentation and landscape changes in the landscape include road network development, expansion of agricultural activities,and land use changes.
2.2. Eco-geographical variablesNineteen ecological and ecogeographical variables were selected based on the literature review and were categorized in five main classes including topography, bioclimatic variables(Hijmans et al., 2005), anthropogenic, vegetation, and land cover (Table 1). Because of the high correlation (r >0.70) between bioclimatic variables, only five bioclimatic variables were used in this study including average annual temperature (Bio1), temperature seasonality(Bio4), maximum temperature of the warmest month(Bio5), average annual precipitation (Bio12), and precipitation seasonality (Bio15). Focal mean elevation,topographic roughness, and slope were extracted using a digital elevation map (Shuttle Radar Topography Mission (SRTM elevation model; http://srtm.csi.cgiar.org) and the Surface Gradient and Geomorphometric
Modelling toolbox (Evans et al., 2014) in the ArcGIS.In addition, Normalized Difference Vegetation Index(NDVI) was obtained in 2012 at 250-m resolution using MODIS Vegetation Indices (MOD13) C5 User's Guide(Solano et al., 2010). NDVI layers were summarized into several important components using principal component analysis (PCA). Only the first two components were used in distribution model. We obtained a digital map of vegetation cover from the Iranian Forests, Rangeland and Watershed Management Organization (FRWMO, 2009)and reclassified it into five land cover (LULC) types,including sparse rangeland with a density of ≤ 20%,mixture of grassland-scrubland with a density of ≥ 25%,shrublands, forests, and barelands. To provide continuity for the extracted categories, the proportional extent of each land cover type was calculated within a 2 km × 2 km grid network by running the ArcMap Neighbourhood statistic tool. Furthermore, the density of agricultural land,rural areas, geographical distance to residential areas, and the distance to the roads were also used as anthropogenic variables. All nineteen layers were resampled to a 1-km2cell size.
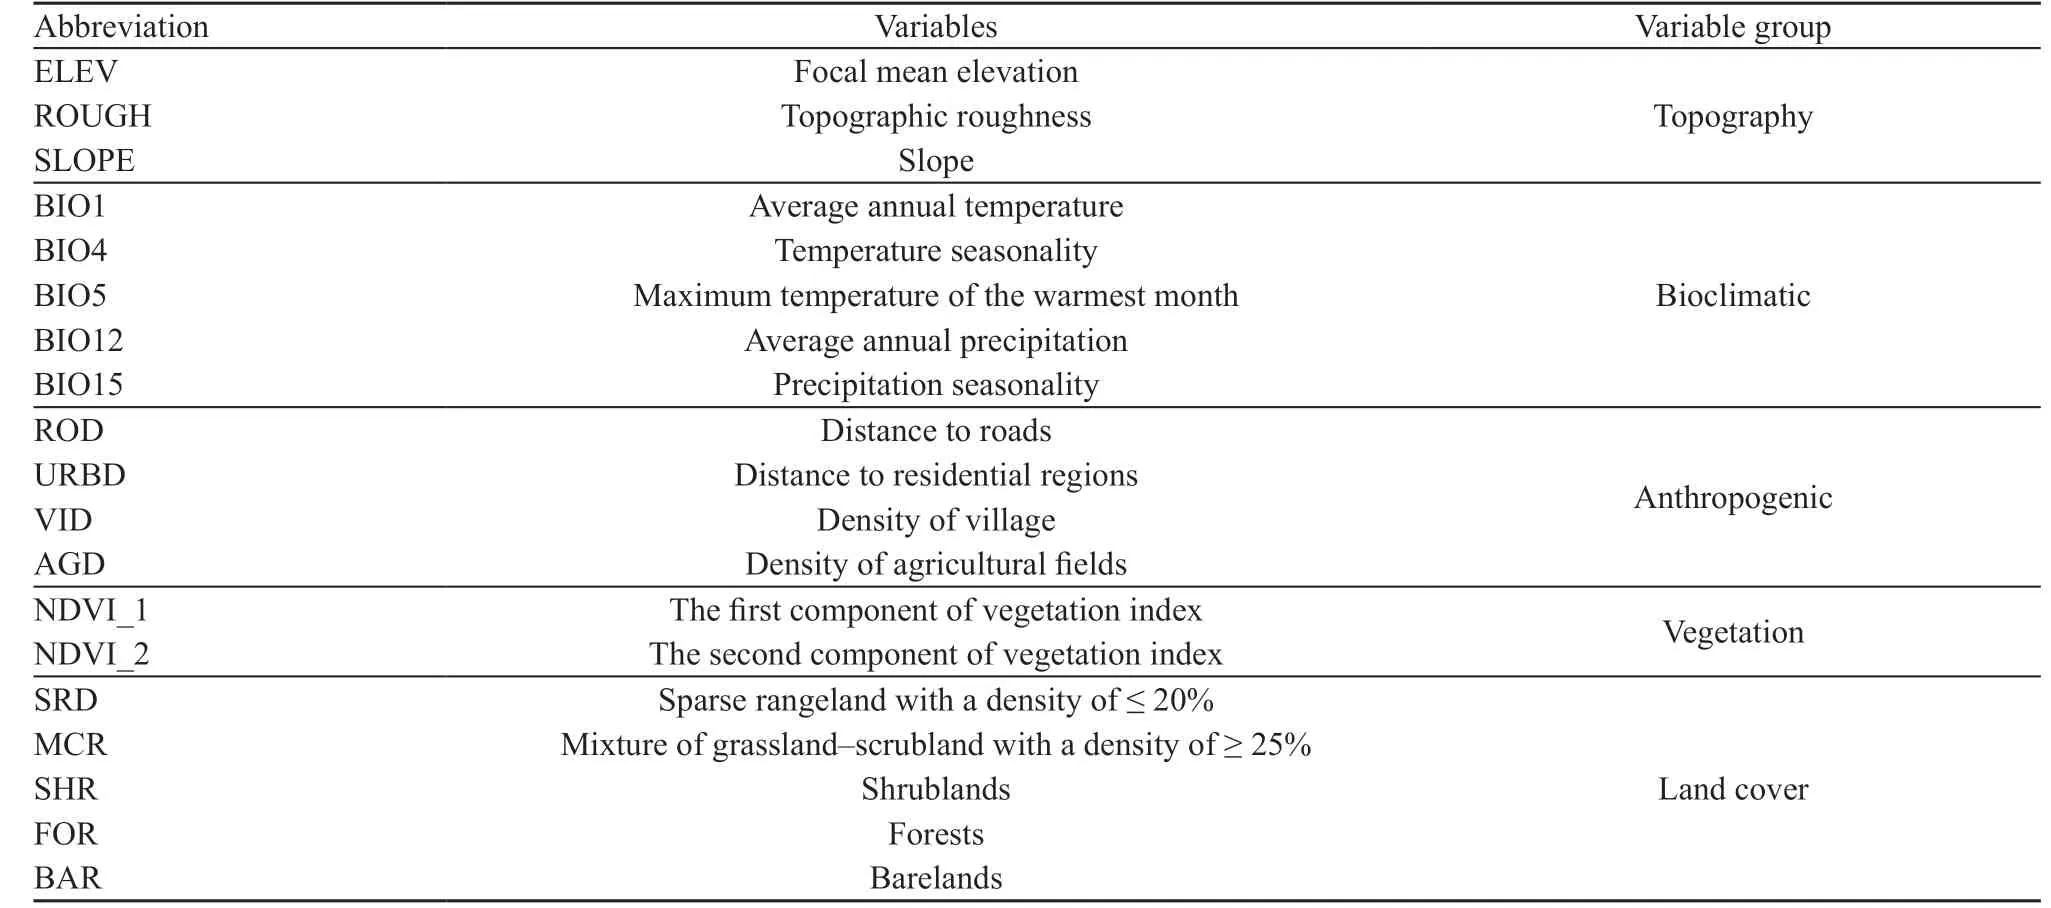
Table 1 Categories of 19 environmental variables used in the distribution modelling of Caspian cobra.
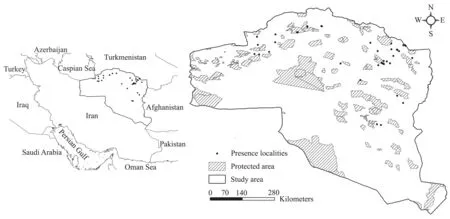
Figure 1 The study area in the northeast and east part of Iran. The dashed polygons and black dots show protected areas (PAs) and presence points, respectively.
2.3. Modelling
2.3.1. Evaluation of sampling bias in presence points and selection of background points Given that many of the presence points were recorded during fieldwork or based on available reports of collected specimens, we eliminated the probable bias in the presence points using spatial filtering method in ArcGIS (SDMtoolbox; Brown,2014). The threshold of 500 meters was used as a spatial filter to remove spatial autocorrelation in occurrence points. We filtered presence points so that each point was at least 500-m away from other points, which resulted in 41 unique occurrence points with decreased spatial autocorrelation. Selecting appropriate background localities is another challenge that should be considered in ENMs. In this study, to avoid selecting background points from environmental conditions outside the range of the presence points, a buffer with a radius of 30 kilometres was considered around the presence points and only the background points that were located within this distance around presence points were used in the modelling.
2.3.2. Optimization of distribution model's parameters and variables used for modelling The R package“MaxEntVariableSelection” was used to eliminate correlation between the environmental predictors and to prevent multicollinearity and achieve an accurate goodness of fit value (Jueterbock et al., 2016). The software provides the possibility to optimize the model's parameters, including the regularization parameter, the number of input variables in the model, and feature types.In this study, the regularization index was evaluated between two to four with an interval of 0.5. This software also applies a repeat process to remove variables with a significance level less than the defined threshold value,which will depend on the species of interest, as well as a defined threshold value for correlation between variables.The threshold of significance and threshold of correlation were selected as 2.0 and 0.7, respectively. Moreover, we used AUC-testand AICc to determine the most important variables affecting the species distribution, the best regularization parameter, and feature types.
2.3.3. MaxEnt distribution model and ensemble modelling After selecting the most important variables affecting the distribution of Caspian cobra and optimizing the input parameters, the final distribution model was implemented using the MaxEnt algorithm in the R package “dismo” (Hijmans et al., 2016). The MaxEnt model was performed using the optimized regularization parameter, 4000 background localities, five runs, and 5000 replications. The evaluation of the MaxEnt model was done using AUC-test. Afterwards, distribution maps were converted to presence and absence map using the threshold “Maximum Training Sensitivity and Specificity(MTSS)” (Liu et al., 2013). In order to evaluate the predictive power of the model and increase the performance of the distribution model, in addition to the MaxEnt model, a second predictive species distribution model was conducted using ensemble modelling approach(Araújo and New, 2007). Hence, three algorithms were used to produce the EM: Maximum Entropy (MaxEnt),generalized linear model (GLM), and generalized boosted model (GBM). All three models were implemented using the important variables identified in the previous steps.The EM was calculated using the weighted average of the values of AUC obtained from each model and the method proposed by Marmion et al. (2009) and Rodriguez-Soto et al. (2011). All the three algorithms MaxEnt, GLM and GBM, as well as the EM were run in the R package“biomod2”. All models were calibrated by using the 75%of occurrence points as training data, and tested on the remaining 25% to assess model performance (see Ahmadi et al., 2017; Khosravi et al., 2018 for details). Evaluating the performance of all models and the EM was carrying out using the AUC index (Deleo, 1993).
3. Results
After correcting the sampling bias in the presence points,41 points were used in the MaxEnt model. The AUC-testand AICc, showed that the optimal distribution model would be achieved with fewer variables. The number of environmental variables included in the final distribution model based on the AUC-testand AICc index was reduced to eight and five, respectively (Table 2). Moreover, the regularization parameter for the optimal model was three based on the AICc and two based on the AUC-test(Figure 2). The best species habitat suitability prediction was produced using average annual precipitation (BIO12),topographic roughness (ROUGH), sparse rangeland with a density of ≤ 20%, (SRD), density of agricultural fields(AGD), density of shrublands (SHR), distance to roads(ROD), distance to residential regions (URBD), and the first component of vegetation index (NDVI_1).
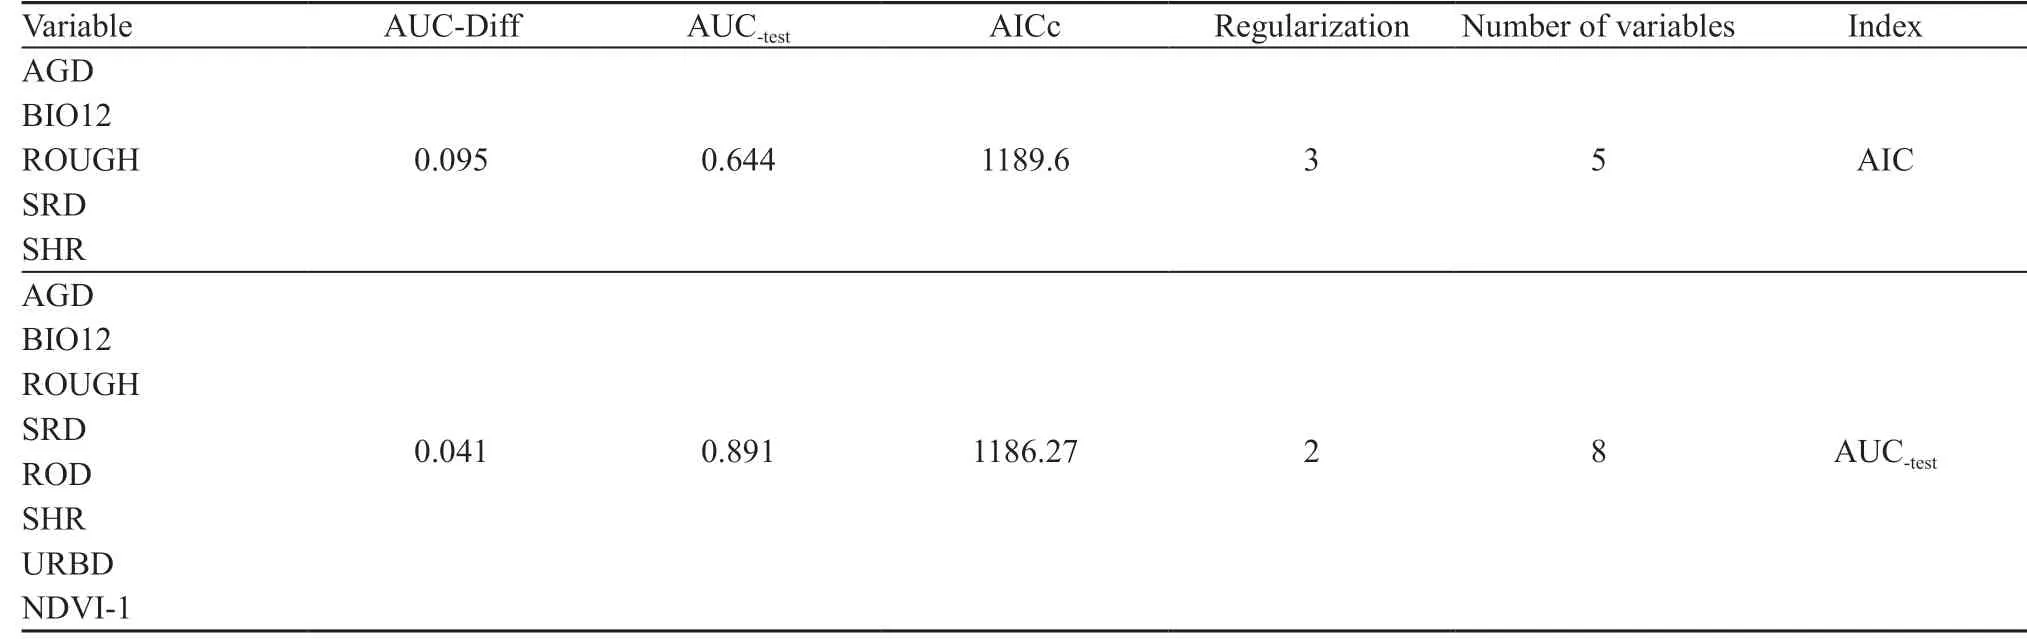
Table 2 The best distribution model of Caspian cobra based on AICc and AUC-test in the MaxEnt model.
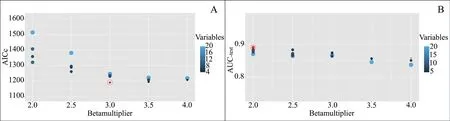
Figure 2 The best regularization parameter in Caspian cobra predictive distribution model based on the AICc and AUC-test. The red circle shows the optimal regularization parameter.
Evaluation of the final MaxEnt model using selected environmental variables based on the AUC-testshowed that MaxEnt had high predictive power in predicting the distribution and suitable habitats of Caspian cobra (AUC= 0.840). In Figure 3, the distribution map of suitable habitats is shown based on the suitability threshold.
The highly suitable habitats for the species were more widely distributed in the north-eastern parts of Iran, which illustrates the importance of this region in protecting Naja oxiana across the study area. The most effective variables in the final MaxEnt model were identified in order of importance as 1) the density of shrublands, 2) sparse rangeland with a density of ≤ 20% and 3) topographical roughness. The suitable habitats map obtained from the MaxEnt model identified approximately 12% (58 610 km2) of the study area as suitable habitat for Naja oxiana.
The response curves (Figure 4) of the most influential variables in the species distribution showed that density of shrublands provides highly suitable habitat for this species until a certain threshold (i.e. 0.2) after which it causes a negative effect on habitat suitability. Likewise, increasing the topographical roughness initially increases the habitat suitability, but after reaching a threshold, the habitat suitability decreases. The average annual precipitation has a strong, almost linear positive correlation with habitat suitability. The effect of sparse rangeland with a density of ≤ 20% indicated that it is equal probability of presence from 0 to approx. 0.75 and then steep decrease.
3.1. Evaluation of Naja oxiana distribution using EM
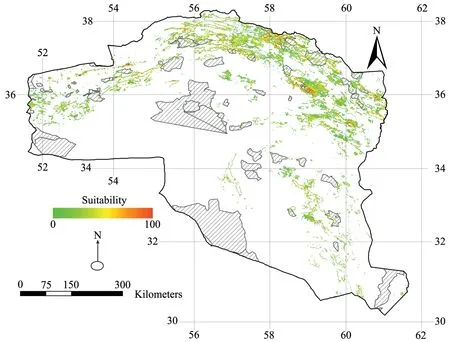
Figure 3 Potential distribution of Naja oxiana in northeastern Iran using MaxEnt. Predictions based on Average annual precipitation: BIO12(mm); Topographic roughness: ROUGH; Shrublands: SHR (%); Sparse rangeland with a density of ≤ 20%: SRD. The predicted probability of presence, with values ranging from 0 to 100, is depicted by colours.
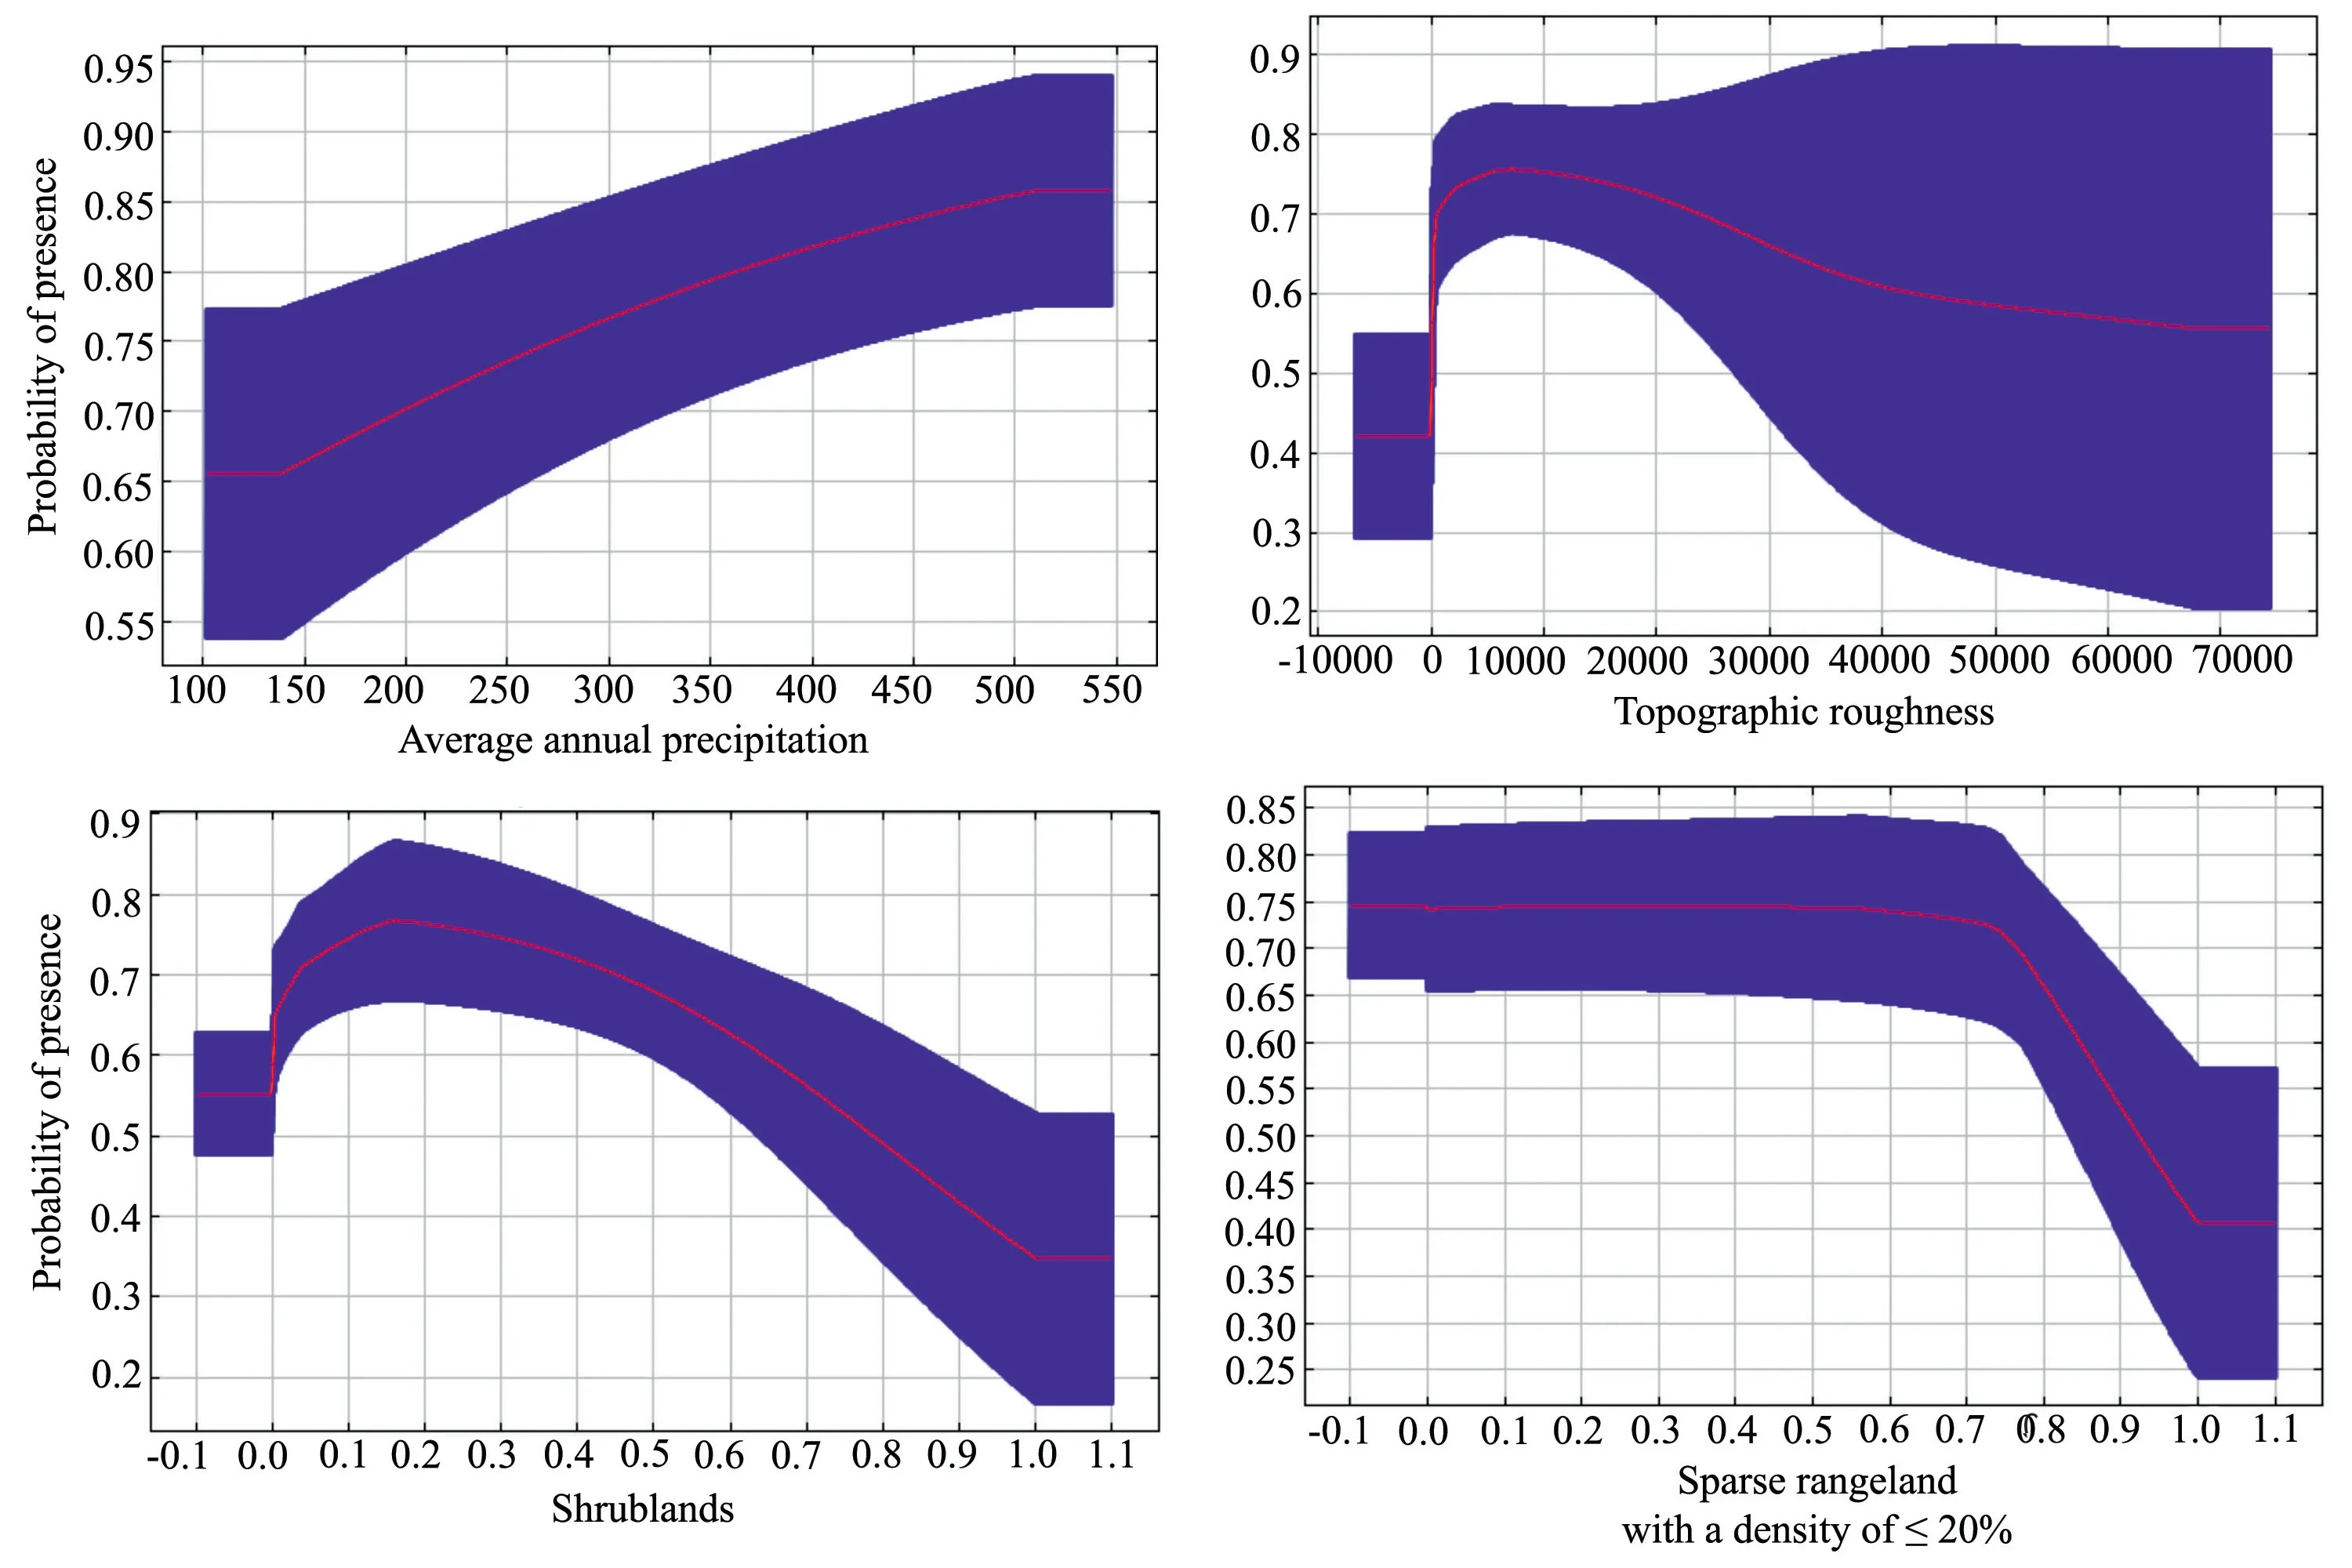
Figure 4 Response curves of the most influential predictors for distribution of Naja oxiana modelling with MaxEnt. (Average annual precipitation: BIO12 (mm); Topographic roughness: ROUGH; Shrublands: SHR (%); Sparse rangeland with a density of ≤ 20%: SRD).These curves show the mean response of the cross-validated models with 10 replicate runs (red) and the mean ± one standard deviation (blue).
Figure 5 shows the distribution map of Caspian cobra obtained from the EM (MaxEnt, GLM, and GBM). The EM identified nearly 8% (42 574 km2) of the study area as suitable habitat for Naja oxiana, which had a relatively high overlap with the suitable habitats map derived from the MaxEnt. As was expected, the suitable habitat area in the EM was smaller than the MaxEnt model since the EM was an ensemble of three distribution algorithms and it produced a smaller suitable habitat area as compared to MaxEnt, which was based on only one algorithm. The evaluation of the three algorithms separately showed that all these three models have an efficient performance in predicting the distribution of Naja oxiana (MaxEntAUC=0.832; GLMAUC= 0.785; GBMAUC= 0.988). The GLM model was similar to MaxEnt, while the GBM showed better performance in predicting the distribution of the species. Additionally, the AUC index was calculated as 0.932 for the EM, which illustrates it had more power compared to the MaxEnt and GLM models. Assessing the most effective variables in the EM showed that four variables including sparse rangeland with a density of ≤20%, the first component of vegetation index, average annual precipitation and topographic roughness have the most impact on species habitat suitability.
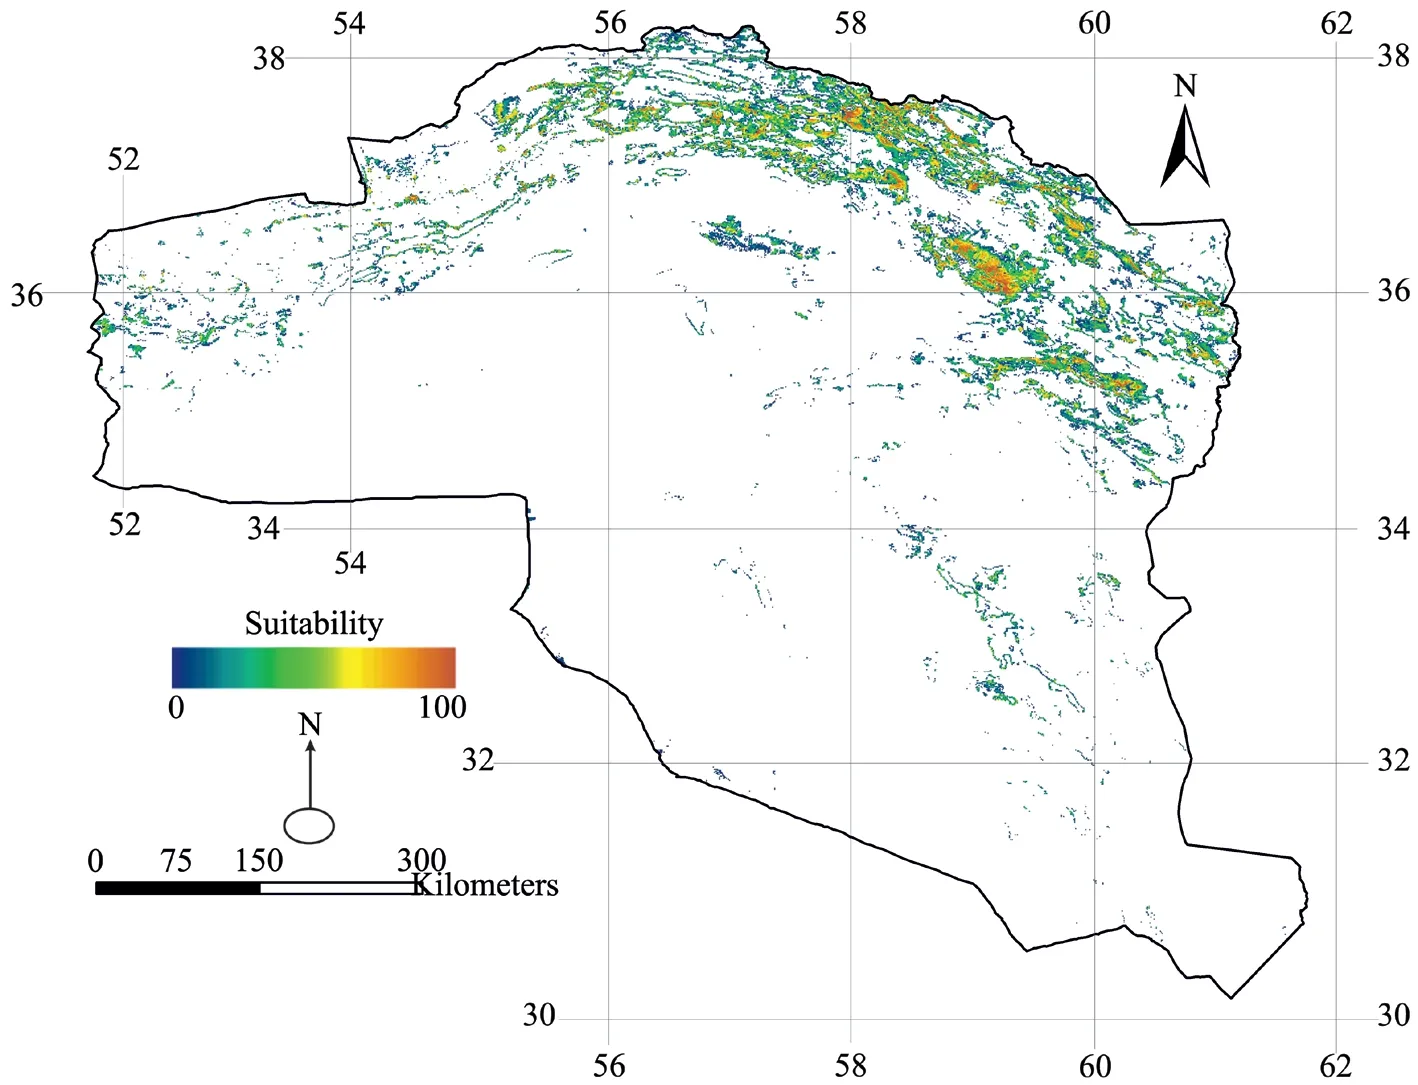
Figure 5 Potential distribution of Naja oxiana in northeastern Iran using ensemble modelling. Predictions based on Average annual precipitation: BIO12 (mm); Topographic roughness: ROUGH; Shrublands: SHR (%); Sparse rangeland with a density of ≤ 20%: SRD. The predicted probability of presence, with values ranging from 0 to 100, is depicted by colours.
4. Discussion and Conclusion
In this study, the habitat suitability and potential distribution map of Caspian cobra was predicted using the most effective variables based on an optimized modelling framework. In addition to considering environmental variables, other factors to increase model accuracy were addressed, including sampling bias in presence points,correct selection of backgrounds, and optimizing the input parameters. These factors have a significant role in the precision and accuracy of the ENMs. Considering that in most studies of species distribution modelling, recorded presence points are used from opportunistic observations,the bias in collecting and recording these points can affect the performance of prediction models (Fourcade et al.,2014). In this study, the spatial filtering method was used to eliminate the sampling bias. Studies show that reducing the number of presence points using spatial filtering is an effective technique in reducing sampling bias in presence points (Kramer-Schadt et al., 2013; Boria et al., 2014;Kittle et al., 2018). Furthermore, the results showed that the use of this method improves the final distribution model and reduces the probability of overfitting. Although the method used in this study to reduce the effect of sampling bias in presence points decreased the number of presence points, this method increased the reliability of the results.
Ensemble models provide a better representation of species distribution patterns for many species. Until now, EMs have been used in many studies, including to assess the effects of climate changes, identify protected areas, and predict species distribution (Kujala et al.,2011; Carroll et al., 2010; Khosravi et al., 2018). Our results showed that the EM (AUC = 0.932) compared to MaxEnt model (AUC = 0.840) had more efficiency and power in predicting the distribution of Caspian Cobra in north and north-eastern Iran. This result was consistent with previous studies (Marmion et al., 2009;Rodriguez-Soto et al., 2011; Abade et al., 2014). In an EM, areas are predicted as suitable habitat only if all algorithms in the ensemble model have reached the same and stable prediction. Therefore, EMs in most cases show more efficiency compared to individual models(Zarco-Gonzalez et al., 2013). Generally, the area of suitable habitats predicted by EMs is smaller than the area predicted by a single algorithm (e.g. MaxEnt).Consequently, using EM in the case of dealing with data obtained from opportunistic observation (for example reptiles) is an effective approach to predict species distribution.
Field studies show that Naja oxiana inhabits mostly stony and rocky habitats covered by bushes in dry and semi-arid climate and altitudes up to 3 000 meters (WCH Clinical Toxinology Resource, 2012). Therefore, it can be expected that annual precipitation and elevation play an important role in distribution and habitat suitability of Naja oxiana. The results of this study confirm the importance of these variables in the distribution and habitat suitability of the species. Based on the output of the EM, the behaviour pattern of the species to changes in habitat variables shows clearly a close correlation of the habitat selection behaviour of the species with its habitat elements. The study of the importance of variables based on EM determined that sparse rangeland with a density of ≤ 20%, average annual precipitation and topographic roughness have the greatest impact on the distribution of this species. Human variables in comparison with environmental variables showed less impact on species distribution.
The probability of distribution and habitat suitability of the species increased with increasing distance to roads. However, the observations of Naja oxiana in areas affected by human activities imply the extension of its range beyond its preferred habitats (Kularatne and Senanayake, 2014). Since Caspian cobra prefers habitats with little human disturbance, constructing major roads with high vehicle traffic would decrease the habitat suitability for the species. Roads are often associated with high levels of noise pollution, which can have a negative effect on vibration-sensitive species, in addition to the high percentage of road killings of wildlife, including Caspian cobra and other reptile species. In addition,new roads can facilitate urban expansion, which leads to an increase in human interactions with habitats and consequently habitat destruction and fragmentation. For this reason, it is not surprising that such habitats have lower suitability. As for topographical roughness, changes in the response curve showed that an increase in surface roughness initially increased the habitat suitability until its effect became negligible, after which additional increases reduced suitability. A high increase in habitat suitability of Caspian cobra with a slight increase of surface roughness can be attributed to the dependence of the species on stony and rocky areas. Both elevation and surface roughness are variables with a high impact on the distribution of many species (Hof et al., 2012; Ahmadi et al., 2017, Khosravi et al., 2018). The combination of changes of two variables, sparse rangeland with a density of ≤ 20% and roughness, shows that stony-rocky areas with a low degree of roughness and sparse vegetation are one of the most suitable habitat types for Caspian cobra. Although Caspian cobra avoids areas with dense vegetation, regions with sparse vegetation or low plant density in rocky areas play an important role providing shelter and hiding patches for the species.
The results of the study can play a remarkable role in identifying Caspian cobra habitat patches as well as creating connectivity between identified patches.Evaluating the ecological and habitat needs of the species is the first step of conservation management plans, and thus plays an essential role in the species survival. In the other words, creating landscape connectivity between identified patches and protecting these habitat patches are important in facilitating the gene flow between the remaining populations and thereby decreasing the genetic threats caused by population's disconnection.
AcknowledgementsOur sincere thanks go to Raheleh DEZFOULIAN and Ben GOTTESMAN for their great assistance on editing and constructive criticism of the manuscript. This study was permitted by the Iranian Department of Environment under permits No. 94/43027 and 94/17701.
 Asian Herpetological Research2019年2期
- Asian Herpetological Research的其它文章
- Genetic Structure of the Red-spotted Tokay Gecko, Gekko gecko(Linnaeus, 1758) (Squamata: Gekkonidae) from Mainland Southeast Asia
- Comparative Skin Histology of Frogs Reveals High-elevation Adaptation of the Tibetan Nanorana parkeri
- Molecular Phylogeny and Evolution of Two Rhacophorus Species Endemic to Mainland Japan
- On the Generic Taxonomy of Opisthotropis balteata (Cope, 1895)(Squamata: Colubridae: Natricinae): Taxonomic Revision of Two Natricine Genera
- Appendix 1 Specimens examined.