
Selective and sensitive fluorescence imaging reveals microenvironment-dependent behavior of NO modulators in the endothelial system
2020-11-09 01:06YingDongXioRongLiJiLiYiZngXinLi
Ying Dong,Xio-Rong Li,Ji Li,d,Yi Zng,*,Xin Li,**
aCollege of Pharmaceutical Sciences,Zhejiang University,Hangzhou,310058,China
bState Key Laboratory of Drug Research,Shanghai Institute of Materia Medica,Chinese Academy of Sciences,Shanghai,201203,China
cUniversity of Chinese Academy of Sciences,Beijing,100049,China
dOpen Studio for Draggability Research of Marine Natural Products,Pilot National Laboratory for Marine Science and Technology(Qingdao),1 Wenhai Road,Aoshanwei,Jimo,Qingdao,266237,China
Keywords:
Nitric oxide modulator
Drug screen
Fluorescence imaging
Microenvironment
Endothelial cell
ABSTRACT
Nitric oxide(NO)is a second messenger playing crucial roles in the signaling of a variety of cellular functions.Due to its pathophysiological significance,various NO modulators have been developed to explore NO pathways and some have been used as therapies.These modulators are often used directly to observe pharmacological effects in cell lines,but their actual effect on intracellular NO level is seldom analyzed.Herein,facilitated by a selective and sensitive fluorescence probe,we observed that some NO modulators displayed unexpected behaviors with both NO scavenger carboxy-PTIO and endothelial nitric oxide synthase(eNOS)inhibitor N(ω)-nitro-L-arginine methyl ester(L-NAME)failing to decrease intracellular free NO level in EA.hy926 cells while NO donor diethylamine-NONOate(DEA·NONOate)and eNOS activator calcimycin(A23187)failing to increase free NO level in human umbilical vein endothelial cell line(HUV-EC-C),although the reagents were confirmed to work normally in the primary human umbilical vein endothelial cells(primary HUVECs)and RAW 264.7 macrophage cells.Further research suggested that these unusual behaviors might be attributed to the cellular microenvironments including both the NO synthase(NOS)level and the endogenous glutathione(GSH)level.Genetically manipulating eNOS level in both cells restores the expected response,while decreasing GSH level restores the ability of DEA·NONOate to increase NO level in HUV-EC-C.These results reveal that the cellular microenvironment has a profound impact on pharmacological effect.Our study suggests GSH as a reservoir for NO in live cells and highlights the value of chemical probes as valuable tools to reveal microenvironmentdependent pharmacological effects.
1.Introduction
NO is an intriguing molecule that is endogenously generated from L-arginine by the enzymatic activity of three nitric oxide synthase(NOS)isoforms[1,2],i.e.,endothelial NOS(eNOS)[3],neuronal NOS(nNOS)[4],and inducible NOS(iNOS)[5].It is a second messenger that is essential in the regulation of many physiological processes[6,7],especially cardiovascular function[8].In the endothelial system,NO contributes to vessel homeostasis by regulating vascular tone and inhibiting platelet aggregation[9].Reduced NO signaling is associated with several known risk factors for the most common cardiovascular diseases[10].Therefore,therapeutic modulation of NO signaling has been clinically applied in the treatment of cardiovascular diseases[11].Moreover,various commercially available modulators,including NO donors[12],NO scavengers[13],or NOS synthase activators or inhibitors[14],have been widely used to feed cells in order to interrogate the exact pathophysiological roles of NO signaling pathways.It should be noted that these modulators are usually directly used without quantifying their actual effects on intracellular NO levels,since the modulating effects(NO donors to release exogenous NO and NO scavengers to decrease endogenous NO)have been established by spectrophotometrical measurements in aqueous solution and by their biological activity on vascular tones.However,here we report our unexpected observations that do not directly follow this rule.Fluorescence imaging with a NO sensitive probe revealed that treatment of HUV-EC-C with either a NO donor(DEA·NONOate)or a NO scavenger(carboxy-PTIO)decreased the intracellular NO levels,and similar results were observed when the cells were treated with either eNOS activator A23187 or eNOS inhibitor LNAME.In contrast,both DEA·NONOate and carboxy-PTIO increased intracellular NO levels in EA.hy926 cells,and so did A23187 and LNAME for the same experimental system.Further experiments indicate that the aberrant behavior of these NO modulators in these two cell lines is intracellular microenvironment-dependent,including both the eNOS level and GSH level.EA.hy926 cells have a much higher level of eNOS expression than HUV-EC-C but the latter cells have a higher GSH level.Genetically knocking down eNOS in EA.hy926 or over-expressing eNOS in HUV-EC-C restored the expected response for both L-NAME and A23187.However,decreasing intracellular GSH in HUV-EC-C cells made DEA·NONOate work well to increase NO levels.These interesting results suggest the possible synergistic effects between eNOS,NO and GSH,and the profound impact of intracellular microenvironments on pharmacological effects.
2.Materials and methods
2.1.Cell culture
RAW 264.7(ATCC?TIB-71?),EA.hy926(ATCC?CRL-2922?)and HUV-EC-C(ATCC?CRL-1730?)cells were cultured in DMEM(Gibco,12100061)growth medium supplemented with 10% FBS(Gibco,Australia),and the primary HUVEC(Promocell,C-12206)cells were cultured in EGM?-2 endothelial cell growth medium-2(Lonza,CC-3162)in a humidified atmosphere of 5% CO2and 95% air at 37°C and split when the cells reached 95% con fluency.
2.2.Live cell fluorescence imaging
Generally,cells(RAW 264.7,12000 cells/well;EA.hy926,12000 cells/well;HUV-EC-C,8000 cells/well;primary HUVEC,8000 cells/well)were seeded on a black 96-well microplate with optically clear bottom(Greiner bio-one,Germany)overnight.
For direct fluorescent quantitation of NO,cells were loaded with probe PNO1(1 μM)or DAF-FM DA(5μM)for 15 min or 30 min.For exogenous NO detection,RAW 264.7 cells were first treated with DEA·NONOate in culture medium for 5 min and then co-incubated with PNO1 for another 15 min.For endogenous NO detection,RAW 264.7 cells were incubated with lipopolysaccharide(LPS)(Sigma,L2630)of 1μg/mL for 24 h,after which the culture medium was changed to fresh one containing probe PNO1(1μM)and cells were incubated for 15 min.After incubation,cells were washed with PBS twice before imaging.For NO modulator treatment,cells were pretreated with carboxy-PTIO(Santa Cruz,sc-202985,100μM),1400 W(Santa Cruz,sc-3564,100μM),L-NAME(Beyotime,S0006,100 μM)or A23187(abcam,ab120287,2 μM)for 2 h,then probe PNO1(1μM)was added to the culture medium and the cells were incubated for 15 min.
For direct fluorescent quantitation of GSH,cells were loaded with probe NA8(10μM)for 30 min.The fluorescence images were recorded by Operetta High Content Imaging System(PerkinElmer,US)at the excitation wavelengths of 520-550 nm(except the data in Fig.4B which was obtained on an Opera(PerkinElmer,US)imaging system).The fluorescence was quantified by Columbus Analysis System(PerkinElmer,US).
2.3.Measurement of cellular GSH and GSSG
GSH concentration and GSH/GSSG ratio were detected by a commercially available kit(Beyotime Institute of Biotechnology,Shanghai,China).Brie fly,total glutathione(GSH plus GSSG)was determined in the homogenates spectrophotometrically at 412 nm,after precipitation with 0.1 M HCl,using GR,5,50-dithio-bis-(2-nitrobenzoic acid)(DTNB)and NADPH.GSSG was determined by the same method in the presence of 2-vinylpyridine and GSH content was calculated from the difference between total glutathione and GSSG.The ratio of GSH to GSSG was used to indicate redox status that inferences the detoxification capacity.
2.4.Real-time qPCR
Real-time qPCR was performed using the SYBR GREEN QPCR KIT(Vazyme,Q131-02)on Agilent Mx3000P as specified by the manufacturer.Total RNA was harvested from cells using Trizol reagent(Invitrogen,15596018)and further purified using the standard protocol.One microgram of the total RNAwas transcribed into cDNA in 20μL of reactions using the prime script RT Master Mix TaKaRa,RR036B)and then diluted to 200μL,which was used in subsequent real-time qPCR reactions.GAPDH was used as the normalization control.All reactions were performed in triplicates.The primers used for real-time qPCR are provided in the Table 1.
2.5.Statistical analysis
Unpaired T-test was performed to analyze the results using GraphPad Prism software.Results are presented as mean±SEM.Statistical significance was determined at P<0.05(*),P<0.01(**),P<0.001(***).
3.Results and discussion
3.1.Fluorescent probe used for this study
We have previously developed a BODIPY-based fluorogenic probe(PNO1)for specifically imaging NO in pulmonary fibrosis diseased mice[15].PNO1 by itself is extremely weakly emissive.It demonstrates a NO-dose dependent fluorescence intensification with a high degree of sensitivity,and this fluorogenic response is highly specific towards NO.Facilitated by PNO1,we have observed the upregulation of NO in both the primary lung cells and the lung organs from pulmonary fibrosis-diseased mice[15].Given the observed sensitivity and specificity of PNO1 towards NO,we think its application range may be expanded further to work as a sensitive indicator for screening NO modulators in live cells.To establish such a model,we used both the RAW 264.7 cells and the endothelial cells(EA.hy926 and HUV-EC-C)as model cells,and those well-recognized NO modulators were first tried.
3.2.Testing the response of typical NO modulators in live RAW 264.7 cells with PNO1
RAW 264.7 is one of the most commonly used cell lines for the screening of anti-inflammation active compounds.Activated RAW 264.7 cells produce large amounts of NO,which is generated by iNOS encoded by the NOS2 gene[16,17].iNOS is actually a signature molecule involved in the classical activation of RAW 264.7 cells.Given the importance of NO signaling in RAW 264.7,we then first tested the response of NO modulators in this cell line.iNOS inhibitor 1400 W[18],iNOS inducer endotoxin LPS[19],NO scavenger carboxy-PTIO[20],and NO donor(DEA·NONOate)[21]were selected as typical modulators for this purpose.

Table 1Primer information used for real-time qPCR.
When RAW 264.7 cells were stained with PNO1(1μM)for 15 min,significant intracellular fluorescence was observed(Fig.1).However,if RAW 264.7 cells were first pretreated with iNOS inhibitor 1400 W(100 μM)or NO scavenger carboxy-PTIO(100 μM)for 2 h,and then stained with PNO1 as described above,intracellular PNO1 fluorescence was significantly decreased.This was in accordance with the effect of 1400 W and carboxy-PTIO in decreasing intracellular NO level.However,treating RAW 264.7 cells with bacterial endotoxin LPS to activate iNOS resulted in a dramatic enhancement of PNO1 fluorescence,and similar results were observed when RAW 264.7 cells were pretreated with a NO donor(DEA·NONOate).This agreed well with the effect of LPS and DEA·NONOate in increasing NO levels in RAW 264.7 cells.These results taken together suggest that probe PNO1 works well to indicate the pharmacological effect of these NO modulators in RAW 264.7 cells.
3.3.Evaluating the response of typical NO modulators in live endothelial cells with PNO1
After con firming the reliability of PNO1 as an indicator to evaluate NO modulators in murine macrophages,we then tested whether it can also work well in other cell lines.Given the importance of NO to endothelial function,two cell lines,HUV-EC-C and EA.hy926,were evaluated.As expected,staining HUV-EC-C cells with PNO1 gave apparent intracellular PNO1 fluorescence,suggesting the presence of endogenous NO.This fluorescence could be reduced if cells were pretreated with NO scavenger carboxy-PTIO(Fig.2).Unexpectedly,when HUV-EC-C cells were treated with NO donor DEA·NONOate and then stained with PNO1,the intracellular PNO1 fluorescence decreased(Fig.2),suggesting that DEA·NONOate did not efficiently increase intracellular free NO levels.Furthermore,when HUV-EC-C cells were treated with eNOS modulators,both the inhibitor L-NAME and the activator A23187 were found to decrease the intracellular NO levels.To make further confirmation on this unexpected observation,two experiments were performed.First,we used a commercial NO probe DAF-FM diacetate to stain cells after DEA·NONOate pretreatment[22],and found that intracellular fluorescence of this probe decreased in a DEA·NONOate-dose dependent profile(Fig.S1).Second,primary HUVECs were tested in comparison with the cell line HUV-EC-C.It was observed that both L-NAME and A23187 produced the expected response with L-NAME dose-dependently decreasing intracellular NO levels and A23187 dose-dependently increasing intracellular NO levels(Fig.S2).This observation suggests that it must be the cellular environment that affects the efficacy of these NO modulators in HUV-EC-C cells.
The unexpected observation in HUV-EC-C prompted us to continue evaluating the fluorescent response of PNO1 to modulator stimulation in EA.hy926 cells.Staining intact EA.hy926 cells with PNO1 gave significant intracellular fluorescence,and the intensity was much stronger than that in the HUV-EC-C(Fig.S3).When EA.hy926 cells were pretreated with NO modulators to pharmacologically regulate the intracellular NO levels,both the donor DEA·NONOate and the scavenger carboxy-PTIO caused an increase of the intracellular PNO1 fluorescence,and so did the eNOS activator A23187 and the inhibitor L-NAME(Fig.3),which was totally opposite to our observation in HUV-EC-C cells where all the four modulators worked to decrease the intracellular NO levels(Fig.2).
3.4.Characterization of the cellular microenvironments affecting the behavior of NO modulators in HUV-EC-C and EA.hy926 cells
With the observation that all the four reagents,i.e.,NO donor DEA·NONOate,NO scanvenger carboxy-PTIO,eNOS activator A23187 and eNOS inhibitor L-NAME,worked to decrease intracellular NO level in HUV-EC-C cells but to increase intracellular NO level in EA.hy926 cells,we set out to determine the underlying mechanisms.Since EA.hy926 cells demonstrated a much higher intracellular PNO1 fluorescence than HUV-EC-C cells(Fig.S3),we hypothesized that EA.hy926 cells may have a higher basal NO level than HUV-EC-C,and accordingly a higher NOS level.To make confirmation,we compared the mRNA levels of NOS between HUVEC-C and EA.hy926 cells by RT-qPCR with the primary HUVEC cells where both L-NAME and A23187 gave normal responses as the control.It was observed that all three kinds of cells displayed similar and low iNOS levels.However,their eNOS levels varied a lot with EA.hy926 cells having a much higher eNOS level than the primary HUVEC cells while the cell line HUV-EC-C had a much lower eNOS level(Fig.4A).We assumed that the different eNOS levels in the two cell lines may contribute to their opposite response profiles towards the NO modulators.To confirm these assumptions,we manipulated eNOS levels in the cells using a genetic method.
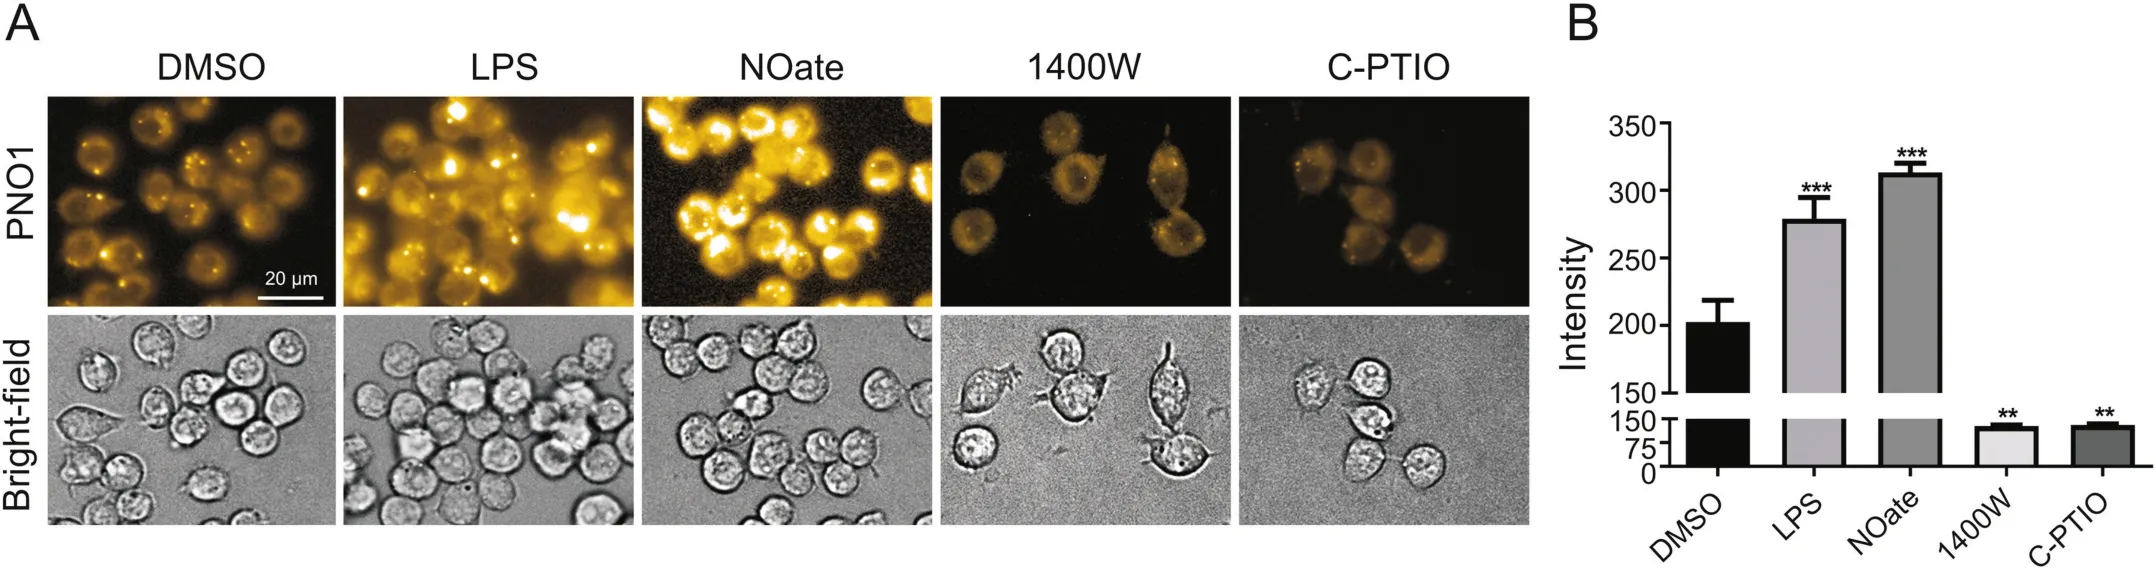
Fig.1.Characterization of endogenous NO in RAW264.7 cells using probe PNO1.(A)Images of cells pretreated with various NO modulators(1 μg/mL LPS for 24 h,or 50 μM DEA·NONOate(NOate)for 15 min,or 100 μM 1400 Wor carboxy-PTIO(C-PTIO)for 2 h)and then incubated with 1 μM probe PNO1 for 15 min.(B)Quantified fluorescence intensities of cells as represented in panel(A).
First,EA.hy926 cells were transfected with siRNA for eNOS to decrease eNOS level or mock siRNA as a negative control.The knockdown efficiency of siRNA for eNOS was carefully confirmed(Fig.S4A).Then the cells were treated with L-NAME followed by staining with PNO1 for 15 min.As shown in Figs.4B and C,in contrast to the control group which showed little change of intracellular PNO1 fluorescence in response to L-NAME,the eNOS siRNA treated group displayed a significant decrease in intracellular PNO1 fluorescence after L-NAME stimulation,suggesting that decreasing the eNOS level in EA.hy926 cells restored the effect of L-NAME to decrease intracellular NO levels.
Then HUV-EC-C cells were transfected with the indicated eNOS construct or mock vector as a control,and the over-expressing efficiency was confirmed by quantitative PCR(Fig.S4B).Compared with the control cells transfected with only mock vector which showed no apparent increase in intracellular PNO1 fluorescence when the cells were treated with A23187,HUV-EC-C cells overexpressing eNOS responded to A23187 with a significant increase of intracellular PNO1 fluorescence(Figs.4D and E),suggesting that over-expression of eNOS in HUV-EC-C cells helped A23187 to increase intracellular NO levels.
Based on the above observations,it is reasonable to hypothesize that the eNOS levels in the two cell lines have a significant impact on the behavior towards NO modulators.We assumed that the differenteNOS levels between HUV-EC-C and primary HUVECs may be the result of cells in adaption to the preferred cellular homeostasis during passaging.Since it has been reported that there is residual NO existing in live cells[23,24],it is possible that the eNOS level determines the residual NO level which buffers exogenous stimulation to maintain the steady-state concentration of intracellular NO.
As NO readily nitrosylates thiols,a process known as S-nitrosation which is a reversible post-transcriptional protein modification belonging to the NO signaling network[11],we hypothesized that the widely present glutathione(GSH)in cells which is an important anti-oxidant expressed at mM concentration might react with NO to form residual NO and work as the NO reservoir to buffer exogenous stimulations.To test this hypothesis,e compared the endogenous GSH levels between the two cell lines.As shown in Figs.5A and B,using a commercial GSH and GSSG detecting kit,the eNOS highly expressing EA.hy926 cells were observed to have a lower GSH level than HUV-EC-C cells.The two cell lines were also stained with a GSH specific fluorescent probe NA8[25],and HUVEC-C cells demonstrated a much higher intracellular fluorescence(Figs.5C and D),further con firming the higher GSH levels.Interestingly,if GSH was partially scavenged in HUV-EC-C with N-ethylmaleimide(NEM),and then the cells were stained with PNO1 to detect intracellular NO,a dramatic fluorescence enhancement could be observed in response to GSH scavenging,suggesting the release of NO from nitrosylated GSH(Figs.5E and F,and Fig.S5 for the bright- fluorescent merged picture).Moreover,if HUV-EC-C cells were first treated with NEM to consume GSH and then treated with DEA·NONOate,the intracellular PNO1 fluorescence was found significantly increased compared with the control group without GSH scavenging,suggesting that DEA·NONOate actually worked well to release NO but the released NO may be held by GSH instead of being released to the cytosol.All these results agree well with our hypothesis that the endogenous GSH and the nitrosylated GSH may work as a NO buffer to help cells rapidly restore their steady-state NO levels upon exogenous stimulation.
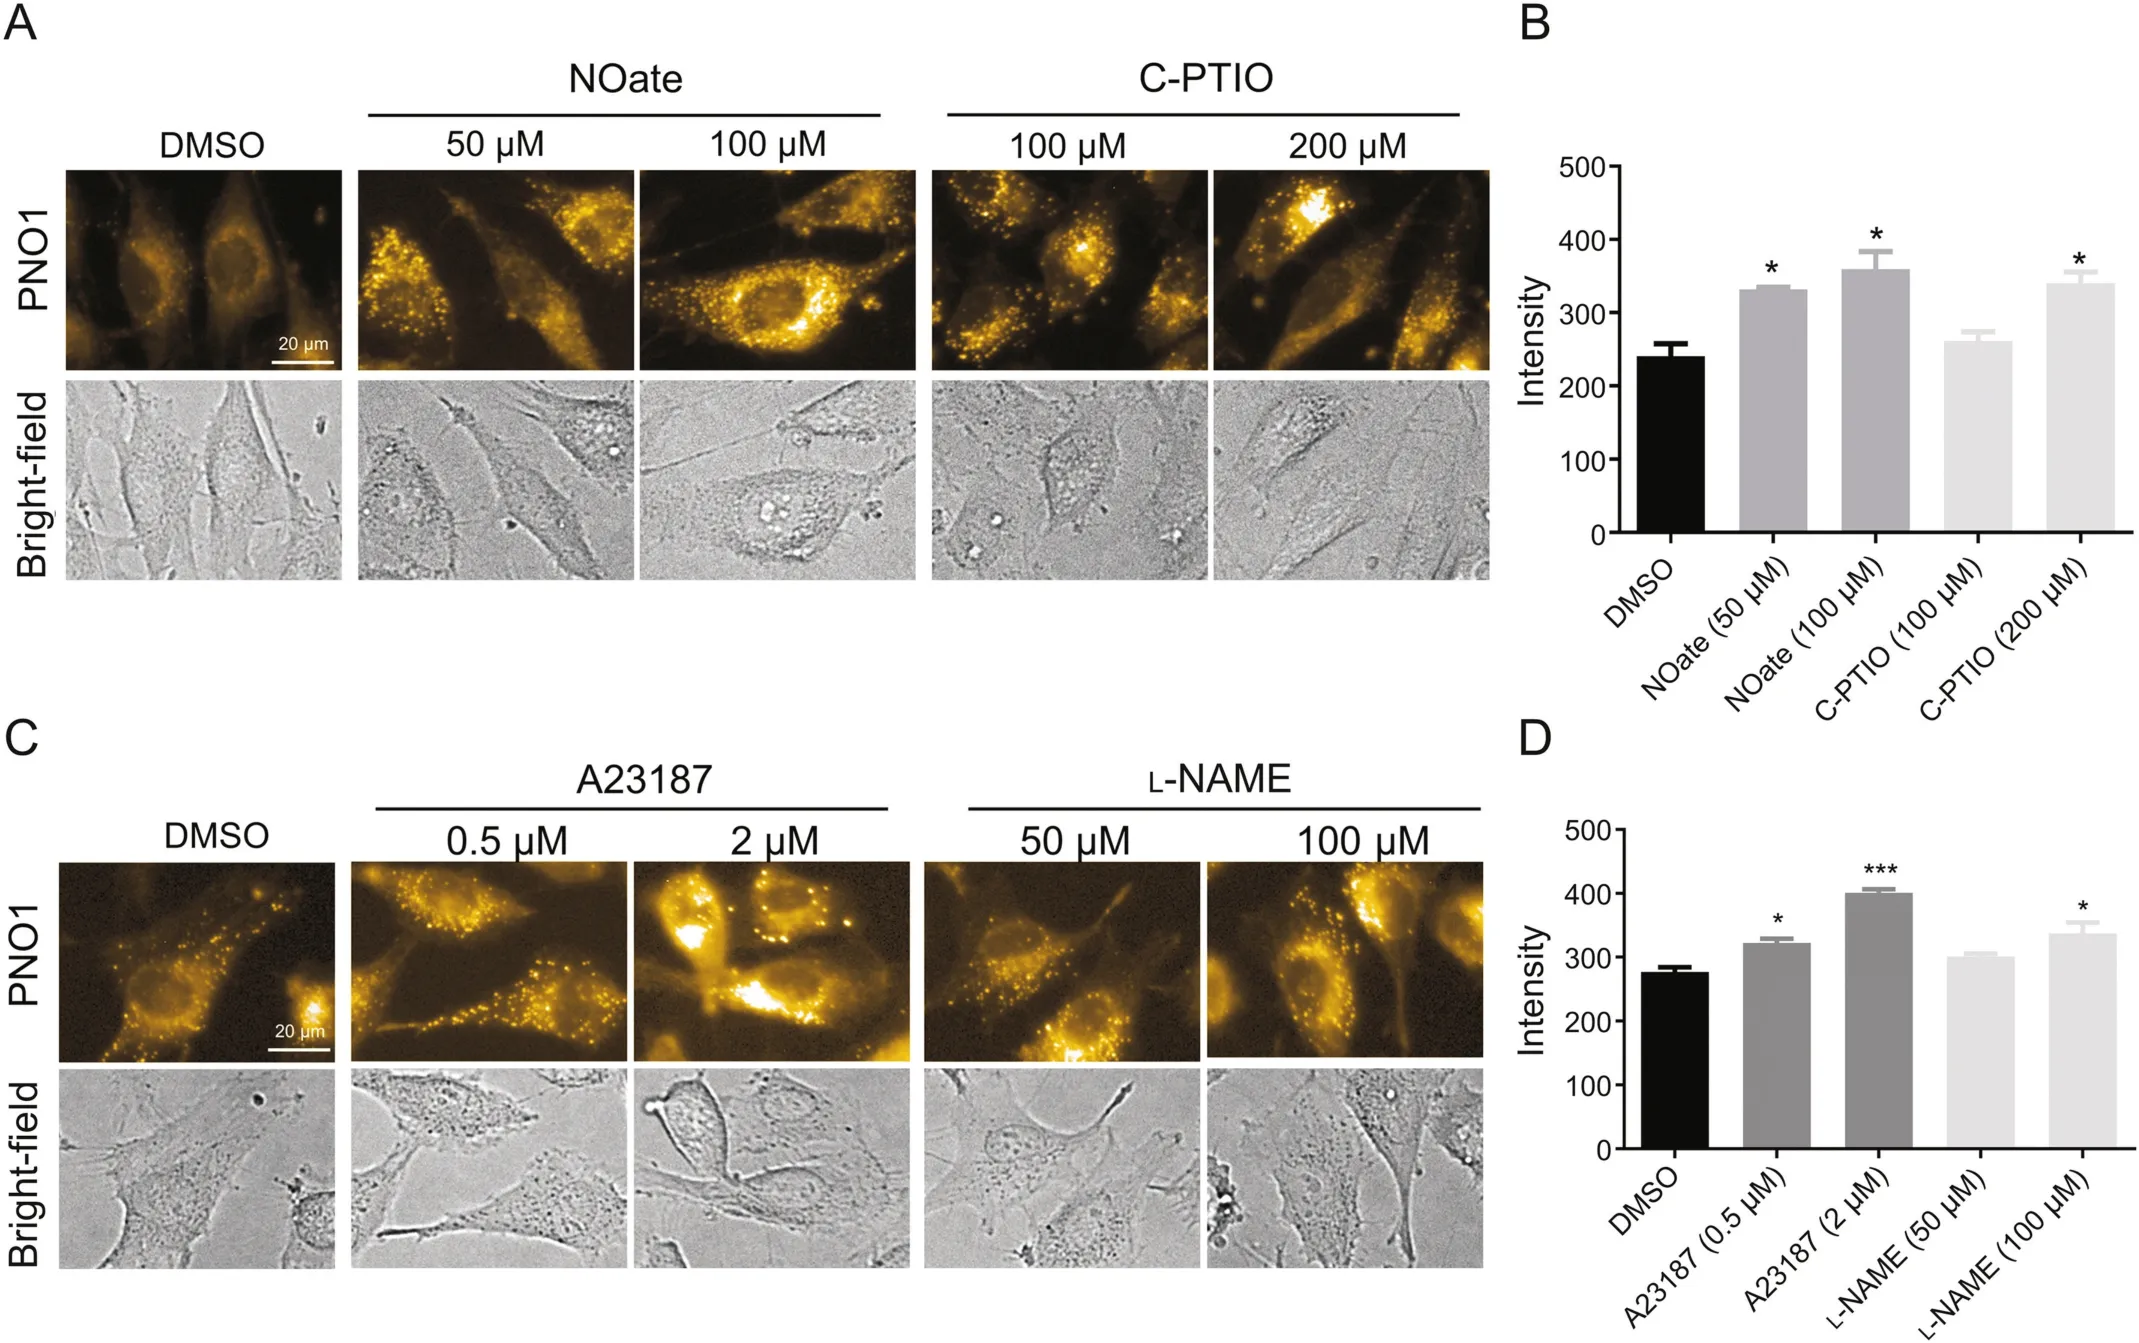
Fig.3.Characterization of NO in EA.hy926 cells using probe PNO1 under different conditions.(A)Images of EA.hy926 pretreated with carboxy-PTIO(C-PTIO)or DEA·NONOate(NOate)at indicated concentration and then incubated with 1μM probe PNO1.(B)Quantified fluorescence intensities of cells as represented in panel(A).(C)Images of EA.hy926 pretreated with A23187 or L-NAME at indicated concentration for 2 h and then incubated with 1μM probe PNO1 for 15 min.(D)Quantified fluorescence intensities of cells as represented in panel(C).
4.Conclusions
In summary,using a sensitive NO fluorescent probe as a NO indicator,we found that the intracellular behavior of some NO modulators depends on the cellular microenvironments in endothelial cell lines,wherein a high eNOS level induces a high residual NO level which releases free NO to maintain a high intracellular NO level when cells are stimulated with either NO scavengers or NO donors,while a high cellular GSH level holds NO released from NO donors to restore the cells to their homeostatic NO levels,and vice versa.Based on this observation,we believe that intracellular GSH may work as the reservoir for NO in endothelial cells,and GSH together with its nitrosylated form could buffer exogenous stimulation in order to help cells recover their homeostatic NO levels which are determined,at least in part,by eNOS levels.We think this unexpected observation will encourage additional research on eNOS-NO-GSH synergetic pathways.Our results also highlight the versatility of chemical probes as efficient tools for monitoring cellular microenvironments.In addition to its advantage of being straightforward,fluorescent imaging-based method for interrogating biological system also has the advantage of providing sub-cellular localization information for target biomolecules,which can deepen our understanding of biological phenomena.As shown in this work,native NO tends to locate near the cellular inner membrane in intact HUV-EC-C cells,while near the nucleus in intact EA.hy926 cells.Interestingly,there are black dots apparently observed in HUV-EC-C cells under the bright field,and these black dots have a good degree of co-localization with PNO1 fluorescence,suggesting that these black dots may be some kind of vesicles rich in NO.The significance of the different localization of NO in HUV-EC-C and EA.hy926 cells,together with the function of the black dots,deserves further exploration.In addition to the eNOS-NO-GSH synergetic pathways,NO exists in more forms such as protein binding form(either nitrosylated protein or nitrated protein),or being derivalized to more reactive species such as peroxynitrite.Since PNO1 is specific towards NO and its fluorescence intensity is only correlated with free NO in live cells,future work may focus on developing specific probes targeting each form of NO,and then studying various forms of NO as a whole with the combinational application of the NO imaging toolkit.
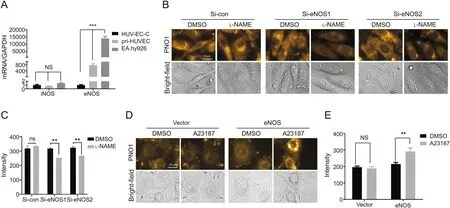
Fig.4.Characterizing the role of NOS on the behavior of NO modulators in HUV-EC-C,EA.hy926 and primary HUVEC(pri-HUVEC)cells.(A)Comparison of eNOS and iNOS mRNA levels in HUV-EC-C,primary HUVEC and EA.hy926 cells.Data shown were the quantitative real time PCR results for eNOS/iNOS mRNA isolated from EA.hy926,HUV-EC-C and primary HUVEC.(B)-(C)Images and quantified intracellular PNO1 fluorescence intensity of EA.hy926 cells transfected with siRNA for eNOS or for control and then treated with LNAME(100 μM,2 h)followed by being stained with PNO1(1 μM)for 15 min.The siRNA sequences for eNOS are as follows:Si-eNOS1:CGAGGAGACUUCCGAAUCUUU,si-eNOS2:CCUACAUCUGCAACCACAU.(D)-(E)Images and quantified intracellular PNO1 fluorescence intensity of HUV-EC-C cells over expressed with constructs for eNOS or for mock vectors and then treated with A23187(2 μM,2 h)followed by being labelled with PNO1(1 μM)for 15 min.
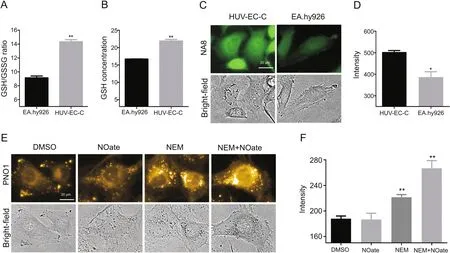
Fig.5.Characterizing the role of GSH on the behavior of NO modulators in HUV-EC-C and EA.hy926 cells.(A)Comparision of GSH/GSSG ratio in HUV-EC-C and EA.hy926.(B)Comparision of GSH levels in HUV-EC-C and EA.hy926.(C)-(D)Images and quantified intracellular GSH probe fluorescence intensities in HUV-EC-C and EA.hy926 cells.(E)-(F)Images and quantified intracellular PNO1 fluorescence intensities in HUV-EC-C cells pretreated with NEM(50 μM)or DEA·NONOate(50 μM)followed by being labelled with PNO1(1μM)for 15 min.
Declaration of competing interest
The authors declare that there are no conflicts of interest.
Acknowledgments
We greatly appreciate the financial support from the National Natural Science Foundations of China(21778048,81673489,31871414,U1703235),the National Key R&D Program of China(2019ZX09201001-003-010),the Natural Science Foundation of Zhejiang Province,China(LR18H300001),and Shanghai Science and Technology Development Funds(19YF1457500).
Appendix A.Supplementary data
Supplementary data related to this article can be found at https://doi.org/10.1016/j.jpha.2020.05.010.
 Journal of Pharmaceutical Analysis2020年5期
- Journal of Pharmaceutical Analysis的其它文章
- Catalysis-based specific detection and inhibition of tyrosinase and their application
- Fluorescence imaging of drug target proteins using chemical probes
- A pyrene-based ratiometric fluorescent probe with a large Stokes shift for selective detection of hydrogen peroxide in living cells
- Recent advances in construction of small molecule-based fluorophoredrug conjugates
- Fluorescent antibiotics for real-time tracking of pathogenic bacteria
- Strategies for PET imaging of the receptor for advanced glycation endproducts(RAGE)