
Effects of Different Temperatures on the Quality Characteristics of Prepared Chicken Steak during Low-Temperature Storage
2021-09-27 06:48ZHOUKaiZHOUGanXIEYongWANGZhaomingLIXianbaoZHOUHuiXUBaocai
食品科學 2021年17期
ZHOU Kai, ZHOU Gan, XIE Yong, WANG Zhaoming, LI Xianbao, ZHOU Hui, XU Baocai,*
(1.School of Food and Biological Engineering, Hefei University of Technology, Hefei 230601, China;2.Engineering Research Center of Bio-process, Ministry of Education, Hefei University of Technology, Hefei 230601, China;3.College of Food Engineering, Anhui Science and Technology University, Chuzhou 233100, China)
Abstract: In order to study the effects of different temperatures on the quality characteristics of prepared chicken steak during low-temperature storage, chicken samples were stored at 4, -2 or -18 ℃ and evaluated for total viable count, color,water-holding capacity and texture characteristics as well as observed by scanning electron microscopy (SEM).The shelf-life of prepared chicken steak stored at -2 ℃ was about 12 days compared to only about four days at 4 ℃.The water-holding capacity and textural properties were best maintained at -2 ℃.Moreover, the results from SEM suggested that the microstructure was less damaged at -2 ℃ compared to the other two storage temperatures.Although the shelf-life of frozen chicken steak was much longer (over 90 days), the water-holding capacity, texture and microstructure deteriorated faster.In contrast, storage at -2 ℃ could prolong the shelf life while maintaining the quality characteristics of prepared chicken steak well.This study provides strong evidence that prepared meat products should be stored at -2 ℃.
Keywords: prepared chicken steak; low-temperature storage; super-chilled storage; quality characteristics; shelf-life
With the improvement of people’s living standards,healthy, safe, and high-quality foods with natural flavor are preferred by consumers.According to theAgricultural Industrial Standard of ChinaNY/T 2073-2011, prepared meat products are roughly processed and flavored meat products (livestock and poultry meat), and need further cooking before consumption.Such prepared products are increasingly favored by consumers because of their convenience, nutrition, and taste.Unlike raw meat and cooked products, prepared meat products are usually packaged without sterilization, thus are more susceptible to quality deterioration caused by bacterial attack than other meat products.What’s more, the flavouring added in prepared meat products needs additional protection as the storage loss may lead to the loss of the added flavor.Among massive food preservation methods, such as coating preservation[1],vacuum package[2], and high-pressure preservation[3], the most efficient method used in prepared meat product is still low temperature[4].
Chilled (4 ℃) and frozen (-18 ℃) storage are commonly utilized in the preservation of meat products in food industry.Chilled storage helps to suspend denaturation of meat proteins which is susceptible to bacterial attack.As no ice crystal is produced during chilled storage, the quality,such as water holding capacity, elasticity, and color, can be mostly remained in a brief period[5].However, the shelf-life of chilled storage is not long enough for transport and retail.On the other hand, frozen storage is a much more efficient method for food preservation and endows meat products with a long shelf-life.As water contributes to 50%-70% of meat by mass, most of them were converted into ice in the process of freezing[6].Thus, low temperature and less free water restraining the growth of micro-organisms can lead to a quite long shelf-life.However, ice crystal damages the muscle cells mechanically and leads to severe storage loss and myofibrillar breakage, which decreases product qualities in terms of texture, color and water holding capacity[7].Efforts have been made in resistance against quality loss in frozen storage.For example, Farouk et al.reported that fast-freezing could reduce the duration in the thawing process of beef,while no difference was observed in functional properties between fast and slowly frozen muscles[8].Muela et al.[9]assessed the effect of different frozen methods with different frozen storage durations on the sensory quality of lamb,which showed that no significant differences were detected by the trained panel test.Although the quality loss could be decreased by new methods, the expensive cost is another rigorous problem for frozen storage.The term “super-chilled”(or partial frozen, deep chilled), a different concept compared with chilled and frozen, refers to a process by which the temperature of a food product is lowered to 1-2 ℃ below the initial freezing point, where ice crystals are not generated yet[10].It has been reported that super-chilled storage can better retain food quality than chilled storage and prolong the shelf-life of the food by almost 2-4 times[11].Further, when compared with frozen storage, super-chilled storage reduces quality loss by being free of freeze-thaw process and saves energy cost in transport and retailing.Thus, super-chilled has already been utilized in the storage of different food, such as raw fish fillets[12], pork roast[13], fruits[14], and vegetables[15], for retention of freshness and extension of shelf-life.However,the study of the effect of super-chilled on prepared meat products has been rarely reported.
Here in this article, the quality changes of prepared chicken steak during super-chilled storage (-2 ℃) were studied, comparing with chilled storage and frozen storage.The shelf-life was first revealed through microbiological analysis.Quality characteristics of color, storage loss, texture properties and microstructure were then analyzed.The results in the present study could provide evidence for utilizing super-chilled temperature in the storage and transport of prepared meat products.
1 Materials and Methods
1.1 Materials and reagents
Frozen chicken breast meat was purchased from Jiangsu Yufei Food Ltd.and sub-packaged under aseptic condition for further use.Marinade was provided by Nanjing Yurun Group.
Materials for agar medium were purchased from Beijing Land Bridge Technology Co., Ltd..Other reagents, such as NaCl, alcohol and tertiary butanol were all in analytical purity and purchased from Sinopharm Chemical Reagent Co., Ltd..
1.2 Equipment and instrument
AT4202 digital temperature probe Changzhou Sanfeng Instruments Ltd.; KDN-103F Kjeldahl apparatus Shanghai Xianjian Instrument Ltd.; S210 digital pH meter Swiss Mettler Toledo Co., Ltd.; CR-400 fully-automatic colorimeter Japan Konica Minolta Investment Ltd.;TA.XT Plus texture analyzer UK Stable Micro Systems Ltd.; JSM-6490LV scanning electron microscope (SEM)Tokyo JEOL Ltd..
1.3 Methods
1.3.1 Sample preparation
All appliance was sterilized through radiation by UV light for 20 min.Frozen chicken breast meat was thawed under chilled conditions until that the core temperature reached 4 ℃.The bulk chicken meat was then filleted into 10.0 cm × 7.0 cm × 1.5 cm ((100 ± 5) g) and pickled in marinade for 2 h through tumbling.After standing in 4 ℃ for another 2 h, the prepared chicken steaks were divided into 3 groups, packaged in pallets, and stored in super-chilled(-2 ℃), chilled (4 ℃), or frozen (-18 ℃) temperatures,respectively.All samples were tested for different indicators every 2 days during storage.Before each test, frozen samples were firstly thawed under 4 ℃ to a centric temperature of 4 ℃.While samples of chilled and super-chilled were stood under 4 ℃ for the same time as frozen samples before testing.Five samples of each group were analyzed in each sampling point,and three replicates of each measurement were conducted on all samples.
1.3.2 Temperature monitoring
The digital temperature probe was inserted into the center of prepared chicken steak and stood in -18 ℃ along with the steak.Temperatures were recorded every 1 min, and the frozen curve was plotted as temperatures vs time.
1.3.3 Microbiological analysis
Total viable count (TVC) of different samples was determined according to the method previously reported[16]with some modifications.Briefly, a sample of 25.0 g was aseptically weighted and homogenized with 225 mL sterile 0.9% physiological saline for 1 min.One milliliter homogenized sample were serially diluted in 9 mL sterile saline and then transferred on petri dishes containing 15 mL agar medium.After being incubated for 48 h in 37 ℃, colonies were counted.TVC was the mean values of colony forming units(CFU) averaged from three dilutions of each sample.
1.3.4 Determination of total volatile basic nitrogen content
Total volatile basic nitrogen (TVB-N) content was detected utilizing the procedure described by Sun Qinxiu et al[17].Briefly, 10.0 g of minced samples were dispersed in 100 mL distilled water in conical flask and shocked for 30 min at 4 ℃ (take the same volume of distilled water as the blank).After filtering, 20 mL of filtrate was mixed with 1.0 g MgCl2and loaded into a Kjeldahl apparatus.TVB-N content was determined according to the consumption of HCl and calculated as equation (1).

WhereV1is the HCl consumption volume of sample/mL;V2is the HCl consumption volume of blank/mL;cis the concentration of HCl/(mol/L).
1.3.5 Determination of storage loss rate
Storage loss rate was determined according to the method previously reported[18].Briefly, the sample was weighted asm0/g before storage.The frozen samples were then thawed to a centric temperature of 4 ℃, blotted with filter paper to remove surficial water, and weighted asm1/g.Storage loss was calculated as equation (2).Storage losses of the samples under chilled and super-chilled storage were determined in the same procedure as frozen samples without thawing process.

1.3.6 pH determination
pH was evaluated according to the methods described by Wang Zhaoming et al.[19]with slight modifications.Ten grams of minced sample were homogenized in 100 mL distilled water using a high-speed disperser.The mixture was then filtered, and pH of the filtrate was measured using a digital pH meter.
1.3.7 Color determination
Color changes during super-chilled, chilled and frozen storage were determined with a fully-automatic colorimeter according to the method previously reported[20].Each sample was crosscut and color indicators ofL* (lightness),a*(redness), andb* (yellowness) were determined in cross section at four different locations.
1.3.8 Textural analysis
Textural analysis was carried out using the method previously reported with slight modifications[21].Each sample was cut into the size of 2.0 cm × 2.0 cm × 1.5 cm and allowed to equilibrate at room temperature for 1 h before measurement.The hardness and springiness of those samples were measured with a TA.XT Plus texture analyzer under thefollowing parameters: compression ratio of 40%, test speed of 1.0 mm/s, pre- and post-speed both of 5.0 mm/s, trigger force of 5 g, test interval of 5 s.
1.3.9 Scanning electron microscope analysis
Microstructure of the stored steak was visualized by SEM according to the method reported else[22]with some modifications.Briefly, samples were cut into 3 mm × 3 mm ×3 mm, and fixed with 2.5% glutaraldehyde in 0.1 mol/L phosphate buffered saline (pH 7.2) for at least 2 h under 4 ℃.After washing with phosphate buffered saline, samples were dehydrated using 30%, 50%, 70% and 90% ethanol for 15 min in sequence.The dehydrated samples were then washed with 100% ethanol, followed by ethanol/tertiary butanol in the ratio of 3:1, 1:1, 1:3 and 100% tertiary butanol,in turn.The obtained samples were immersed in tertiary butanol and frozen for 24 h, followed by vacuum freezedrying.The freeze-dried samples were sputter-coated with gold/palladium and examined with a JSM-6490LV scanning electron microscope at 20 kV.
1.4 Statistics analysis
Statistical analysis was performed using SPSS 19.0 software.Duncan’s multiple range test was used to compare the results of different samples.The significance threshold for all statistical analyses was set atP< 0.05.Origin 9.1 software were used for data processing.Values were given as mean of five samples with standard deviations.
2 Results and Analysis
2.1 Determination of freezing temperature curve
The temperature profiles of prepared chicken steak at the temperature of -18 ℃ were shown in Fig.1.As depicted,sample core temperature decreased rapidly to -2.2 ℃ (the ice nucleation point) in 1.2 h, where it rose to -1.4 ℃ in the next 0.3 h.The core temperature of the prepared chicken steak declined slightly thereafter and reached -2 ℃ in almost 5.7 h.Thus, freezing point of prepared chicken steak was-1.4 ℃, which was similar to the freezing point in the previous study[23].Thus, the super-chilled temperature herein was set to -2 ℃.
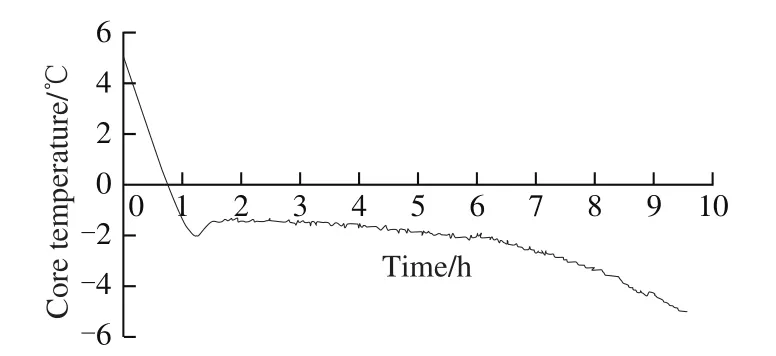
Fig.1 Freezing curve of prepared chicken steak frozen at -18 ℃
2.2 Effect of different temperature on total viable count of chicken steak
TVC was the important parameter to evaluate the shelf-life of meat products.The changes in TVC with time at different temperatures were shown in Fig.2, in which the initial values were all 3.5 (lg(CFU/g)) for the three storage temperatures.While TVC of the sample in frozen storage did not show significant changes compared with the initial number(P> 0.05), the sample in chilled storage was under seriously bacteria attack as indicated by the rapidly increasing TVC.Using 6.0 (lg(CFU/g)) as the microbial safety criteria according to theAgricultural Industrial Standard of ChinaNY/T 2073-2011, the shelf-life of prepared chicken steak under chilled storage herein would be approximately 4 days.This result was in good agreement with the results previously reported[24], where the TVC of chicken breast fillets under chilled storage reached 6.5 (lg(CFU/g)) after 5 days.When it came to super-chilled storage, the TVC did not show significant increment during the first 10 days’ storage(P> 0.05) and rose rapidly to 6.14 (lg(CFU/g)) in the next 4 days.Thus, the shelf-life of prepared chicken steak under super-chilled storage might be up to 12 days, which was much shorter than that of frozen storage (over 90 days) but 3 times to that of chilled storage.
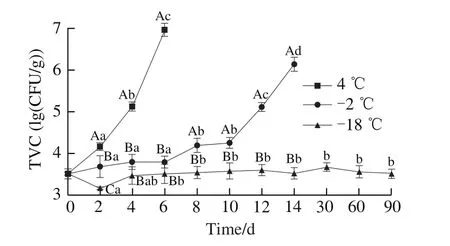
Fig.2 Total viable counts of prepared chicken steak during storage at different temperatures
2.3 Effect of different temperature on total volatile base nitrogen content of chicken steak
TVB-N content has been widely used as the indicator of deterioration of meat quality, which was caused by bacterial catabolism of amino acids in meat muscle resulting in the accumulation of ammonia and other volatile bases[25].The TVB-N content of prepared chicken steak under different storing temperatures were shown in Fig.3.As depicted,TVB-N content of all samples increased significantly comparing with the initial number (P< 0.05), among whichthe samples under chilled storage increased the fastest,indicating the most serious deterioration caused by microbial attack.TVB-N content on day 2, day 4, and day 6 of chilled storage (11.87, 13.01, 18.22 mg/100 g, respectively) were all significantly higher than super-chilled (10.57, 11.21,13.95 mg/100 g, respectively) and frozen temperatures(10.46, 10.79, 11.43 mg/100 g, respectively) (P< 0.05),respectively.These results were in good agreement with the TVC results discussed above, and same results were reported by Tian Xiaojing et al.[26], where TVB-N content had a positive relationship with the microorganisms in meat products.This study herein reinforced that the bacterial spoilage induced formation of ammonia, amines and trimethylamines in meat products was responsible for the increase of TVB-N content[27].Super-chilled samples bore less microbial attack compared with chilled samples because of the lower temperature, especially in the first six days.Such improvement by super-chilled was also found in the storage of other meat products[28].Nevertheless, TVB-N content of super-chilled sample increased rapidly after 4 days of storage.When it came to the frozen samples, microbial attack indicated by TVB-N content was much lower than that of the other two temperatures.For frozen storage, TVB-N content of the chicken steak showed a slightly increase in the first 14 days’ storage and grew rapidly thereafter.
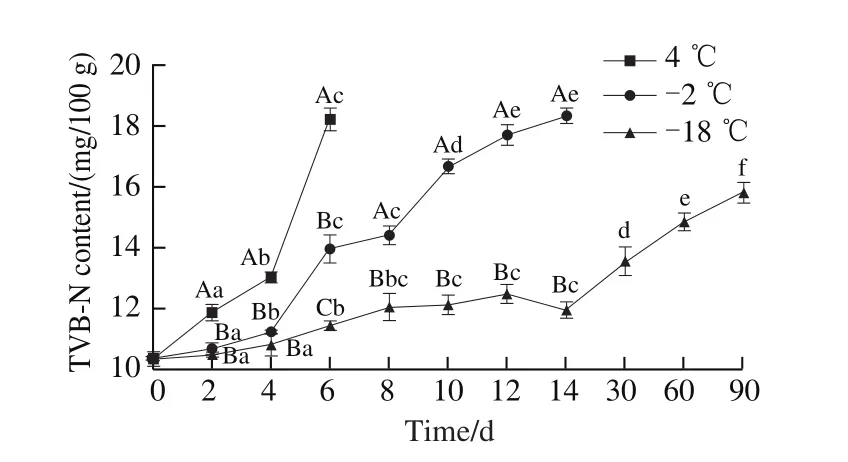
Fig.3 TVB-N contents of prepared chicken steak during storage at different temperatures
2.4 Effect of different temperature on storage loss rate of chicken steak
The evaluation of water holding capacity (WHC)could be revealed by the detection of storage loss of muscle samples[29].As shown in Fig.4, the storage loss rate of samples under frozen storage (-18 ℃) in the first 4 days was higher than that of either chilled or super-chilled samples, and the storage loss rate of all the samples continually increased during long time storage.And there was no significant difference (P> 0.05) in storage loss rate between chilled and super-chilled samples in the first 4 days’ storage.However,the prepared chicken steak under chilled storage after 4 days lost its WHC due to severe endogenous enzyme-induced protein degradation and structural damage of membranes[30],leading to a severe storage loss that was even higher than that of the frozen samples.On the other hand, the sample under super-chilled storage maintained a relatively high WHC (low storage loss rate) throughout its shelf-life.Although frozen samples could be stored for a long time (up to 3 months), the storage loss was quite severe throughout storage, which could attributed to the mechanical damage on muscle cells caused by ice crystals.
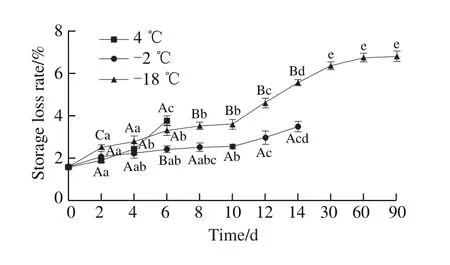
Fig.4 Storage loss rate of prepared chicken steak during storage at different temperatures
2.5 Effect of different temperature on pH of chicken steak
The variations in pH of prepared chicken steak during storage at different temperatures were curved in Fig.5.The initial pH of chicken steak was 5.81, which was similar with the previous study[7].pH values of the samples under chilled and super-chilled storage significantly increased with storage time (P< 0.05), and the chilled samples increased faster.This was mainly because that pH could be increased by the alkaline amine compound from endogenous enzymeinduced protein degradation and bacterial decomposition[20],which could be accelerated by high temperatures (herein 4 ℃ > -2 ℃).The results showed in microbial analysis revealed that bacteria could hardly reproduce at -18 ℃,thus, little bacterial decomposition happened to chicken meat proteins under frozen storage.In addition, frozen of water in meat cells did not favor the enzymatic hydrolysis of meat proteins.Consequently, the pH of frozen samples showed no significant increment in Fig.5(P> 0.05).Unlike frozen storage temperature, the reproduction speed of bacteria and the activity of endogenous enzymes under super-chilled temperatures were partly limited, as a result, the pH value increased slowly.After 12 days’ storage (shelf-life), severe bacterial attack speeded up such increment.
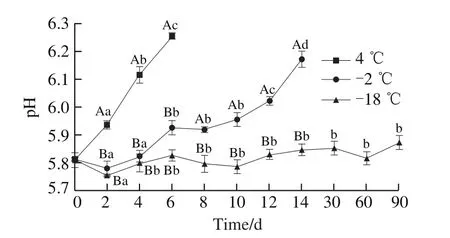
Fig.5 pH of prepared chicken steak during storage at different temperatures
2.6 Effect of different temperature on color changes of chicken steak
Meat color is an important parameter of the appearance of meat for consumers to evaluate meat quality.The color changes of prepared chicken steak stored at different temperatures were shown in Fig.6.L* values of all samples showed a significant increment in the first 2 days, indicating the lightness was enhanced during two days’ storage, and this could be attributed to the migration of water to the surface of meat muscle.And theL* value of chilled samples decreased afterwards, while super-chilled samples and frozen samples deceased after day 4 and day 6, respectively.The increase of lightness in early stage was also observed in the chilled storage of thawed beef[31].And the decrease of lightness might be associated to the free water migration and/or content changes caused by protein degradation during the storage[32],which might be also attributed to the higherL* value of frozen samples.
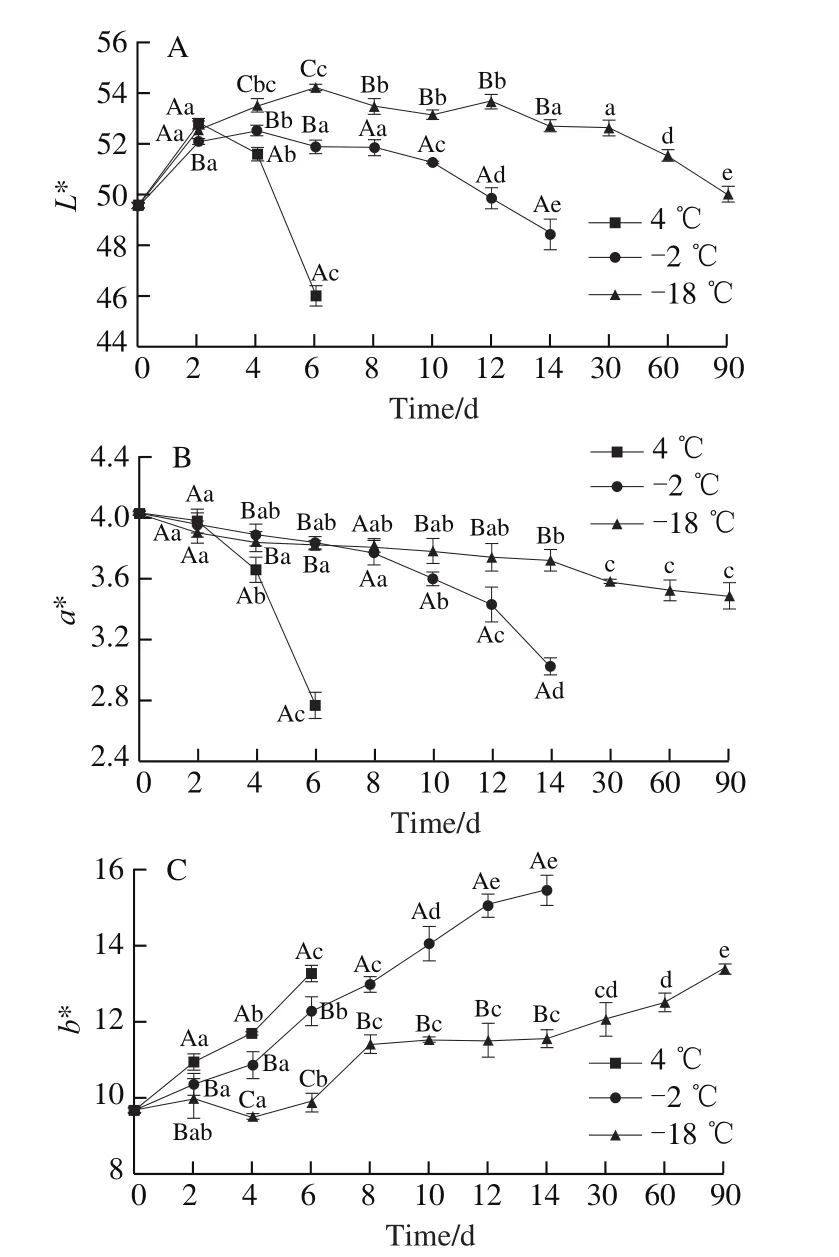
Fig.6 Color parameters L* (A), a* (B), and b* (C) of prepared chicken steak during storage at different temperatures
With the extension of storage time,a* values continually decreased for all samples, where chilled samples showed a significant lower value than the other two temperatures after 4 days’ storage (P< 0.05).The values of super-chilled samples were not significantly different before the first 8 days’ storage to frozen samples (P> 0.05) but were much lower thereafter.Asa* values represented the redness of meat, these results indicated that all samples tended to darken during storage, and chilled samples darkened fastest.The decrease of redness was mainly attributed to the oxidation of myoglobin, the principal pigment responsible for the red color of meat.Similar results were obtained in the frozen storage of rabbit meat[19].
b* values in all the three groups increased with the prolongation of storage time, and chilled samples were significantly higher than super-chilled and frozen samples throughout the storage time (P< 0.05).Super-chilled samples showed significantly higherb* values than that of frozen samples after 4 days’ storage.It has been reported that an increase inb* value (yellowness) might be attributed to the oxidation of fat and proteins, which could be slowed down by low temperatures[33].
2.7 Effect of different temperature on textural properties of chicken steak
Textural properties were tested and recorded as hardness and springiness based on their resistance to compression,and the results were shown in Fig.7A and 7B, respectively.As depicted, hardness increased with storage time at all temperatures, which might be caused by the loss of WHC.After 12 days’ storage (the shelf-life of super-chilled storage),the hardness of super-chilled samples seemed to be lower than that of either chilled sample at day 4 or frozen sample at day 12, and the difference was significant on the sixth day of storage (P< 0.05).Food springiness is revealed by the recovery ratio after removal of the compression on food,which was also attributed to the WHC[32].All samples showed the same trend in springiness changes during storage, where the values continually decreased over time.The samples under storage at three different temperatures showed no significant difference after 4 days’ storage.Super-chilled samples maintained the highest springiness on the sixth day,where chilled sample lost the most springiness.These results were in good agreement with the storage loss describedabove.Super-chilled samples showed the same elastic property with frozen ones in the next 6 days, which collapsed after 12 days’ storage.
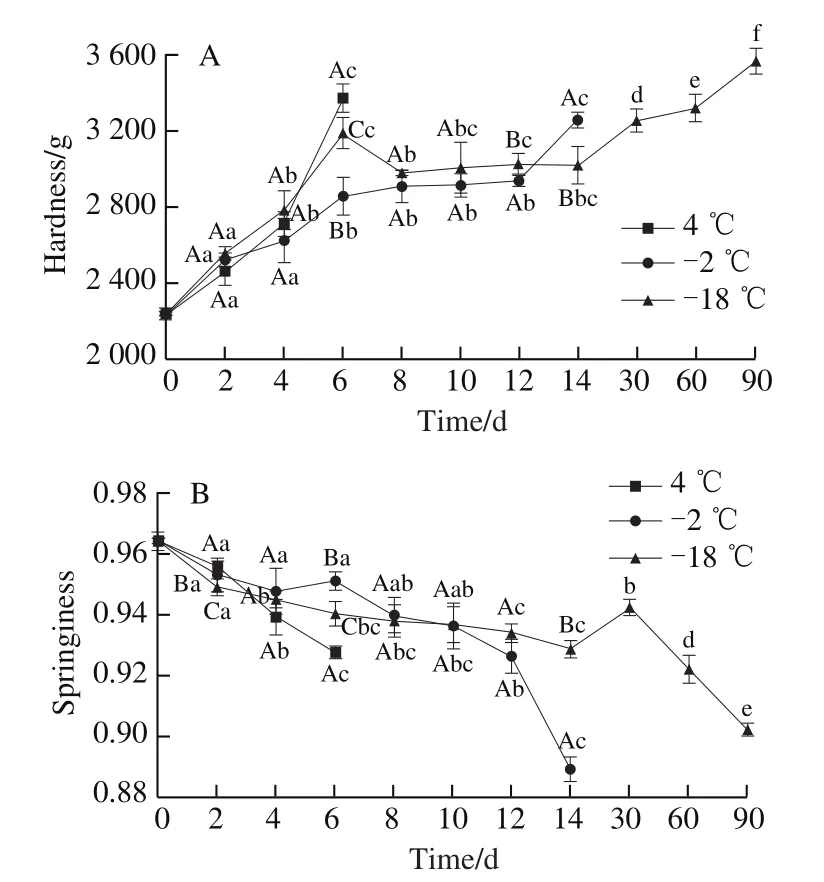
Fig.7 Textural changes in hardness (A) and springiness (B) of prepared chicken steak during storage at different temperatures
2.8 Effect of different temperature on microstructure of chicken steak
Microstructure of prepared chicken steak during storage at different temperatures was characterized by SEM.As depicted in Fig.8, the microstructure of the chicken muscle before storage (control) showed well-organized fibre bundles with tiny gaps.These gaps enlarged in chilled sample (4 ℃,4 d) due to reduction of the interactions between the muscle fibers, which might be caused by water migration and protein degradation.While at lower temperatures, the gaps of the chicken muscle remained tiny after storing for 4 days at-2 ℃ and -18 ℃.This might be attributed to that the protein degradation at lower temperatures was much lower than that of 4 ℃ during 4 days’ storage, which was in good agreement with the results showed in the TVB-N content analysis.After 12 days’ storage, the microstructure of superchilled samples seemed to still maintain the compactness of the fibre bundles and the gaps were smaller than that of the frozen sample at the same storage time.In addition, those bundles were more compact than that of the chilled samples in 4 days of storage indicating that prepared chicken steak under super-chilled storage could maintain the integrity of the microstructure of muscle.The microstructure of the samples under frozen storage was collapsed in long time storage(-18 ℃, 60 d).Similar results were reported in the study on the quality characteristics during the storage of rabbit muscle at different temperatures, where frozen samples bore more obvious damage to the muscle fibres than chilled samples.And such difference might be caused by protein denaturation and damage of ice crystals[34].Thus,super-chilled storage might be the most efficient method in the storage of prepared chicken steak in terms of the microstructure of the chicken muscle.
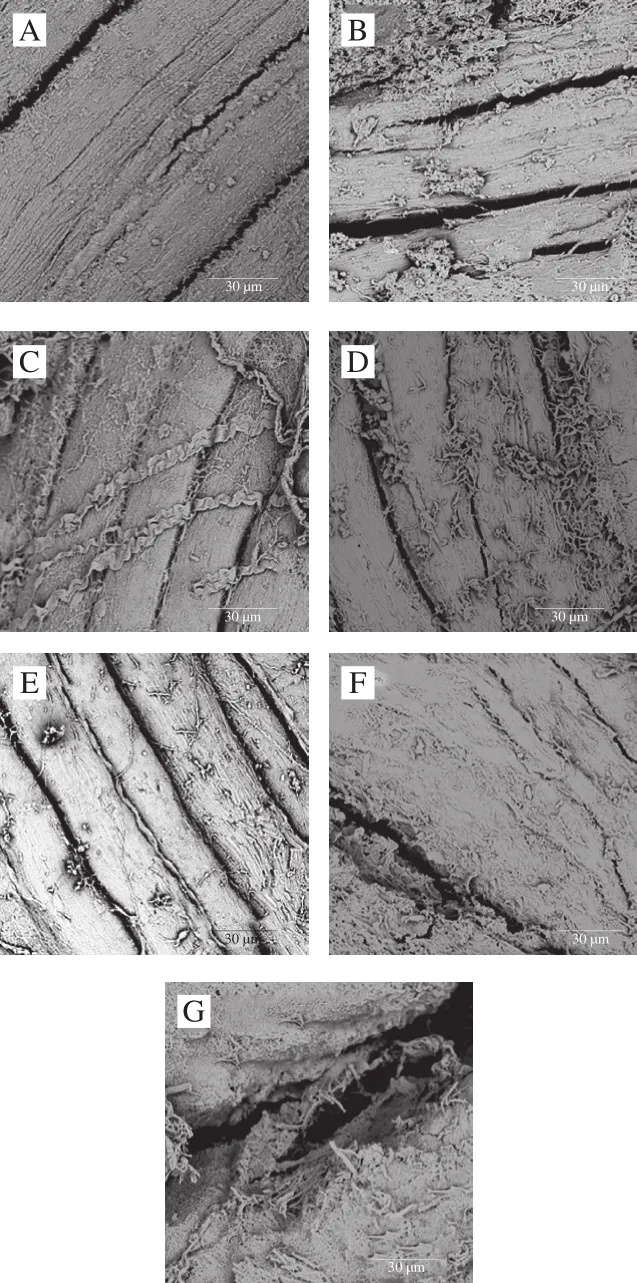
Fig.8 SEM images showing the microstructure of prepared chicken steak at different time points during storage at different temperatures
3 Conclusions
The storage temperature had a significant impact on the quality of prepared chicken steak.On one hand, frozen storage could obtain the longest shelf-life (more than 3 months) due to high resistant to bacterial attack.For super-chilled and chilled storage, the shelf-life was within 12 days and 4 days, respectively.On the other hand,physicochemical analysis revealed that super-chilled was more stable in pH, color, and texture, in addition to a lowest storage loss throughout its shelf-life.Further, super-chilled samples had the highest resistance against microstructure changes induced by water loss.In conclusion, super-chilledstorage of prepared chicken steak could endow relatively longer shelf-life than chilled storage and maintain the meat quality to a large extent.Along with the consideration of energy costs, super-chilled is preferred in the storage of prepared meat products.
